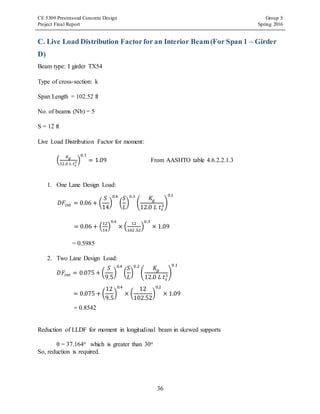
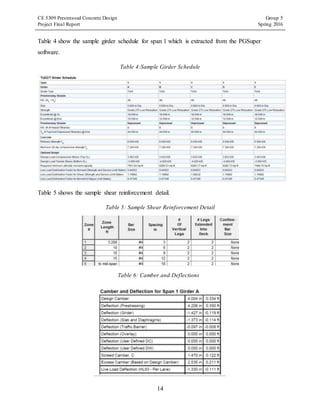
This document provides a design summary for Bridge 205 of the I-35W Extension Project. The project involved designing pre-tensioned prestressed concrete girders for the seven spans of the bridge using PGSuper software. Span 2, the longest at 230.58 feet, required 15 Tx70 girders to meet stress limits, while the other spans used mostly 5 Tx54 girders, except Span 4 which used 5 Tx70 girders. Analysis was performed for moments, shears, stresses, deflections and other limit states. Design details such as mild steel reinforcement, girder schedules, and shop drawings are provided to summarize the project.
![CE 5309 Prestressed Concrete Design Group 5
Project Final Report Spring 2016
7
composite cast-in-place deck that is 8'' thick was used with a strength of f'c=4 ksi, Ec=3605 ksi.
The various type of TxDOT girder was used for each span as per need for the most economical
design.
The girders were designed with f'c = 8.5 ksi, f'ci= 6 ksi, Ec= 5255 ksi initially but it was changed
as per the requirement. The limitation of the practical length of a precast prestressed concrete
girder is 230'. The location of the piers was not allowed to change so we had to use the same seven
span as in the original design drawings. The width of the bridge was also not allowed to be
changed.
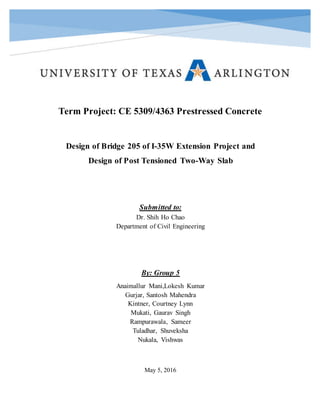
2.3 PGSuper Analysis and DesignProcedure
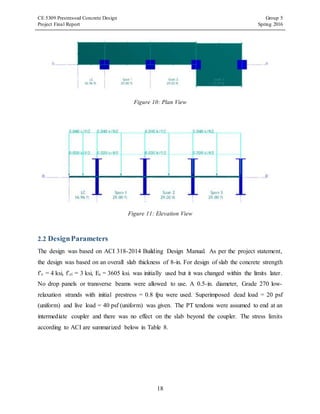
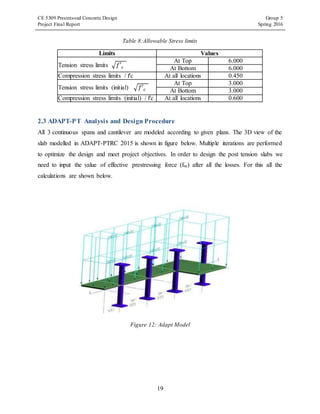
The PG Super software has a built in material library and modeling template. All 7 spans are
modeled according to the alignment given in the Bridge 205 plans. The overall plan and a cross
section view of span 1 is shown in figures 1 and 2. An initial trial is performed by modeling the
similar cross-sections and number of girders for all spans as given in input drawings of Bridge
205. Multiple iterations of specification checks are performed with numerous checks to optimize
the design and meet project objectives. Girder size, number of strands, amount of mild steel
reinforcement and debonding patterns are tried in various combinations to come up with our final
design. The following are the checks PG Super does when analyzing the bridge. A sample of the
output from some of these checks can be found in Appendix A-1.
Strand Stresses [5.9.3]
Stress Check for Service I for Casting Yard Stage (At Release) [5.9.4.1.2]
Stress Check for Service I for Deck and Diaphragm Placement (Bridge Site 1)
Stress Check for Service I for Final without Live Load (Bridge Site 2) [5.9.4.2.1]
Stress Check for Compressive Stresses for Service I for Final with Live Load (Bridge Site 3)
[5.5.3.1]
Stress Check for Tensile Stresses for Service III for Final with Live Load (Bridge Site 3)
[5.9.4.2.2]
Stress Check for Compressive Stresses for Fatigue I for Final with Live Load (Bridge Site 3)
[5.5.3.1]](https://image.slidesharecdn.com/9fc83b8a-4afe-4a7a-8f7d-152da85e35d8-161012150617/85/Final-Report-Group-5-8-320.jpg)
![CE 5309 Prestressed Concrete Design Group 5
Project Final Report Spring 2016
8
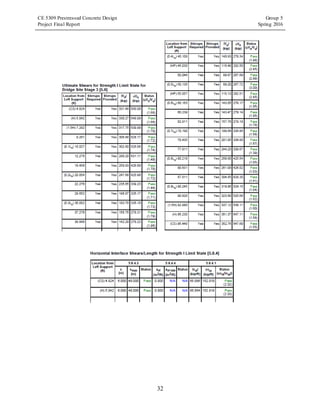
Positive Moment Capacity for Strength I Limit State for Final with Live Load Stage (Bridge
Site 3) [5.7]
Ultimate Shears for Strength I Limit State for Bridge Site Stage 3 [5.8]
Horizontal Interface Shears/Length for Strength I Limit State [5.8.4]
Longitudinal Reinforcement for Shear Check - Strength I [5.8.3.5]
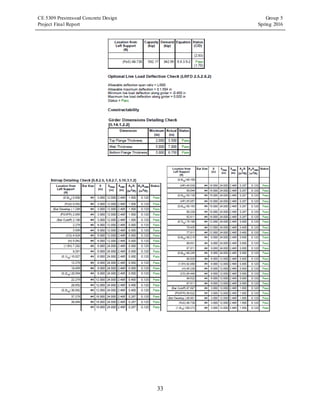
Optional Live Load Deflection Check (LRFD 2.5.2.6.2)
Girder Dimensions Detailing Check [5.14.1.2.2]
Stirrup Detailing Check [5.8.2.5, 5.8.2.7, 5.10.3.1.2]
Camber Check
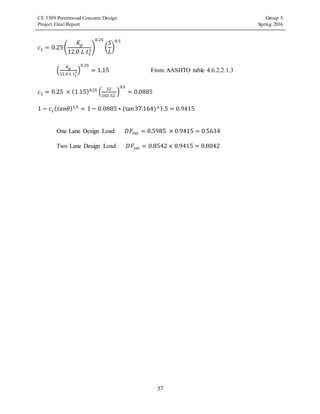
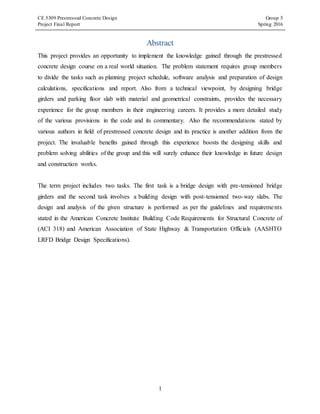
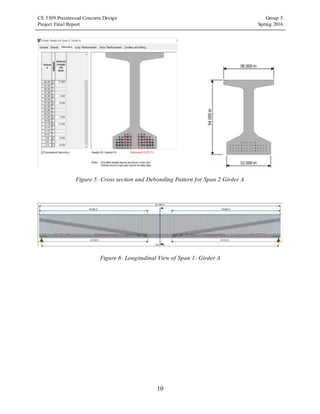
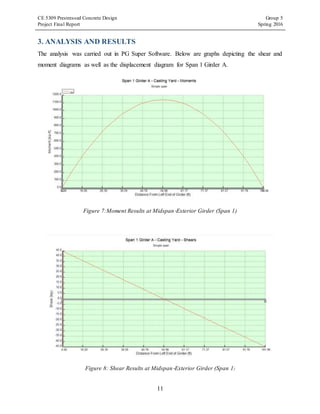
Span 2 proved to be the most difficult span to design due to its length of 230'. The original plans
for Bridge 205 show this span using steel plate girders to make transportation and construction
feasible at site. Initial design started with 6-Tx70 girders and continued until the maximum number
of girders could fit within the width of the bridge while keeping in mind the minimum spacing
requirement of 3.5’. Due to its long span, the stress limits in concrete at initial and service stage
had to be increased beyond the project permissible values, as allowed by Dr. Chao. The final f’ci
and f’c in our design are 9 ksi and 15 ksi, respectively. Eventually 15-Tx70 girders were required
in Span 2 (Figure 3 and 4) to ensure the capacity to demand ratio was equal to or greater than 1.0
for various stress stages and girder locations listed below.
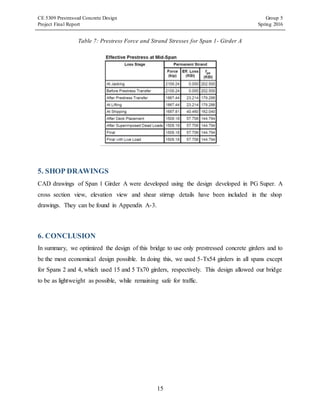
A similar approach is used to design the remaining spans and designs for every span are grouped
to streamline the designs and achieve feasibility in construction planning. 5-Tx54 girders were
safe in every span except for Span 4. For Span 4 the maximum number of girders for Tx54 with
the minimum spacing was unsafe, hence increased the girder size to 8-Tx62. An optional design
with 5-Tx70 was checked for span 4 and was finalized since the material weight was significantly
lower than 8-Tx62 (Figure 5).](https://image.slidesharecdn.com/9fc83b8a-4afe-4a7a-8f7d-152da85e35d8-161012150617/85/Final-Report-Group-5-9-320.jpg)
![CE 5309 Prestressed Concrete Design Group 5
Project Final Report Spring 2016
21
𝐾𝐶𝑆 = 0.87 −
(0.87 − 0.77)
(4 − 3)
(3.91 − 3) = 0.779 > 0.68 𝑓𝑜𝑟 𝑐𝑟𝑒𝑒𝑝
𝐶𝑐𝑡( 𝑡) =
182500.6
182500.6 + 10
(2.0)(0.868)(0.873)(0.779) = 1.1487
𝑓𝑐𝑖
′
= 6000 𝑝𝑠𝑖
𝐸𝑐𝑖 = 57000√𝑓𝑐𝑖
′
= 57000 ∗
√6000
1000
= 4415 𝑘𝑠𝑖
𝑓𝑐𝑖 = 216 ∗ 1000 ∗ 17 ∗ 0.294/1680 = 642.6 𝑝𝑠𝑖
𝜀 𝑐𝑖 =
𝑓𝑐𝑖
𝐸𝑐𝑖
=
642.6𝑥10−3
4415
= 1.455𝑥10−4
𝐶𝑐( 𝑡) =
𝜀 𝑐( 𝑡)
𝜀 𝑐𝑖
→ 𝜀 𝑐( 𝑡) = 𝐶𝑐( 𝑡) ∗ 𝜀 𝑐𝑖 = 1.1487 ∗ 1.455𝑥10−4
= 1.672 ∗ 10−4
∆𝑓𝑝𝑠 = 𝐸 𝑝𝑠 ∗ 𝜀 𝑐( 𝑡) = 28500∗ 1.672 ∗ 10−4
= 4.765 𝑘𝑠𝑖
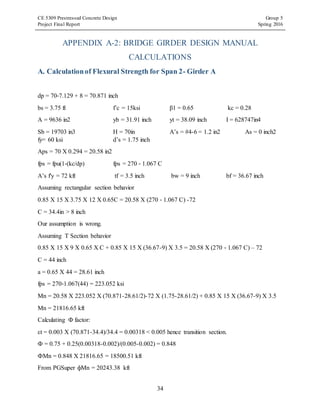
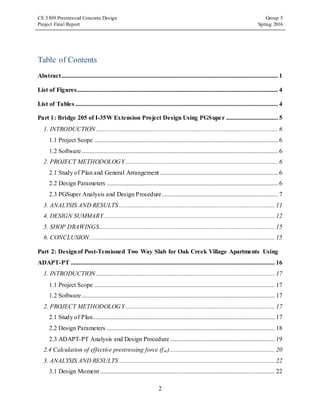
3. Losses due to Relaxation of strands
∆𝑓𝑝𝑟 = 𝑓𝑝𝑖
log( 𝑡)
𝐾
[
𝑓𝑝𝑖
𝑓𝑝𝑦
− 0.55]
K=45 for Low relaxation strands
For low-relaxation strands: 𝑓𝑝𝑦 = 0.9𝑓𝑝𝑢 = 0.9 ∗ 270 = 243 𝑘𝑠𝑖
𝑓𝑝𝑖 = 0.8𝑓𝑝𝑢 = 0.8 ∗ 270 = 216 𝑘𝑠𝑖
∆𝑓𝑝𝑟 = 216 ∗
log(18250)
45
[
216
243
− 0.55] = 6.931 𝑘𝑠𝑖
∴ Total losses = 22.316 ksi
∴ 𝒇 𝒑𝒆 = 𝟐𝟏𝟔 − 𝟐𝟐. 𝟑𝟏𝟔 = 𝟏𝟗𝟑. 𝟔𝟖 𝒌𝒔𝒊](https://image.slidesharecdn.com/9fc83b8a-4afe-4a7a-8f7d-152da85e35d8-161012150617/85/Final-Report-Group-5-22-320.jpg)
![CE 5309 Prestressed Concrete Design Group 5
Project Final Report Spring 2016
23
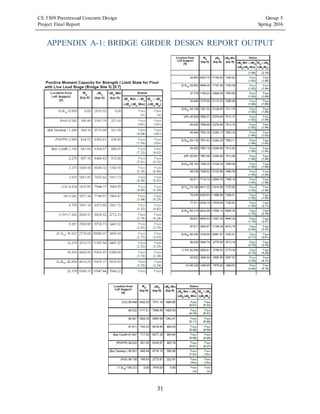
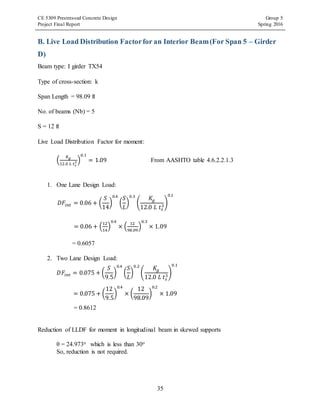
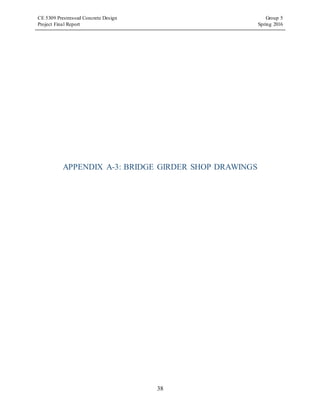
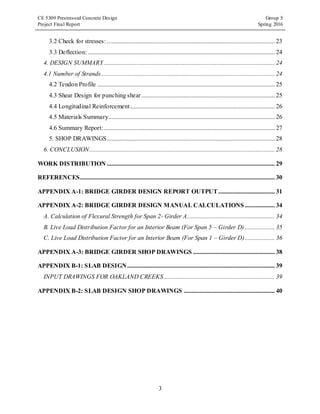
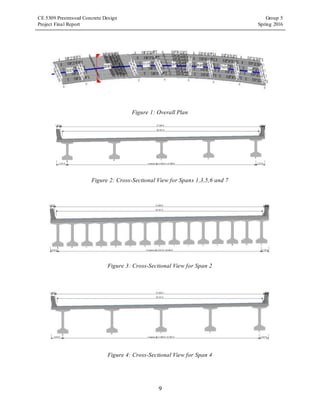
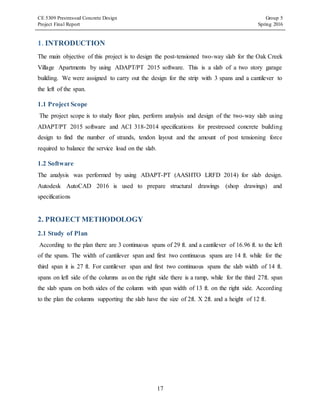
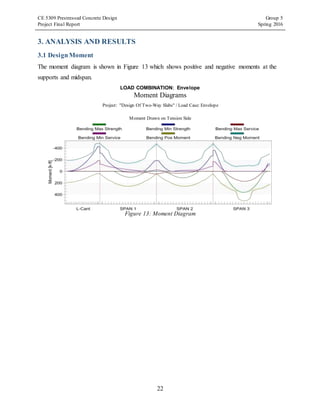
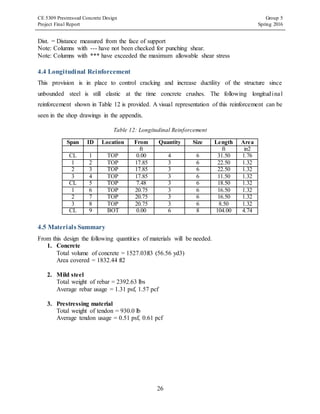
3.2 Check for stresses:
According to ACI 318-2014 the checks for limiting stresses at service are given by ADAPT-PT
are as follows:
Figure 14: Stress Diagrams
-500
-400
-300
-200
-100
0
100
200
300
400
500
L-Cant SPAN1 SPAN2 SPAN3
Stress Diagrams
Project: "DesignOfTwo-WaySlabs" /LoadCase:Envelope
Tensile Stress Positive
Stress[psi]
AllowableStresses TopMax TopMin
-1000
-800
-600
-400
-200
0
200
L-Cant SPAN1 SPAN2 SPAN3
Stress Diagrams
Project: "DesignOfTwo-WaySlabs" /LoadCase:Envelope
Tensile Stress Positive
Stress[psi]
AllowableStresses BottomMax BottomMin](https://image.slidesharecdn.com/9fc83b8a-4afe-4a7a-8f7d-152da85e35d8-161012150617/85/Final-Report-Group-5-24-320.jpg)
![CE 5309 Prestressed Concrete Design Group 5
Project Final Report Spring 2016
24
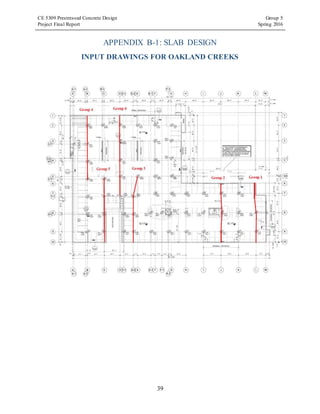
3.3 Deflection:
The figure 15 shows the deflection for all the three spans.
Figure 15: Deflection
4. DESIGN SUMMARY
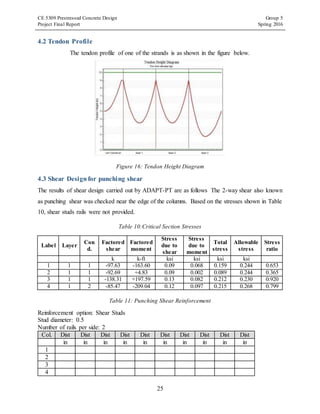
4.1 Number of Strands
The number of strands as per the design parameters, loading and the strength and geometry of the
slab was calculated by the ADAPT-PT. The number of strands was 17.
Table 9: Number of Strands and Tendon Force
2.0
1.5
1.0
0.5
0
Left Cantilever Span1 Span2 Span3
Deflection Diagrams
File: final safe adapt dgn
Deflection[in]
ServiceEnv. MaxTotal ServiceEnv. MinTotal](https://image.slidesharecdn.com/9fc83b8a-4afe-4a7a-8f7d-152da85e35d8-161012150617/85/Final-Report-Group-5-25-320.jpg)
![CE 5309 Prestressed Concrete Design Group 5
Project Final Report Spring 2016
27
4.6 Summary Report:
ADAPT - STRUCTURAL CONCRETE SOFTWARE SYSTEM
ADAPT-PT Version "2015" Date: "05 - 01 - 2016" Time: "21:36" File: final safe adapt dgn
1 - PROJECT TITLE: "Design Of Two-Way Slabs"
1.1 Design Strip: Group-5
1.2 Load Case: Envelope
2 - MEMBER ELEVATION
[ft] 16.96 29.00 29.00 29.00
L-Cant SPAN 1 SPAN 2 SPAN 3
3 - TOP REBAR
3.1 ADAPT selected
3.2 ADAPT selected
3.3 Num. of layers
1 4#6X31'6" 2 3#6X22'6" 3 3#6X22'6" 4 3#6X11'6"
5 3#6X18'6" 6 3#6X16'6" 7 3#6X16'6" 8 3#6X8'6"
1 1 1 1 1 1 1 1 1 1 1 1
4 - TENDON PROFILE
4.1 Datum Line
4.2 CGS Distance A [in]
4.6 CGS Distance B [in]
4.10 CGS Distance C [in]
4.14 Force/Width [kips/ft]
4.3 Force A [kips]
4.7 Force B [kips]
4.11 Force C [kips]
5.005.005.00 9.00
433.872
3.50 9.00
433.872
3.503.50 9.00
433.872
1.751.75 5.00
433.872
30.99 30.99 30.99 16.07 .00
5 - BOTTOM REBAR
5.1 ADAPT selected
5.2 ADAPT selected
5.3 Num. of layers
9 6#8X10⁴'0"
1 1 1 1 1 1 1 1 1 1 1 1
6 - REQUIRED & PROVIDED BARS
6.1 Top Bars
[ in2]r e q u i r e d
p r o v i d e d
6 . 2 B o t t o m B a r s
m a x
m a x
0.0
1.6
3.2
1.2
2.4
3.6
4.8
2.83
0.00
2.83
0.00
2.61
0.00
2.61
4.30
7 - PUNCHING SHEAR
OK=Acceptable
RE=Reinforce
NG=Exceeds code
NA=not applicable
or not performed
0.00
0.00
0.65
- 97.63
- 163.60
OK
0.37
- 92.69
4.83
OK
0.92
- 138.31
197.59
OK
0.80
- 85.47
- 209.04
OK
7.1 Stress Ratio
Shear Force [kips]
Bending Moment [kips*ft]
7.2 Status
8 - LEGEND Stressing End Dead End
9 - DESIGN PARAMETERS
9.1 Code: American ACI318 (2011)/IBC (2012) f'c = 8000 psi fy = 60 ksi (longitudinal) fy = 60 ksi (shear) fpu = 270 ksi
9 . 2 R e b a r C o v e r : T o p = 1 i n B o t t o m = 1 i n R e b a r T a b l e :
10 - MATERIAL QUANTITIES
CONCRETE
Total volume of concrete = 1527.0 ft3
Area covered = 1832.4 ft2
M I L D S T E E L
T o t a l w e i g h t o f r e b a r = 2 3 7 4 . 8 l b
Average rebar usage = 1.296 lb/ft2, 1.555 lb/ft3
P R E S T R E S S I N G S T E E L
T o t a l w e i g h t o f t e n d o n = 9 3 0 . 0 l b
Average tendon usage = 0.508 lb/ft2, 0.609 lb/ft3
11 - DESIGNER'S NOTES](https://image.slidesharecdn.com/9fc83b8a-4afe-4a7a-8f7d-152da85e35d8-161012150617/85/Final-Report-Group-5-28-320.jpg)