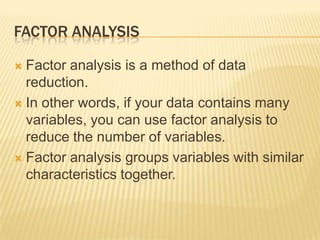
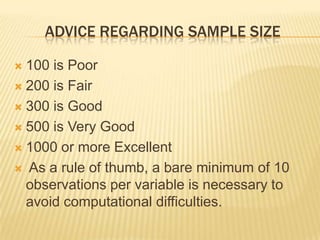
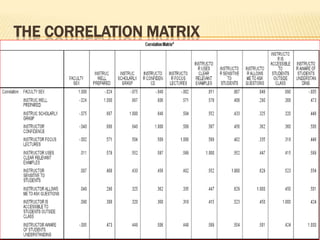
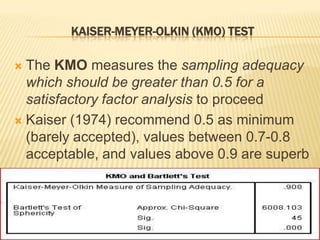
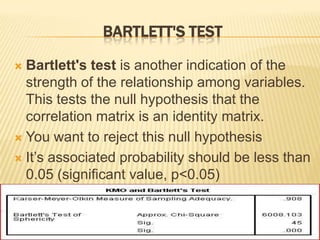
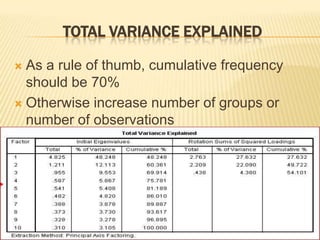
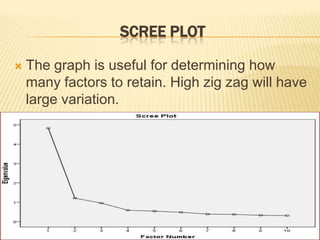
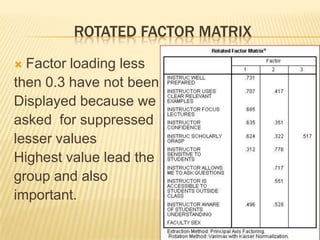
EFA (EXPLORATORY FACTORY ANALYSIS)
FACTOR ANALYSIS
 Factor analysis is a method of data
reduction.
 In other words, if your data contains many
variables, you can use factor analysis to
reduce the number of variables.
 Factor analysis groups variables with similar
characteristics together.
ADVICE REGARDING SAMPLE SIZE
 100 is Poor
 200 is Fair
 300 is Good
 500 is Very Good
 1000 or more Excellent
 As a rule of thumb, a bare minimum of 10
observations per variable is necessary to
avoid computational difficulties.
THE CORRELATION MATRIX
KAISER-MEYER-OLKIN (KMO) TEST
 The KMO measures the sampling adequacy
which should be greater than 0.5 for a
satisfactory factor analysis to proceed
 Kaiser (1974) recommend 0.5 as minimum
(barely accepted), values between 0.7-0.8
acceptable, and values above 0.9 are superb
BARTLETT'S TEST
 Bartlett's test is another indication of the
strength of the relationship among variables.
This tests the null hypothesis that the
correlation matrix is an identity matrix.
 You want to reject this null hypothesis
 It’s associated probability should be less than
0.05 (significant value, p<0.05)
TOTAL VARIANCE EXPLAINED
 As a rule of thumb, cumulative frequency
should be 70%
 Otherwise increase number of groups or
number of observations
SCREE PLOT
 The graph is useful for determining how
many factors to retain. High zig zag will have
large variation.
ROTATED FACTOR MATRIX
 Factor loading less
then 0.3 have not been
Displayed because we
asked for suppressed
lesser values
Highest value lead the
group and also
important.

Factor Analysis

  • 1.
  • 2.
    FACTOR ANALYSIS  Factoranalysis is a method of data reduction.  In other words, if your data contains many variables, you can use factor analysis to reduce the number of variables.  Factor analysis groups variables with similar characteristics together.
  • 3.
    ADVICE REGARDING SAMPLESIZE  100 is Poor  200 is Fair  300 is Good  500 is Very Good  1000 or more Excellent  As a rule of thumb, a bare minimum of 10 observations per variable is necessary to avoid computational difficulties.
  • 4.
  • 5.
    KAISER-MEYER-OLKIN (KMO) TEST The KMO measures the sampling adequacy which should be greater than 0.5 for a satisfactory factor analysis to proceed  Kaiser (1974) recommend 0.5 as minimum (barely accepted), values between 0.7-0.8 acceptable, and values above 0.9 are superb
  • 6.
    BARTLETT'S TEST  Bartlett'stest is another indication of the strength of the relationship among variables. This tests the null hypothesis that the correlation matrix is an identity matrix.  You want to reject this null hypothesis  It’s associated probability should be less than 0.05 (significant value, p<0.05)
  • 7.
    TOTAL VARIANCE EXPLAINED As a rule of thumb, cumulative frequency should be 70%  Otherwise increase number of groups or number of observations
  • 8.
    SCREE PLOT  Thegraph is useful for determining how many factors to retain. High zig zag will have large variation.
  • 9.
    ROTATED FACTOR MATRIX Factor loading less then 0.3 have not been Displayed because we asked for suppressed lesser values Highest value lead the group and also important.