Download to read offline


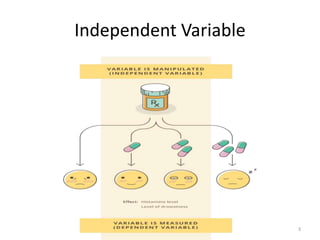

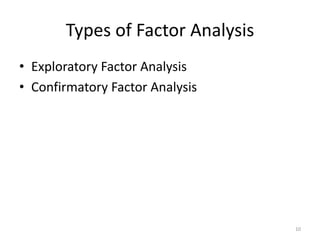
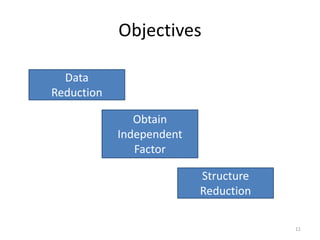
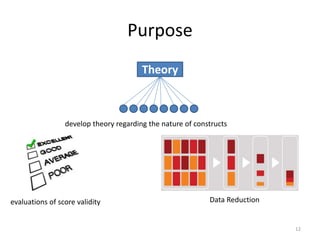
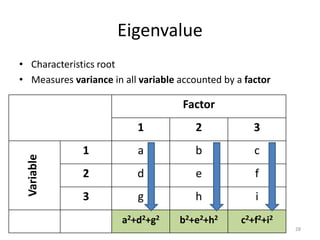
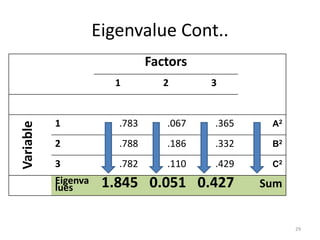
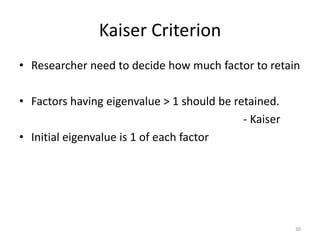
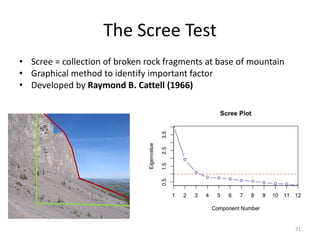

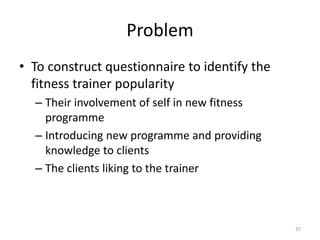


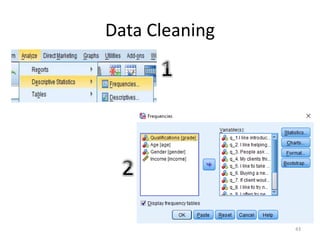

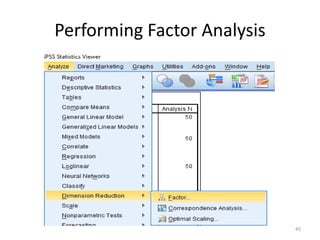
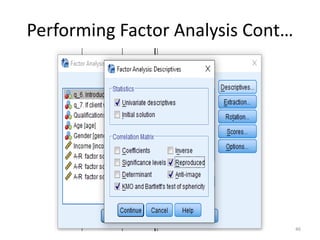
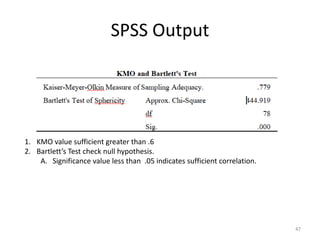
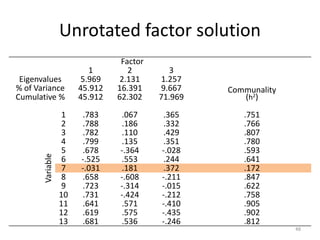

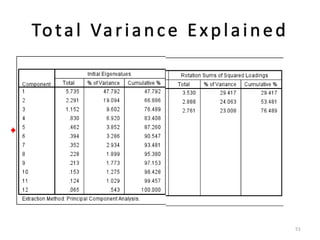
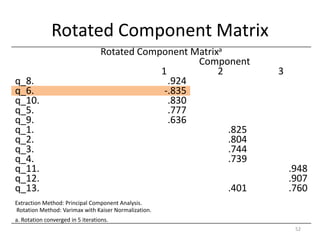
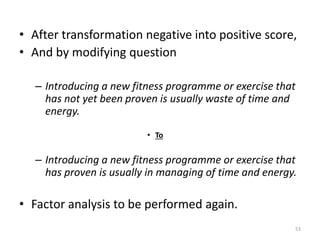
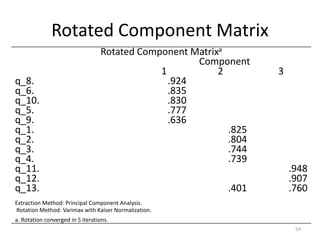
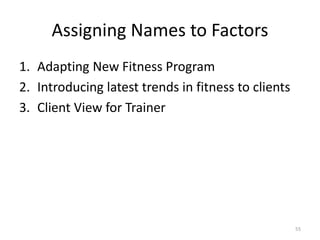
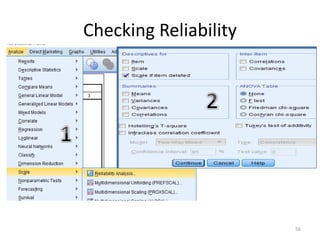
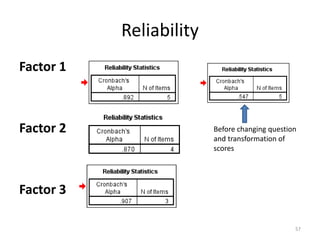


This document presents a factor analysis that was conducted to identify factors related to fitness trainer popularity. It discusses the research problem, domain, and hypotheses. A 13-item questionnaire was administered to 50 fitness trainers. The data was cleaned and factor analysis was performed. Three factors were extracted based on eigenvalues above 1, explaining 72% of the variance. The factors were interpreted as adapting new fitness programs, introducing latest trends to clients, and client view of the trainer. Reliability analysis found the factors to be reliable.


![7.__Developing_a_Research_Proposal[1].pptx](https://cdn.slidesharecdn.com/ss_thumbnails/7-260131073037-df92dd7d-thumbnail.jpg?width=640&height=640&fit=bounds)


![제 23회 보아즈(BOAZ) 빅데이터 컨퍼런스 - [MBOAX] : ABSA를 활용한 소비자 반응 분석 기반 운영 효율화 대시보드 설계](https://cdn.slidesharecdn.com/ss_thumbnails/3-1boaz23rdconferencemboax-260203102709-9d519923-thumbnail.jpg?width=640&height=640&fit=bounds)


