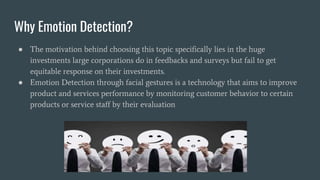
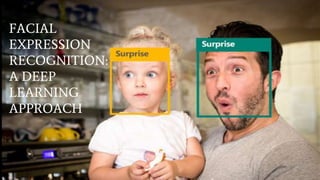
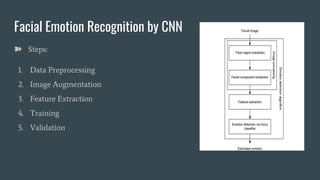
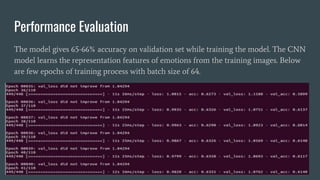
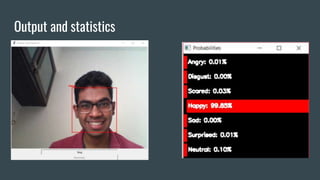
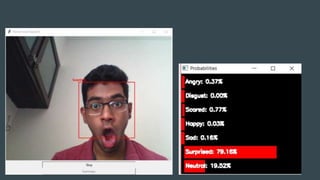
The document discusses facial emotion recognition through various techniques, including support vector machines and convolutional neural networks, emphasizing its application in business for enhancing customer feedback and job candidate assessment. It describes data preprocessing, augmentation, and model architecture, culminating in a mini-exception model for emotion recognition with specified performance metrics. The model achieves 65-66% accuracy during validation, indicating effective learning of emotion representations from training images.

![Emotion Expression Recognition Using SVM
What are Support Vector Machines?
SVMs plot the training vectors in high-dimensional
feature space, and label each vector with its class. A
hyperplane is drawn between the training vectors
that maximizes the distance between the different
classes. The hyperplane is determined through a
kernel function (radial basis, linear, polynomial or
sigmoid), which is given as input to the classification
software. [1999][Joachims, 1998b].](https://image.slidesharecdn.com/fer2-190330184900/85/Facial-Emotion-Recognition-A-Deep-Learning-approach-4-320.jpg)
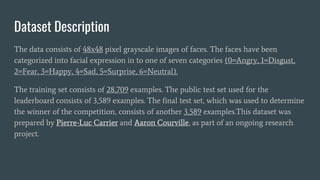
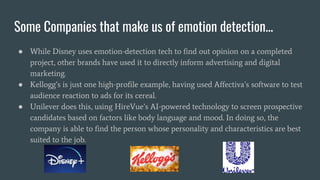
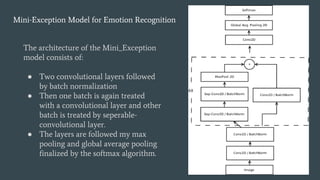
![Data Preprocessing
● The fer2013.csv consists of three columns namely emotion, pixels and purpose.
● The column in pixel first of all is stored in a list format.
● Since computational complexity is high for computing pixel values in the range of
(0-255), the data in pixel field is normalized to values between [0-1].
● The face objects stored are reshaped and resized to the mentioned size of 48 X 48.
● The respective emotion labels and their respective pixel values are stored in
objects.
● We use scikit-learn’s train_test_split() function to split the dataset into training
and testing data. The test_size being 0.2 meaning, 20% of data is for validation
while 80% of the data will be trained.](https://image.slidesharecdn.com/fer2-190330184900/85/Facial-Emotion-Recognition-A-Deep-Learning-approach-9-320.jpg)


![Getting Started with Apache Spark: Big Data Made Simple [Free Meetup]](https://cdn.slidesharecdn.com/ss_thumbnails/apachesparkgettingstarted-260203175547-8361bcc3-thumbnail.jpg?width=640&height=640&fit=bounds)


