Downloaded 115 times
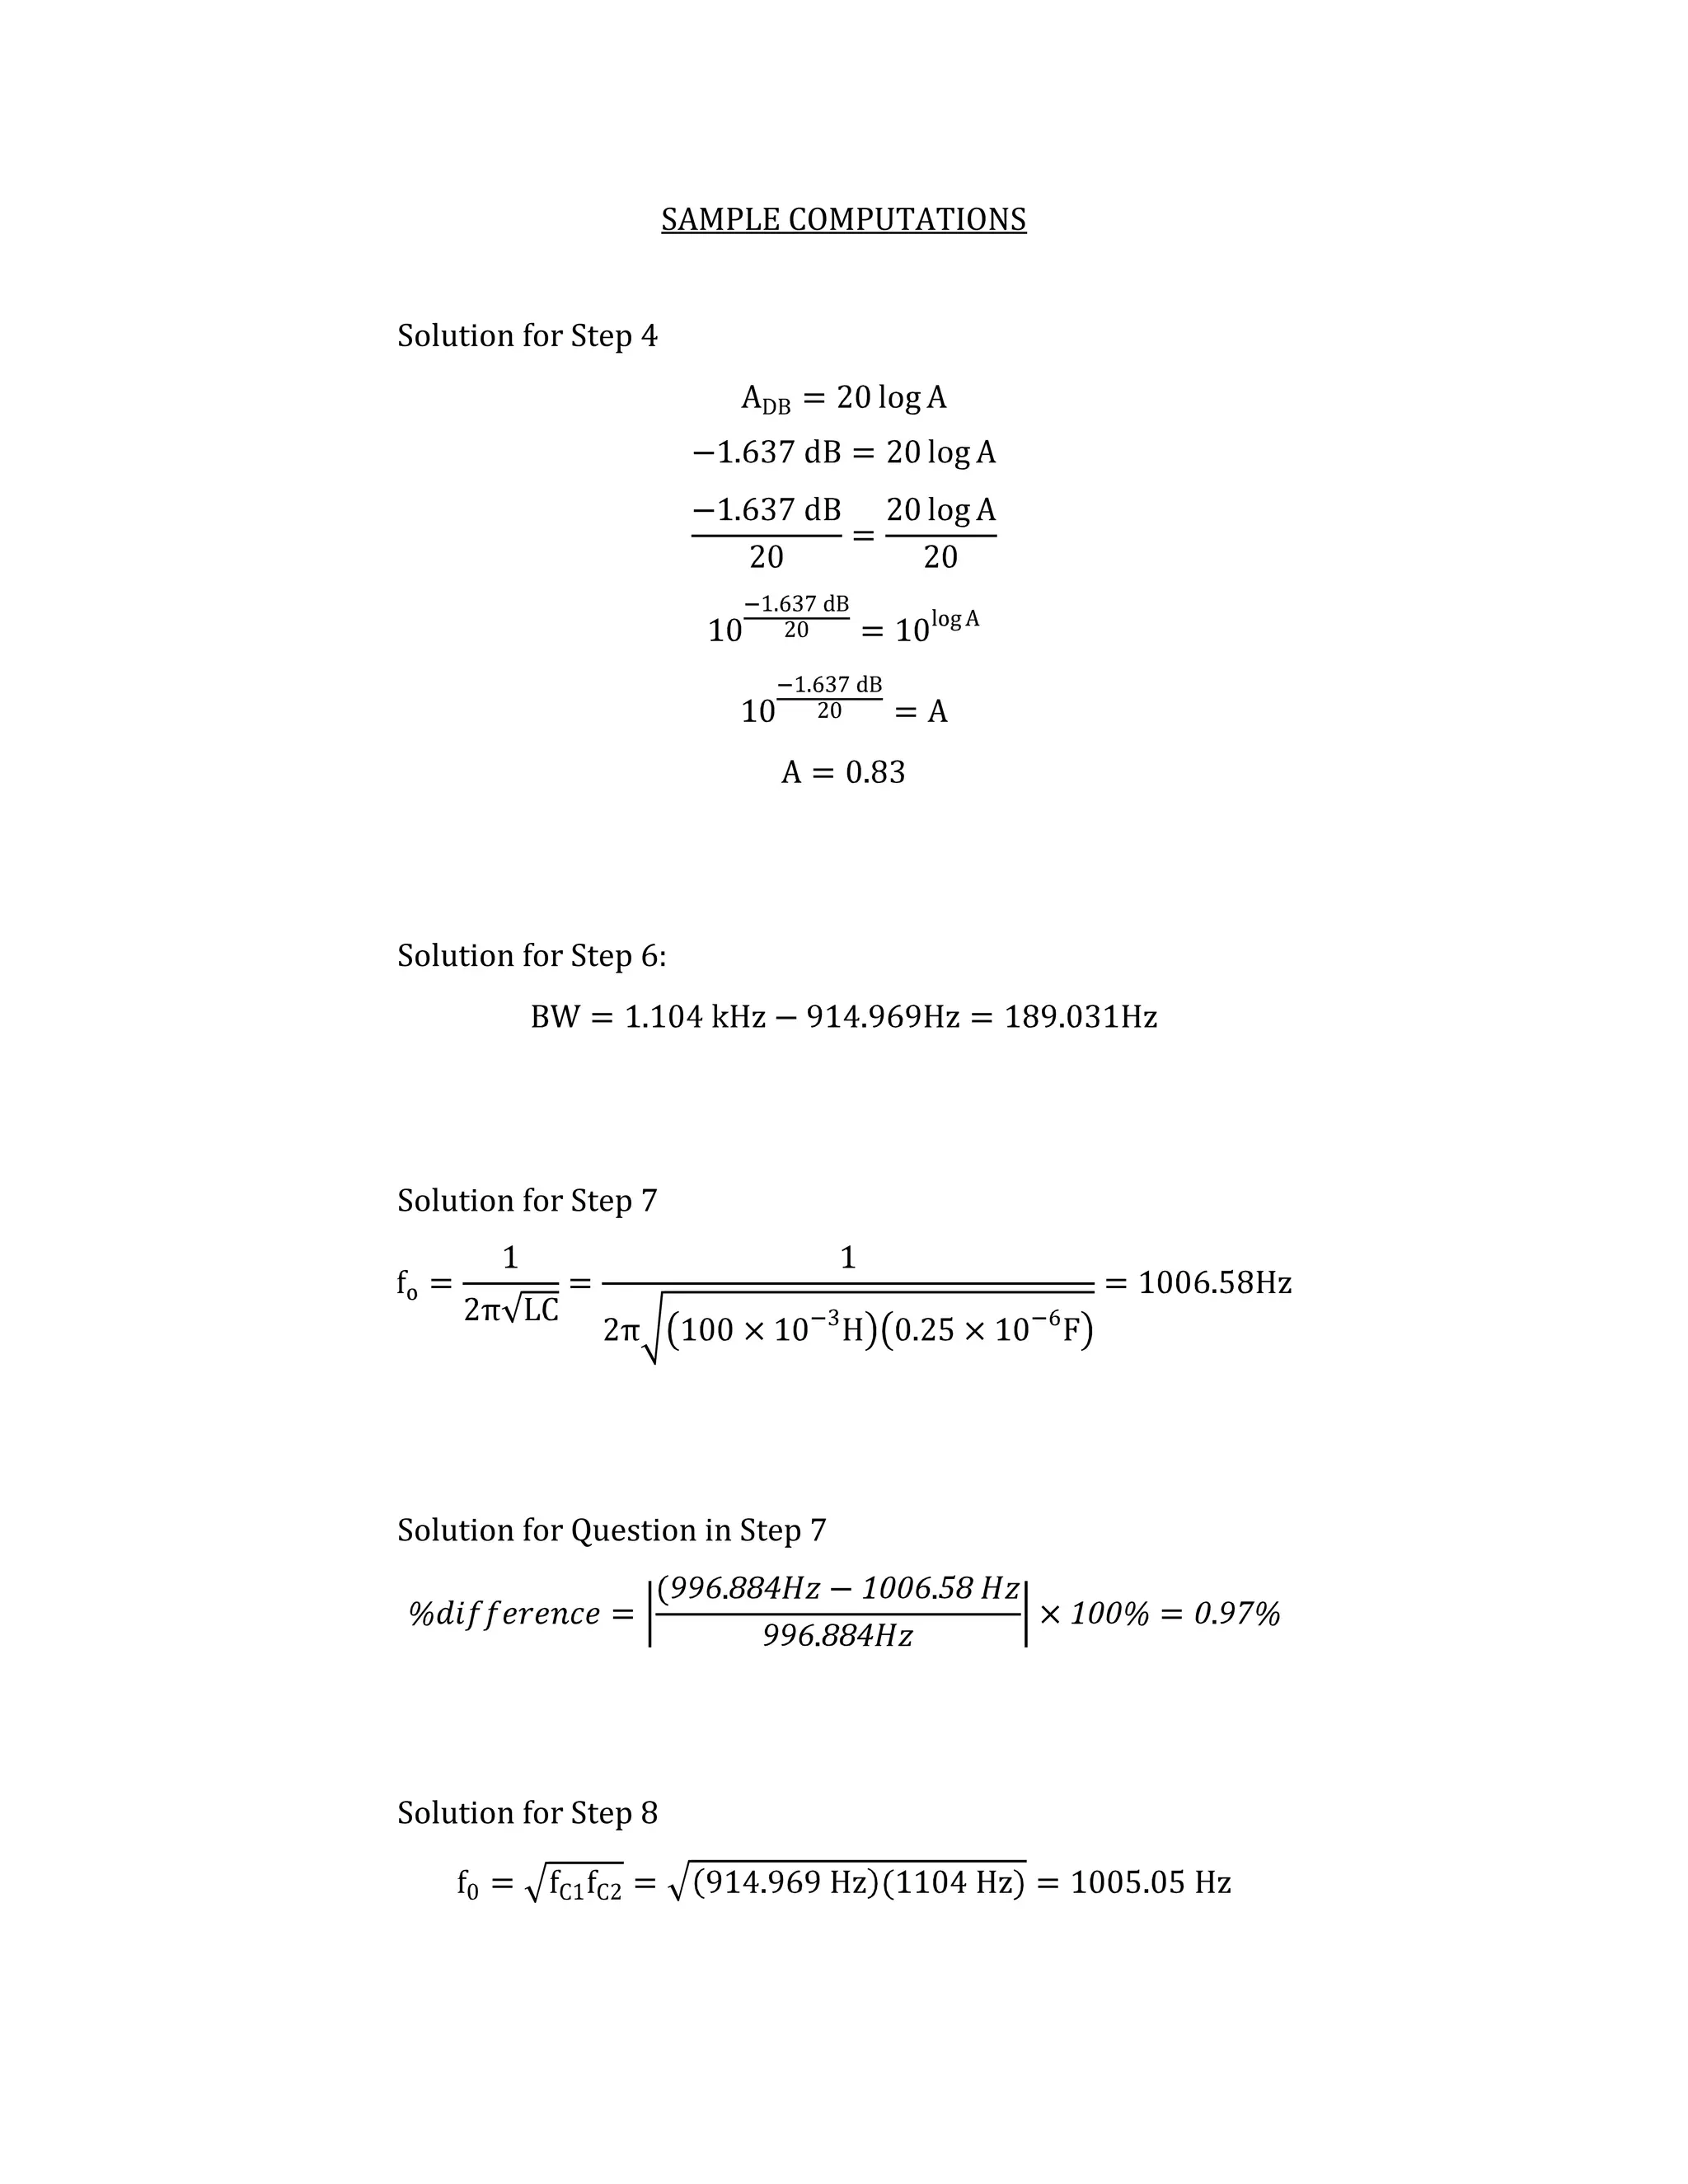

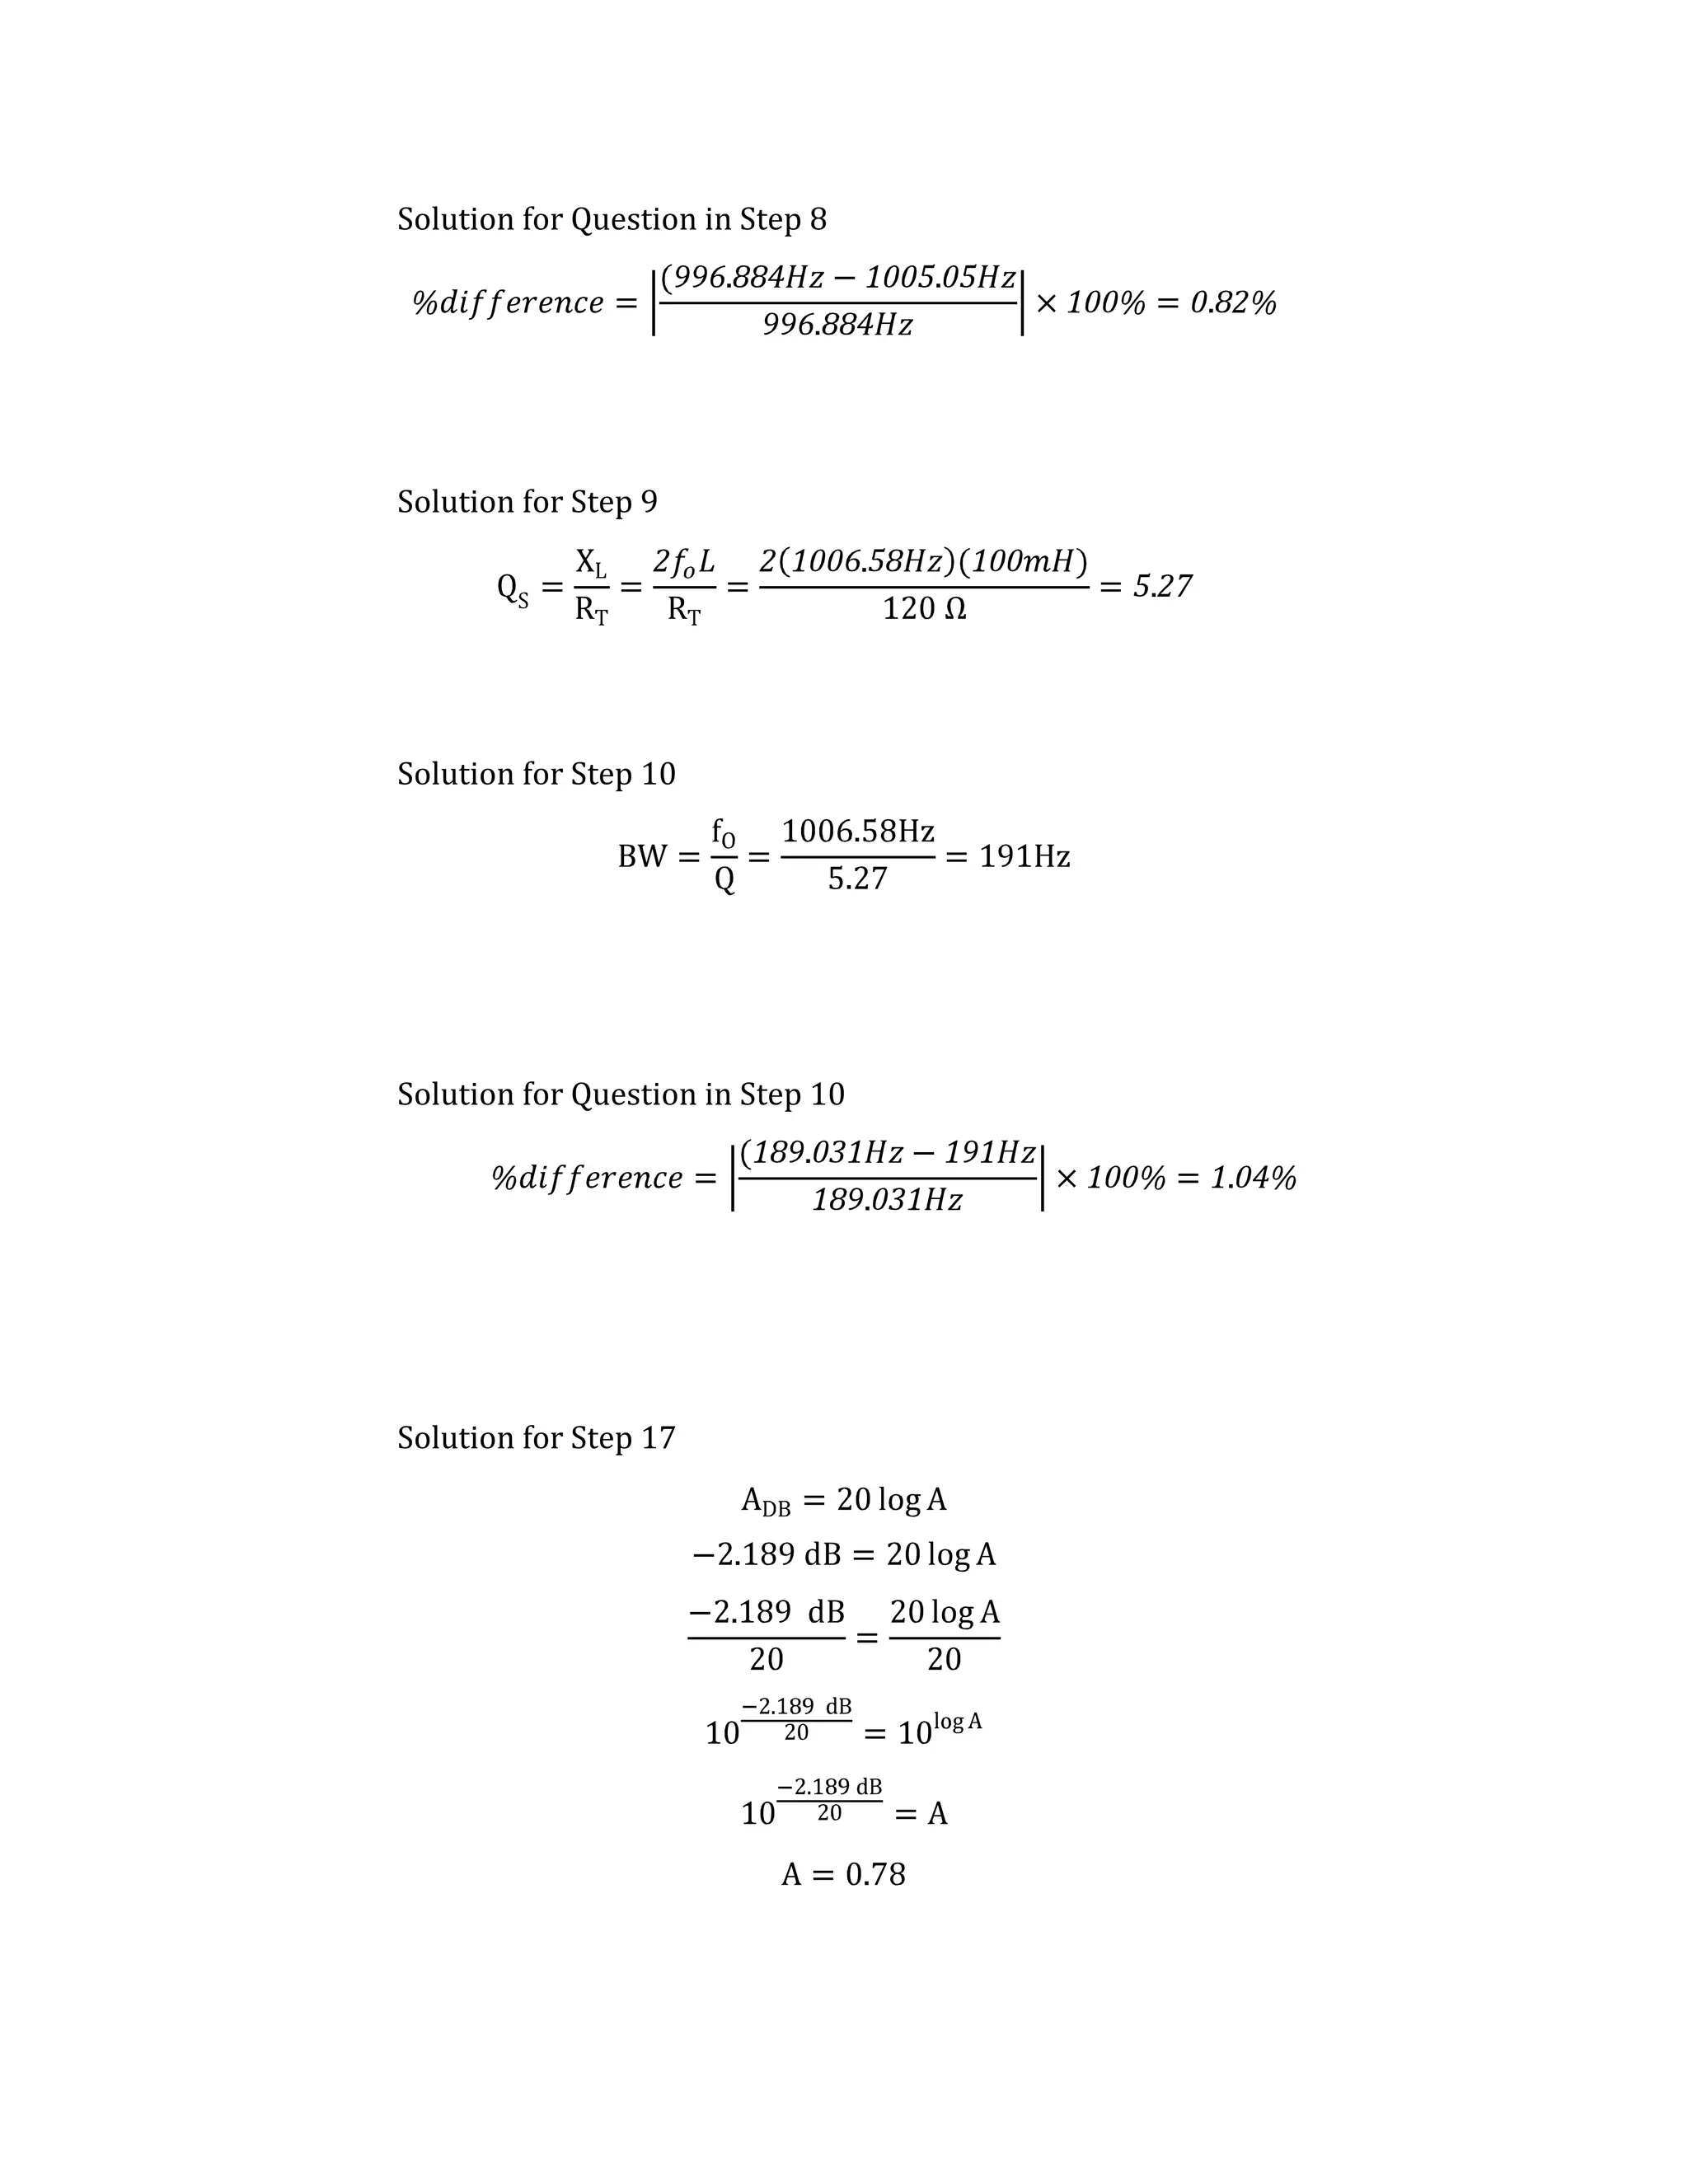
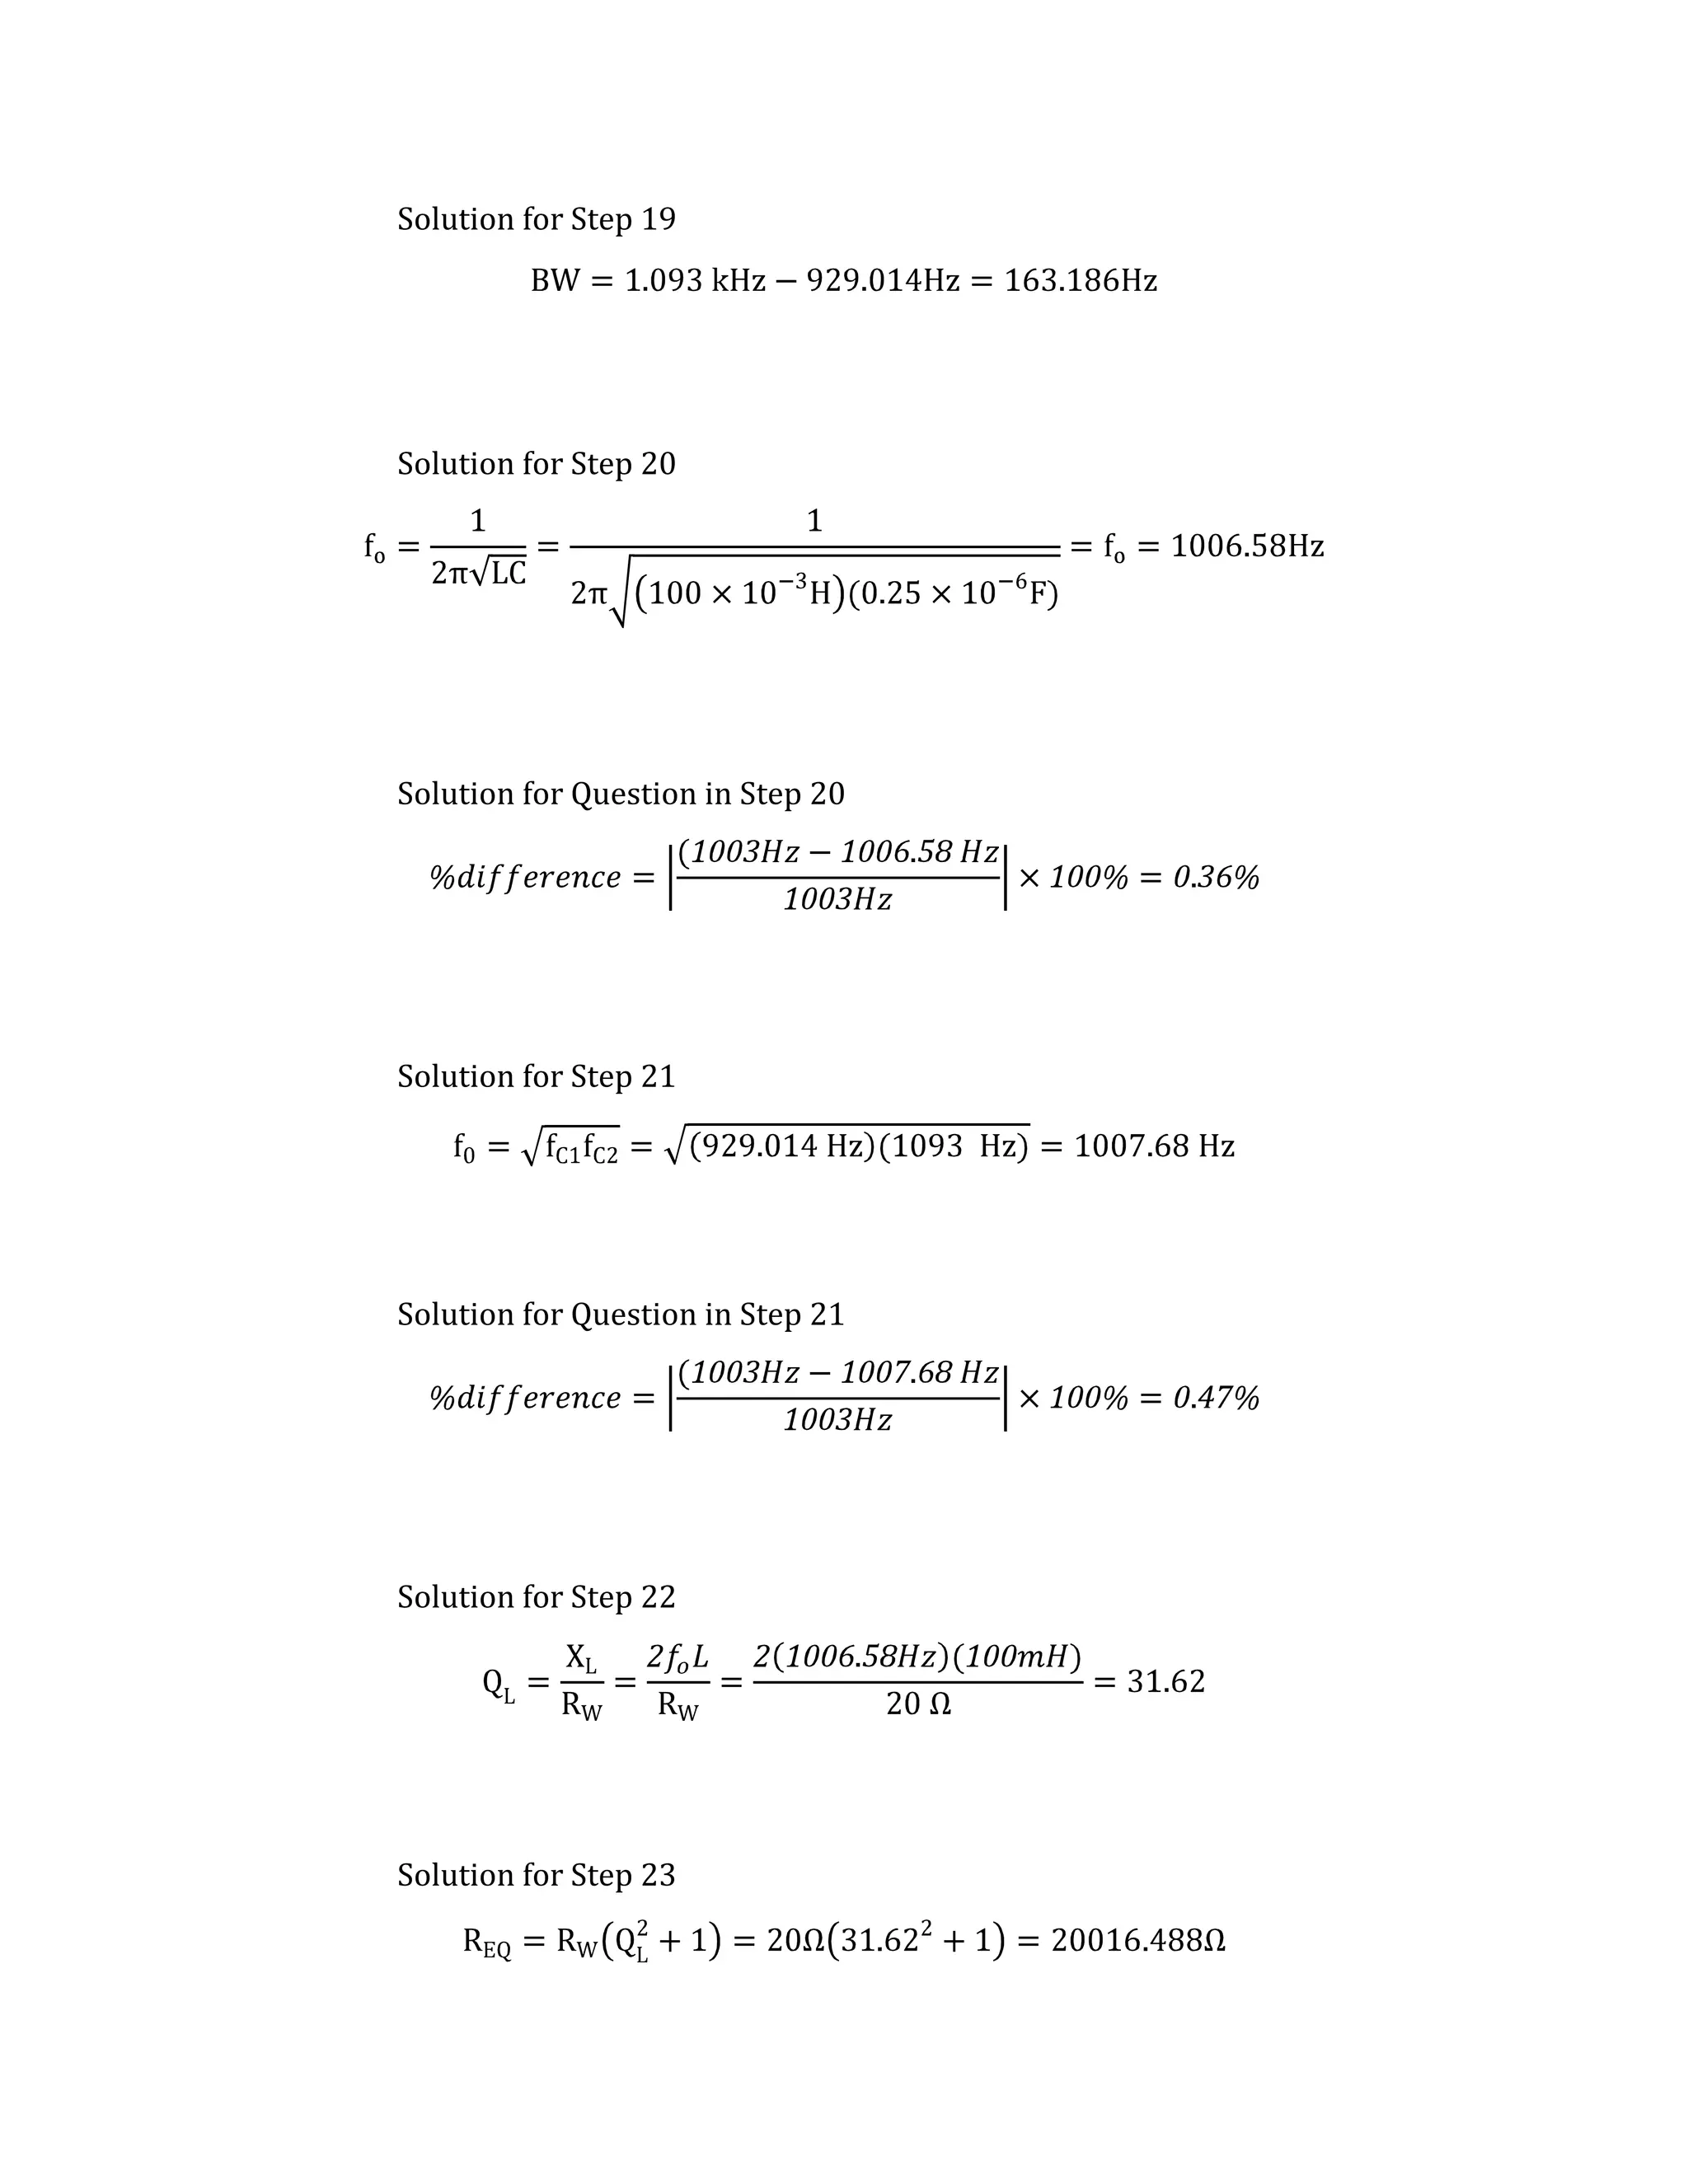
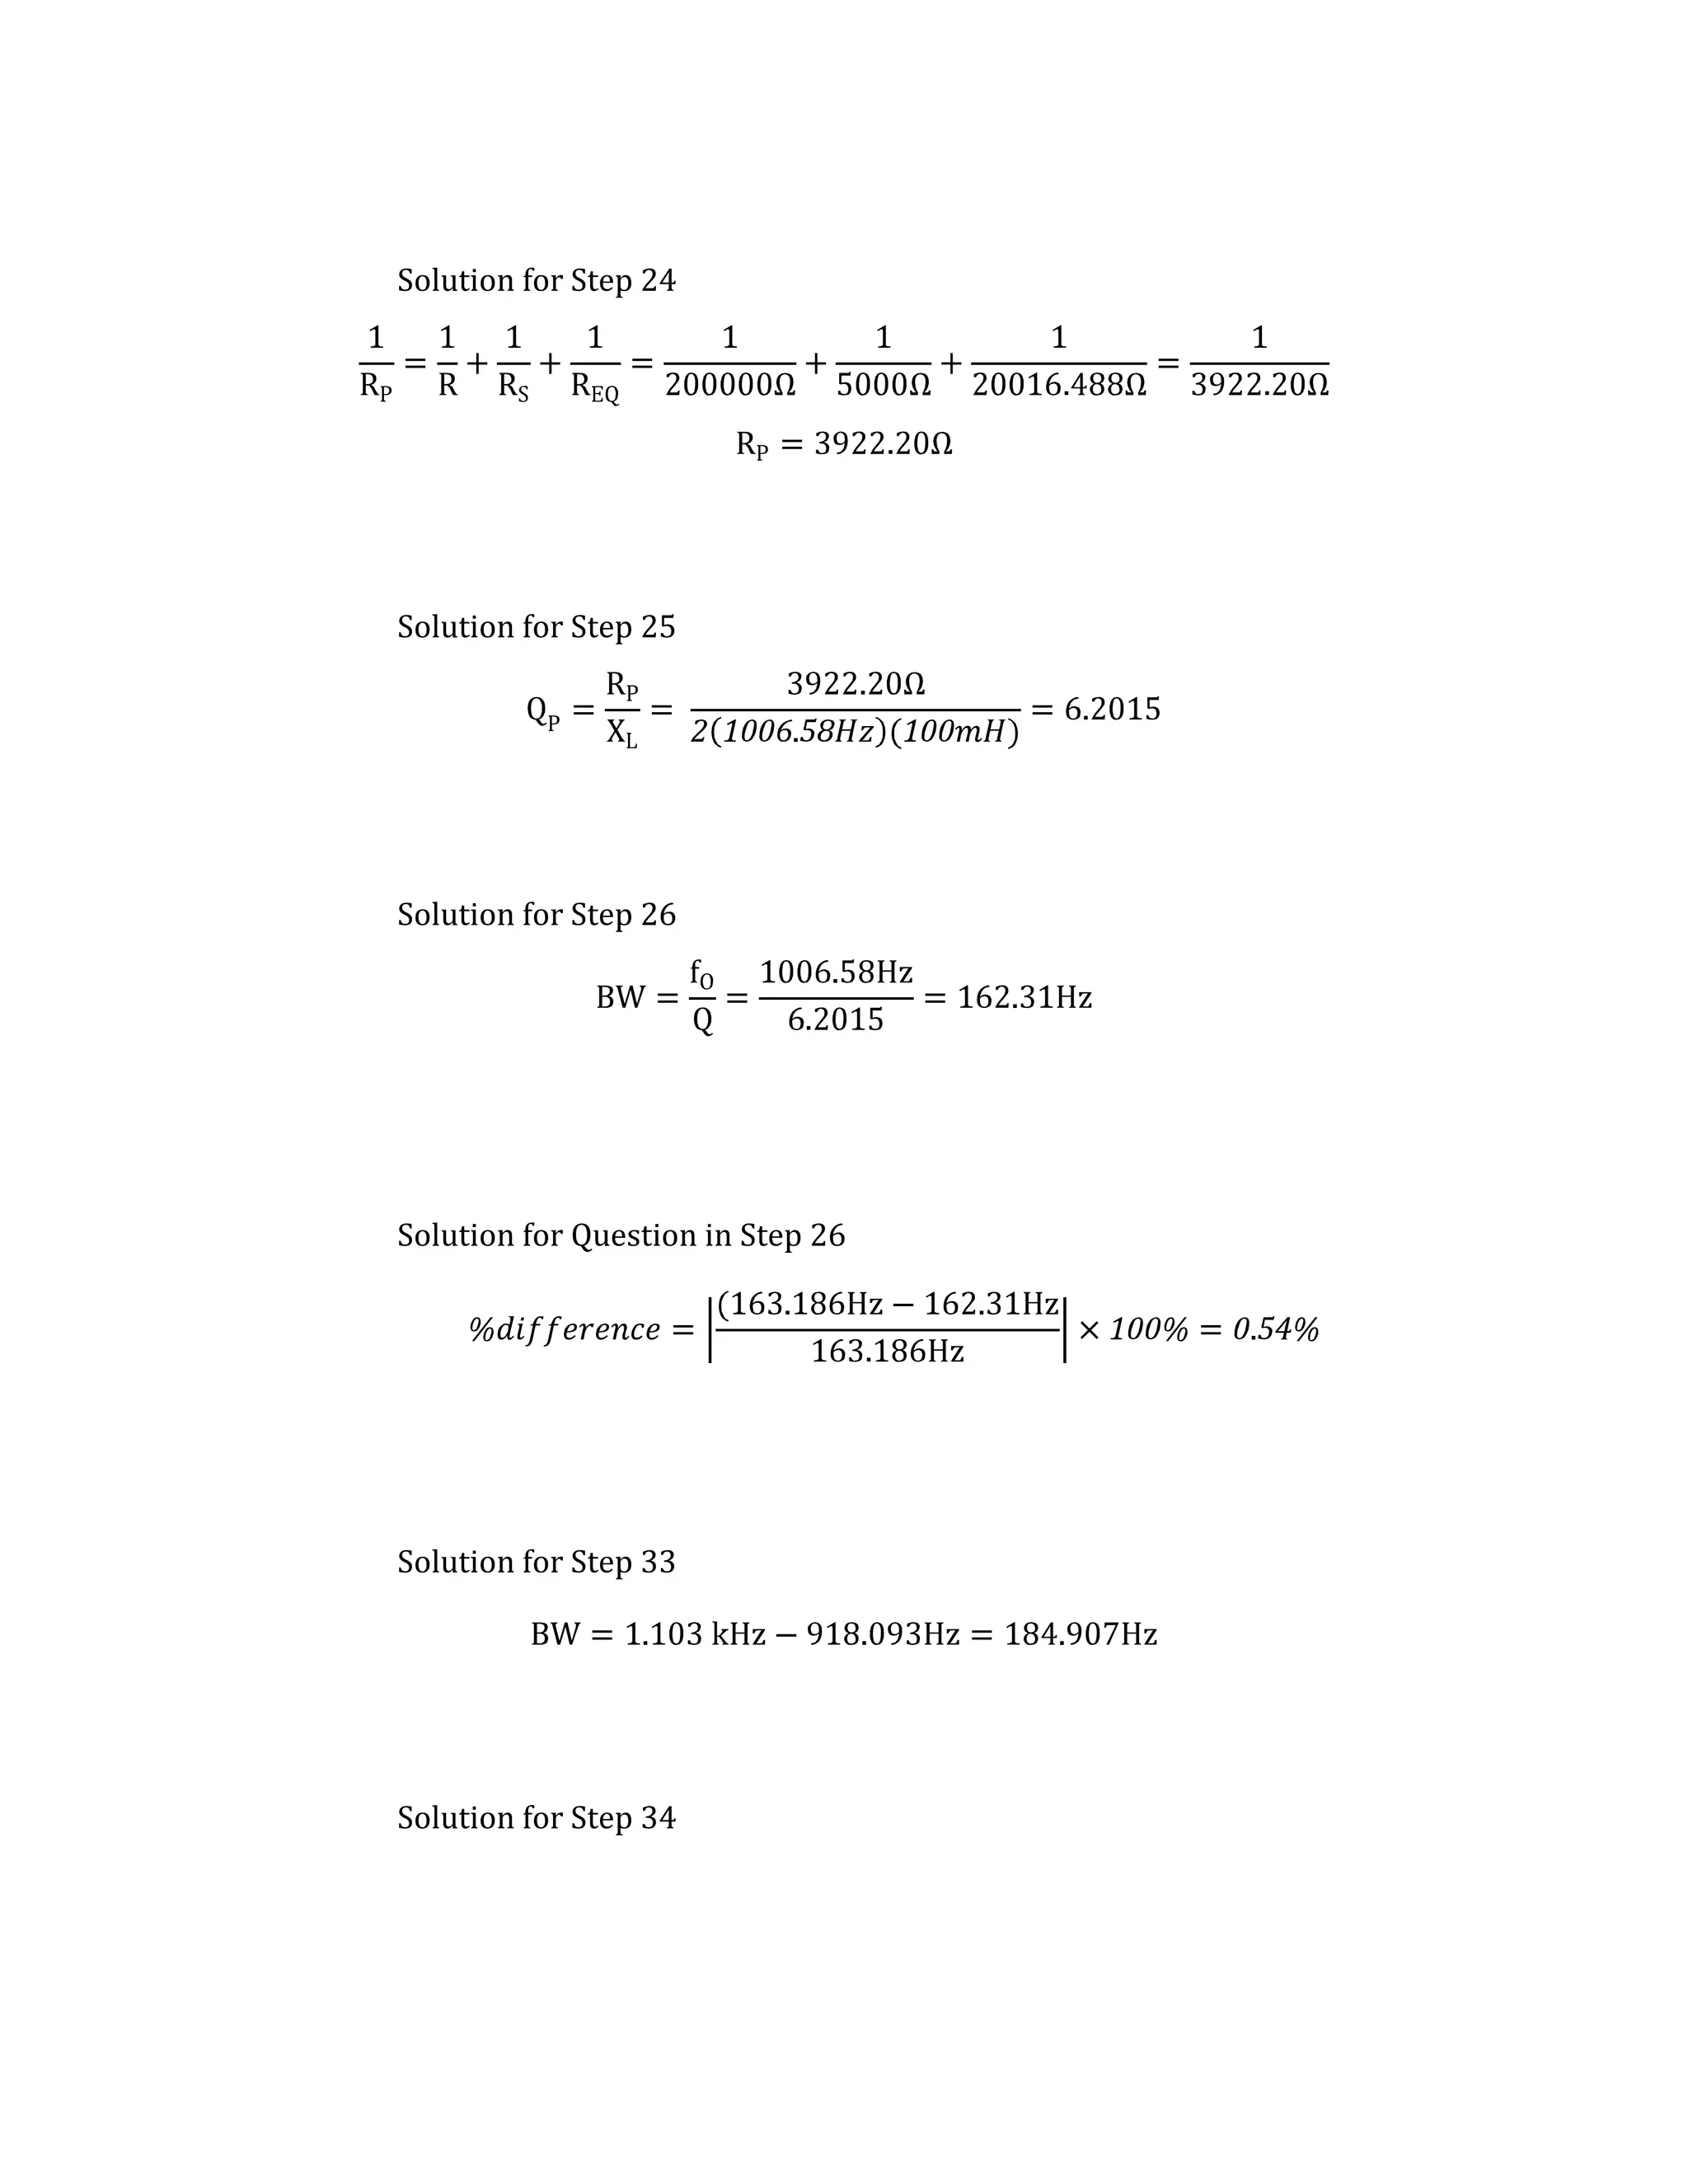
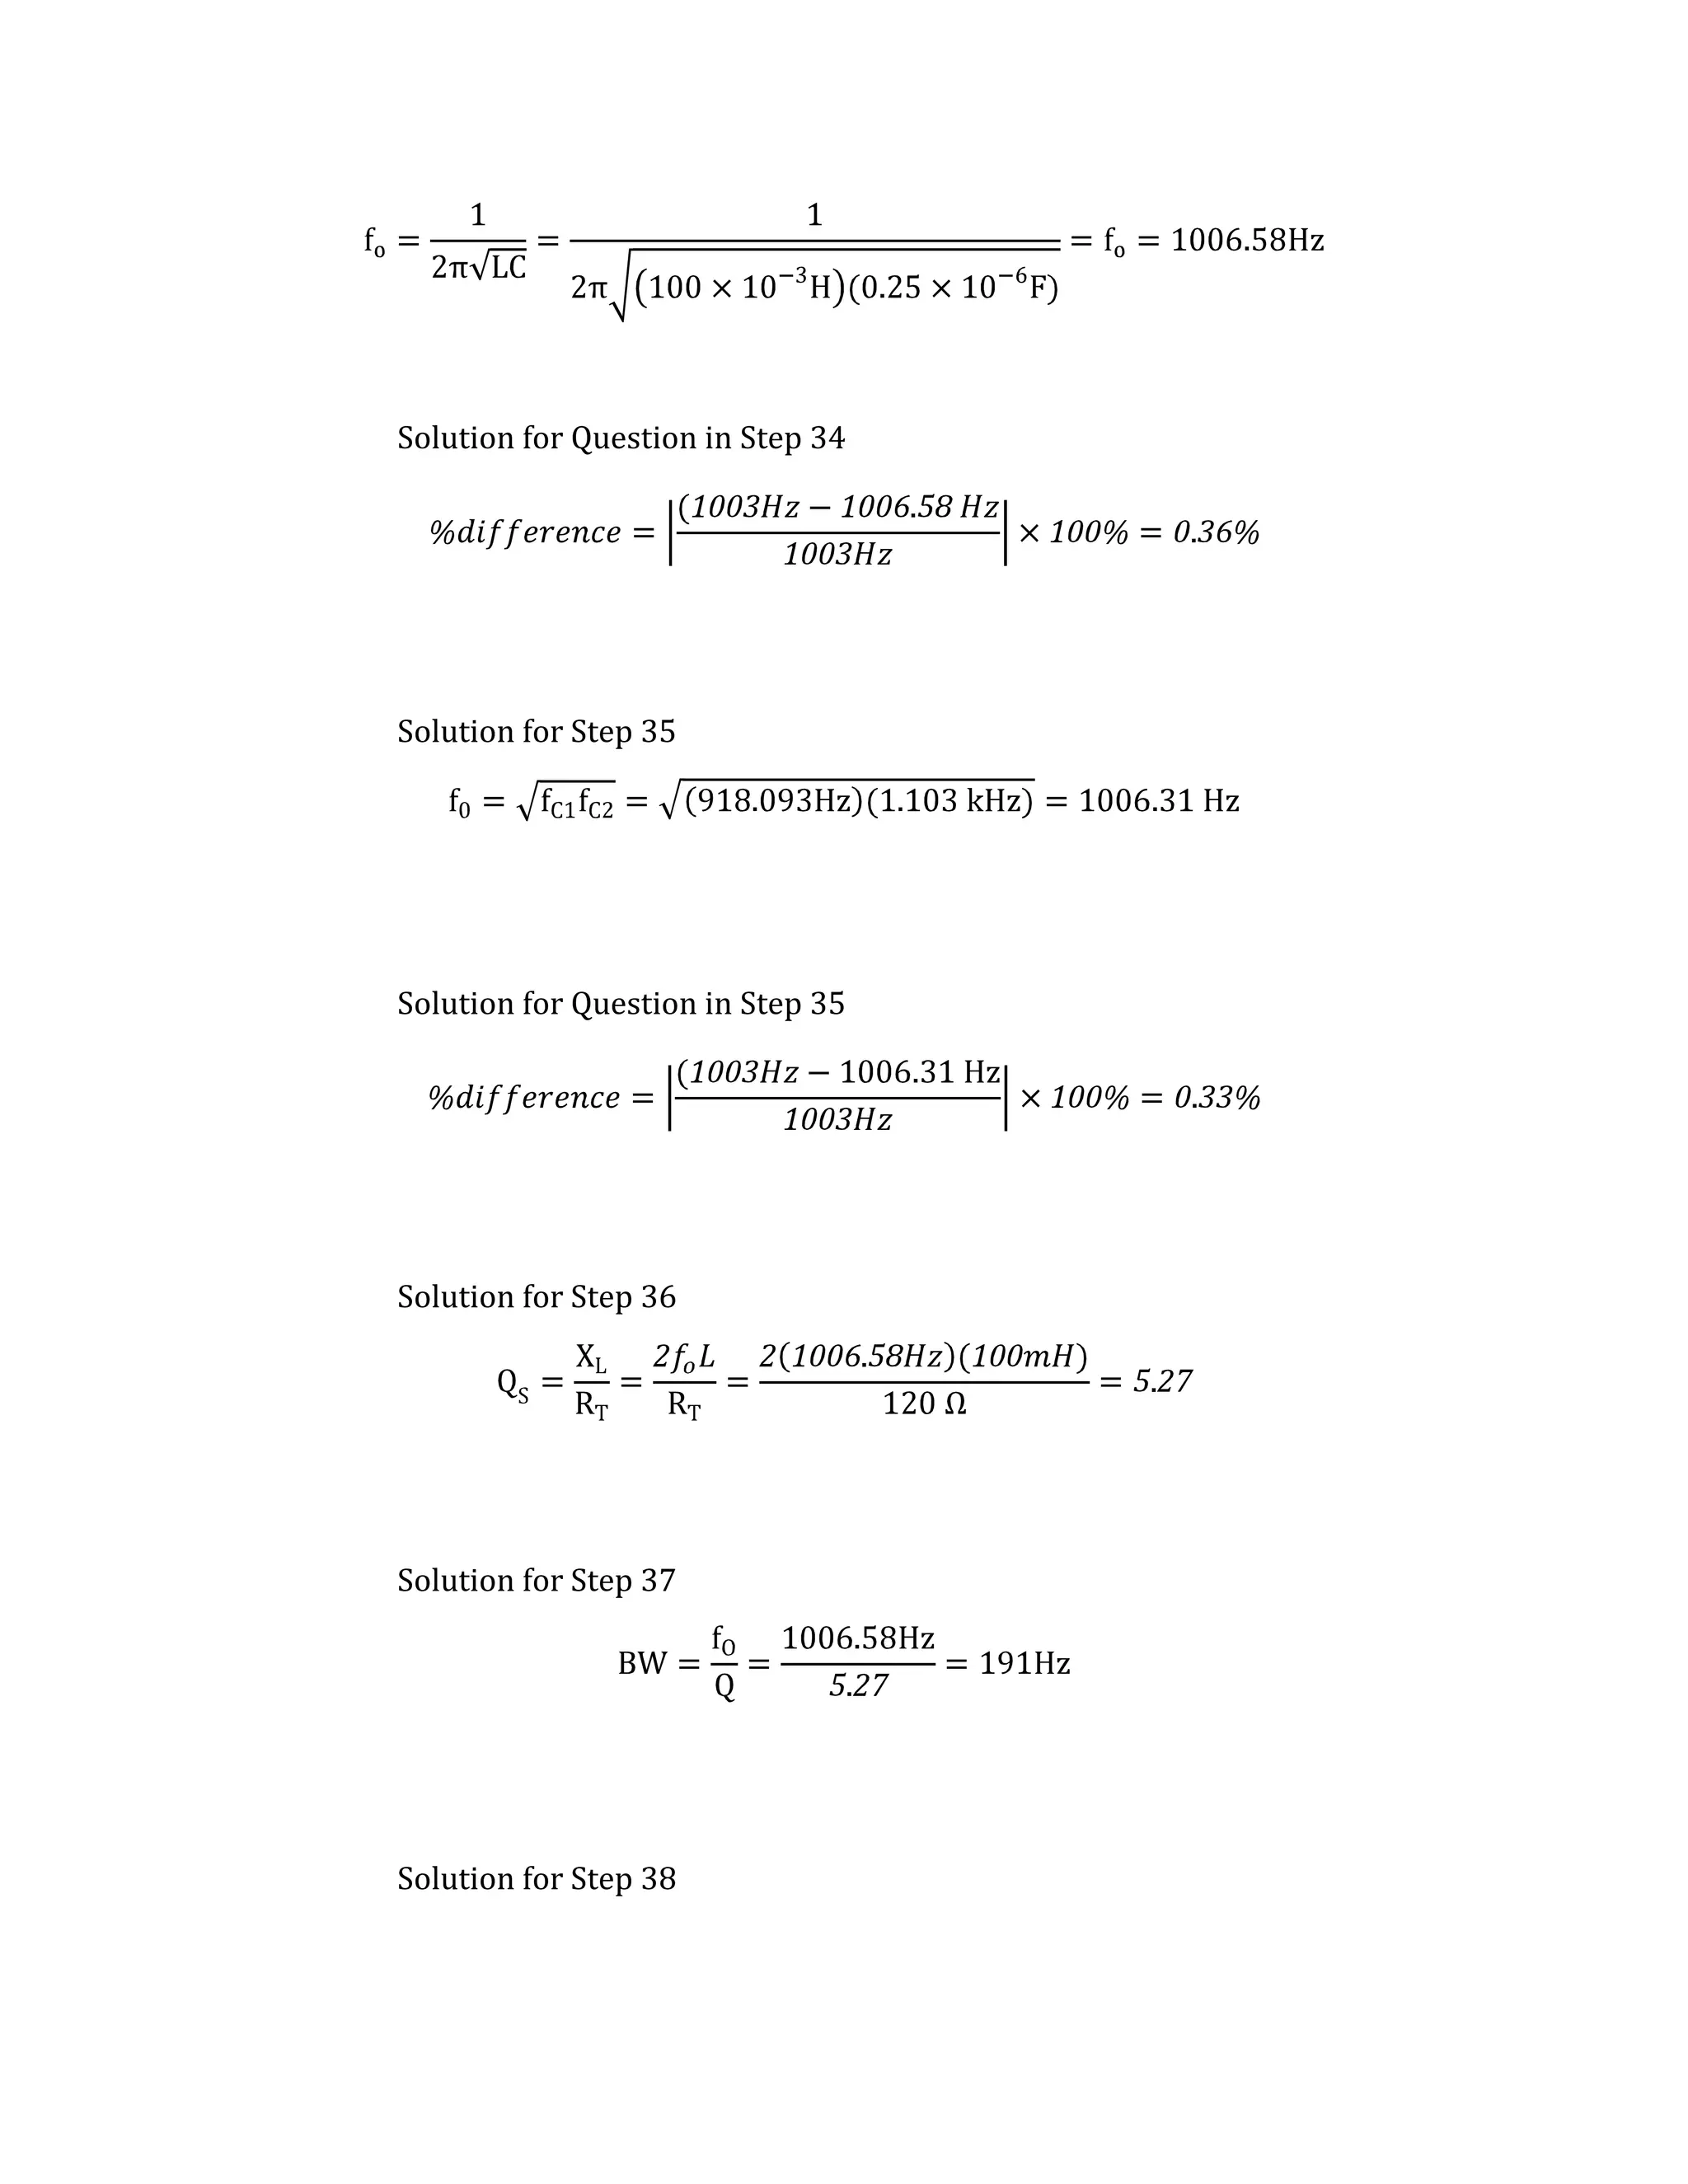
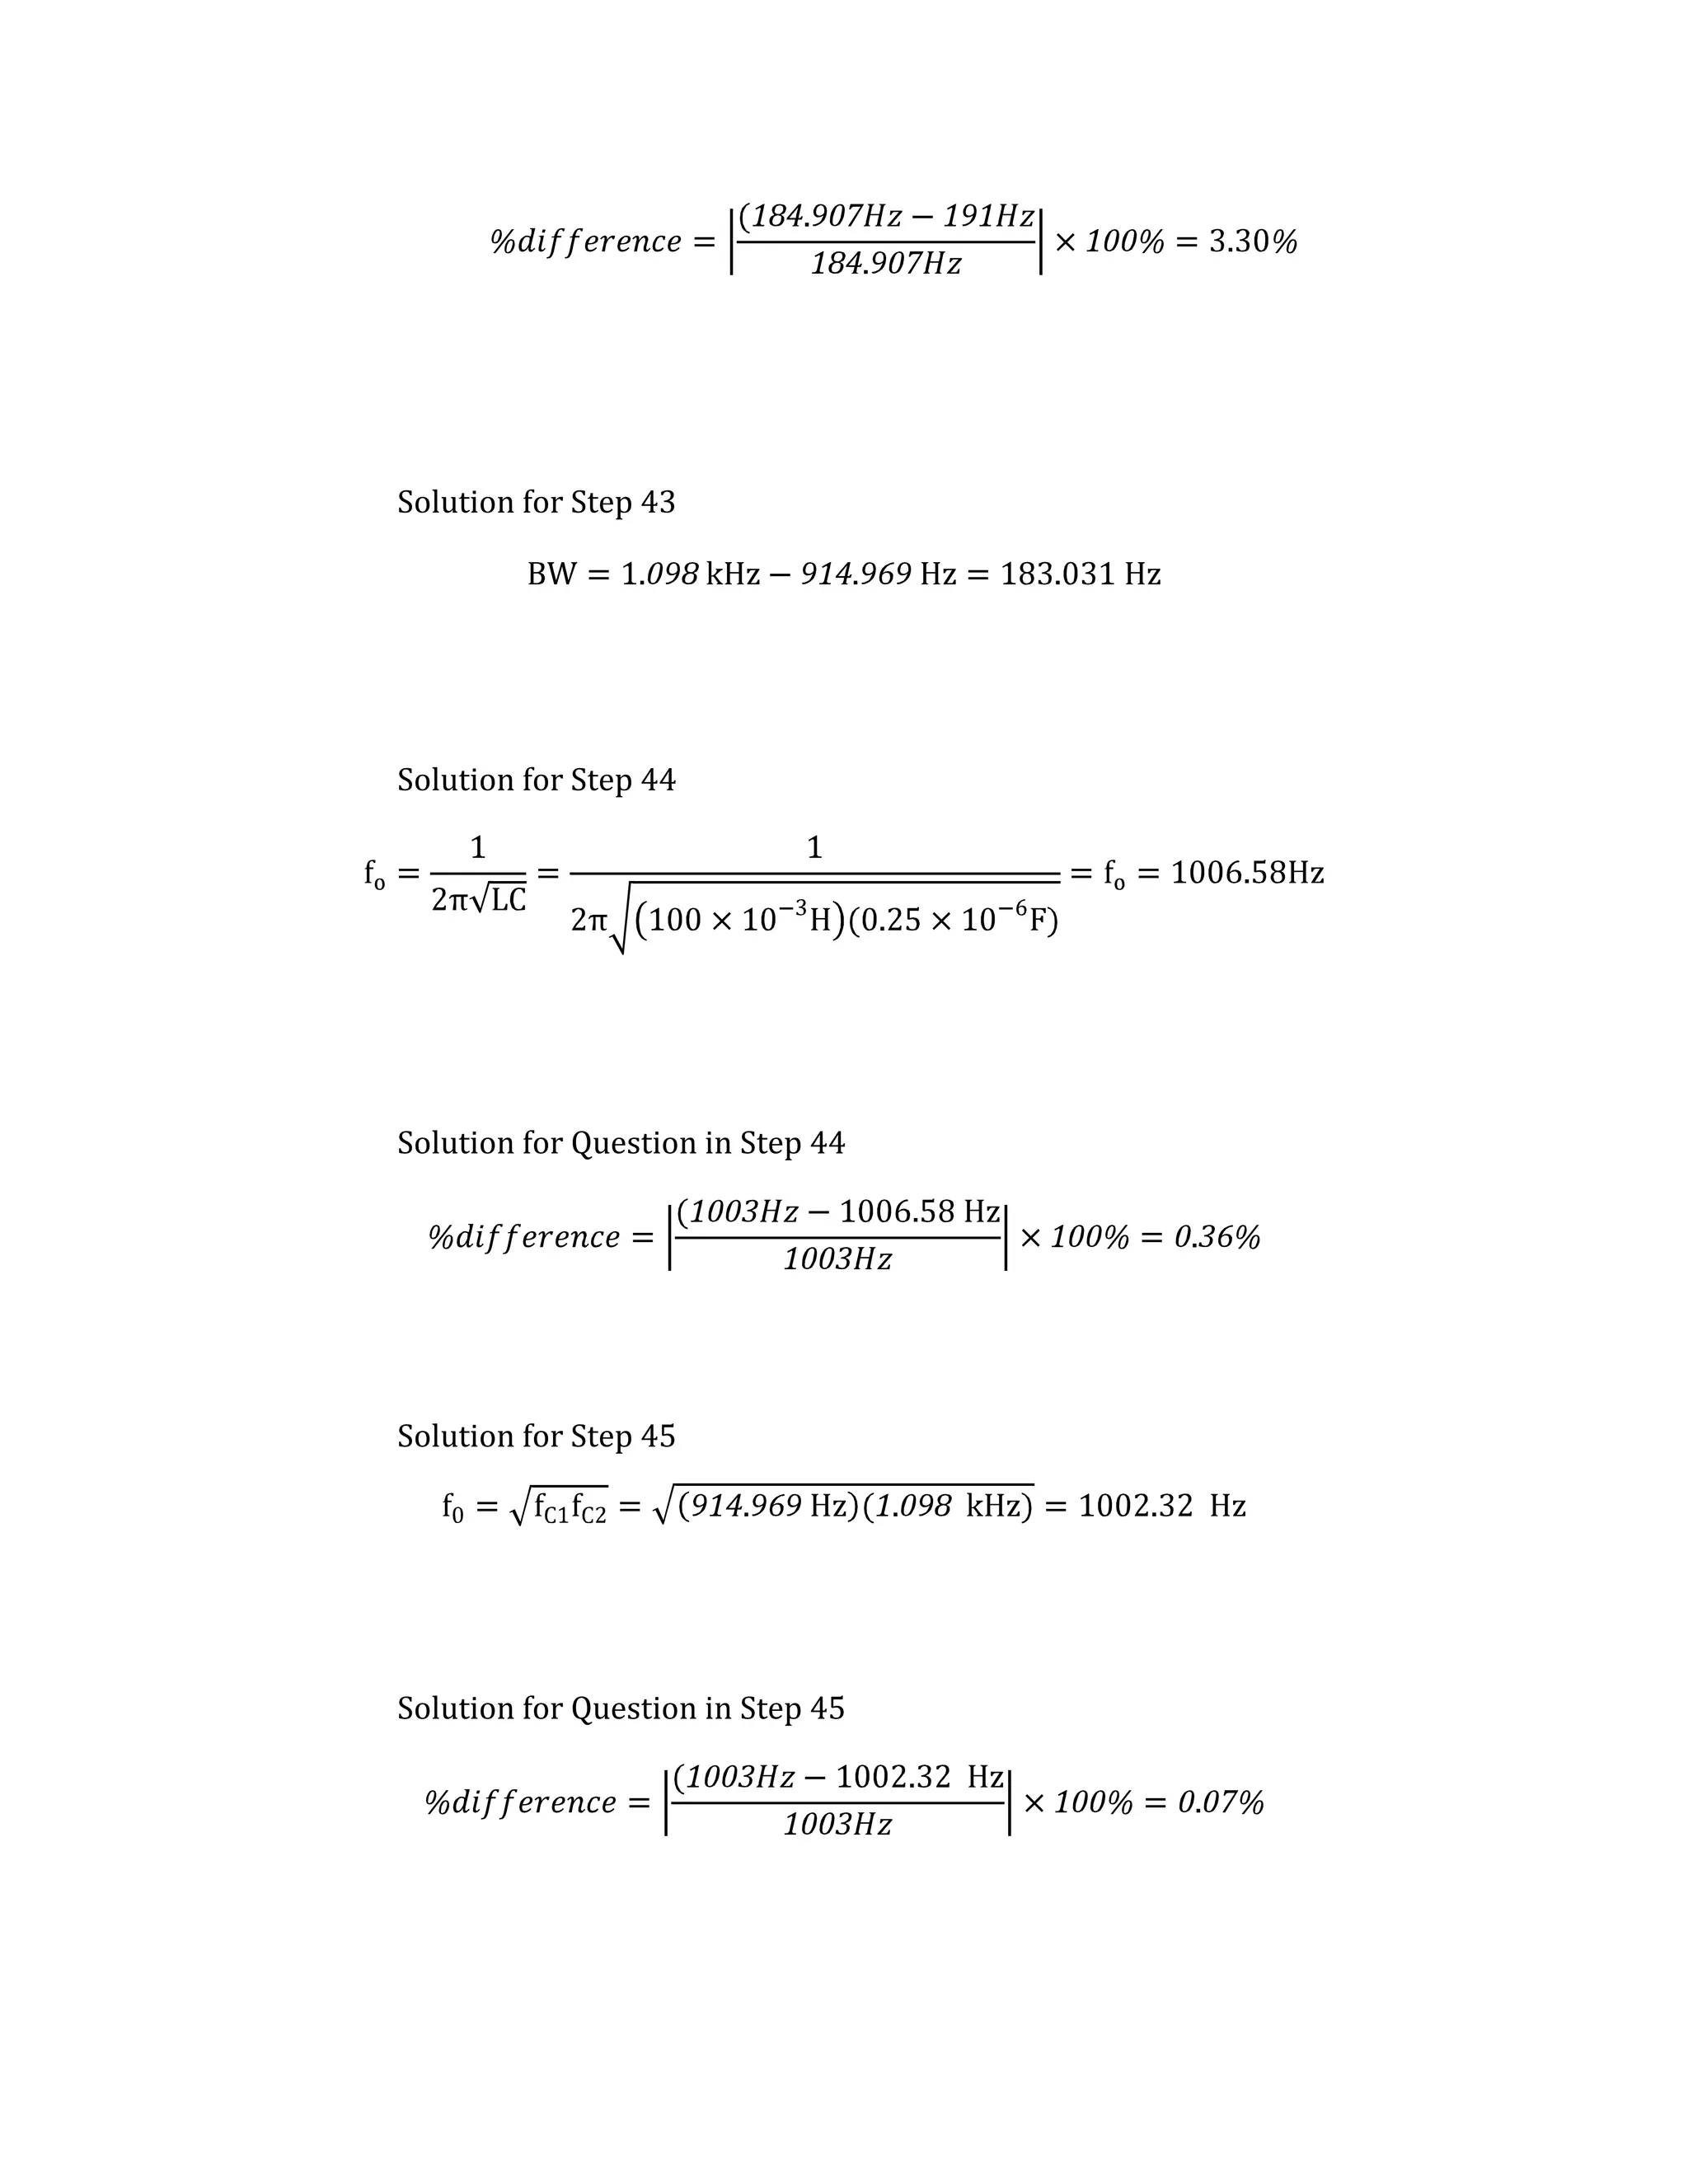
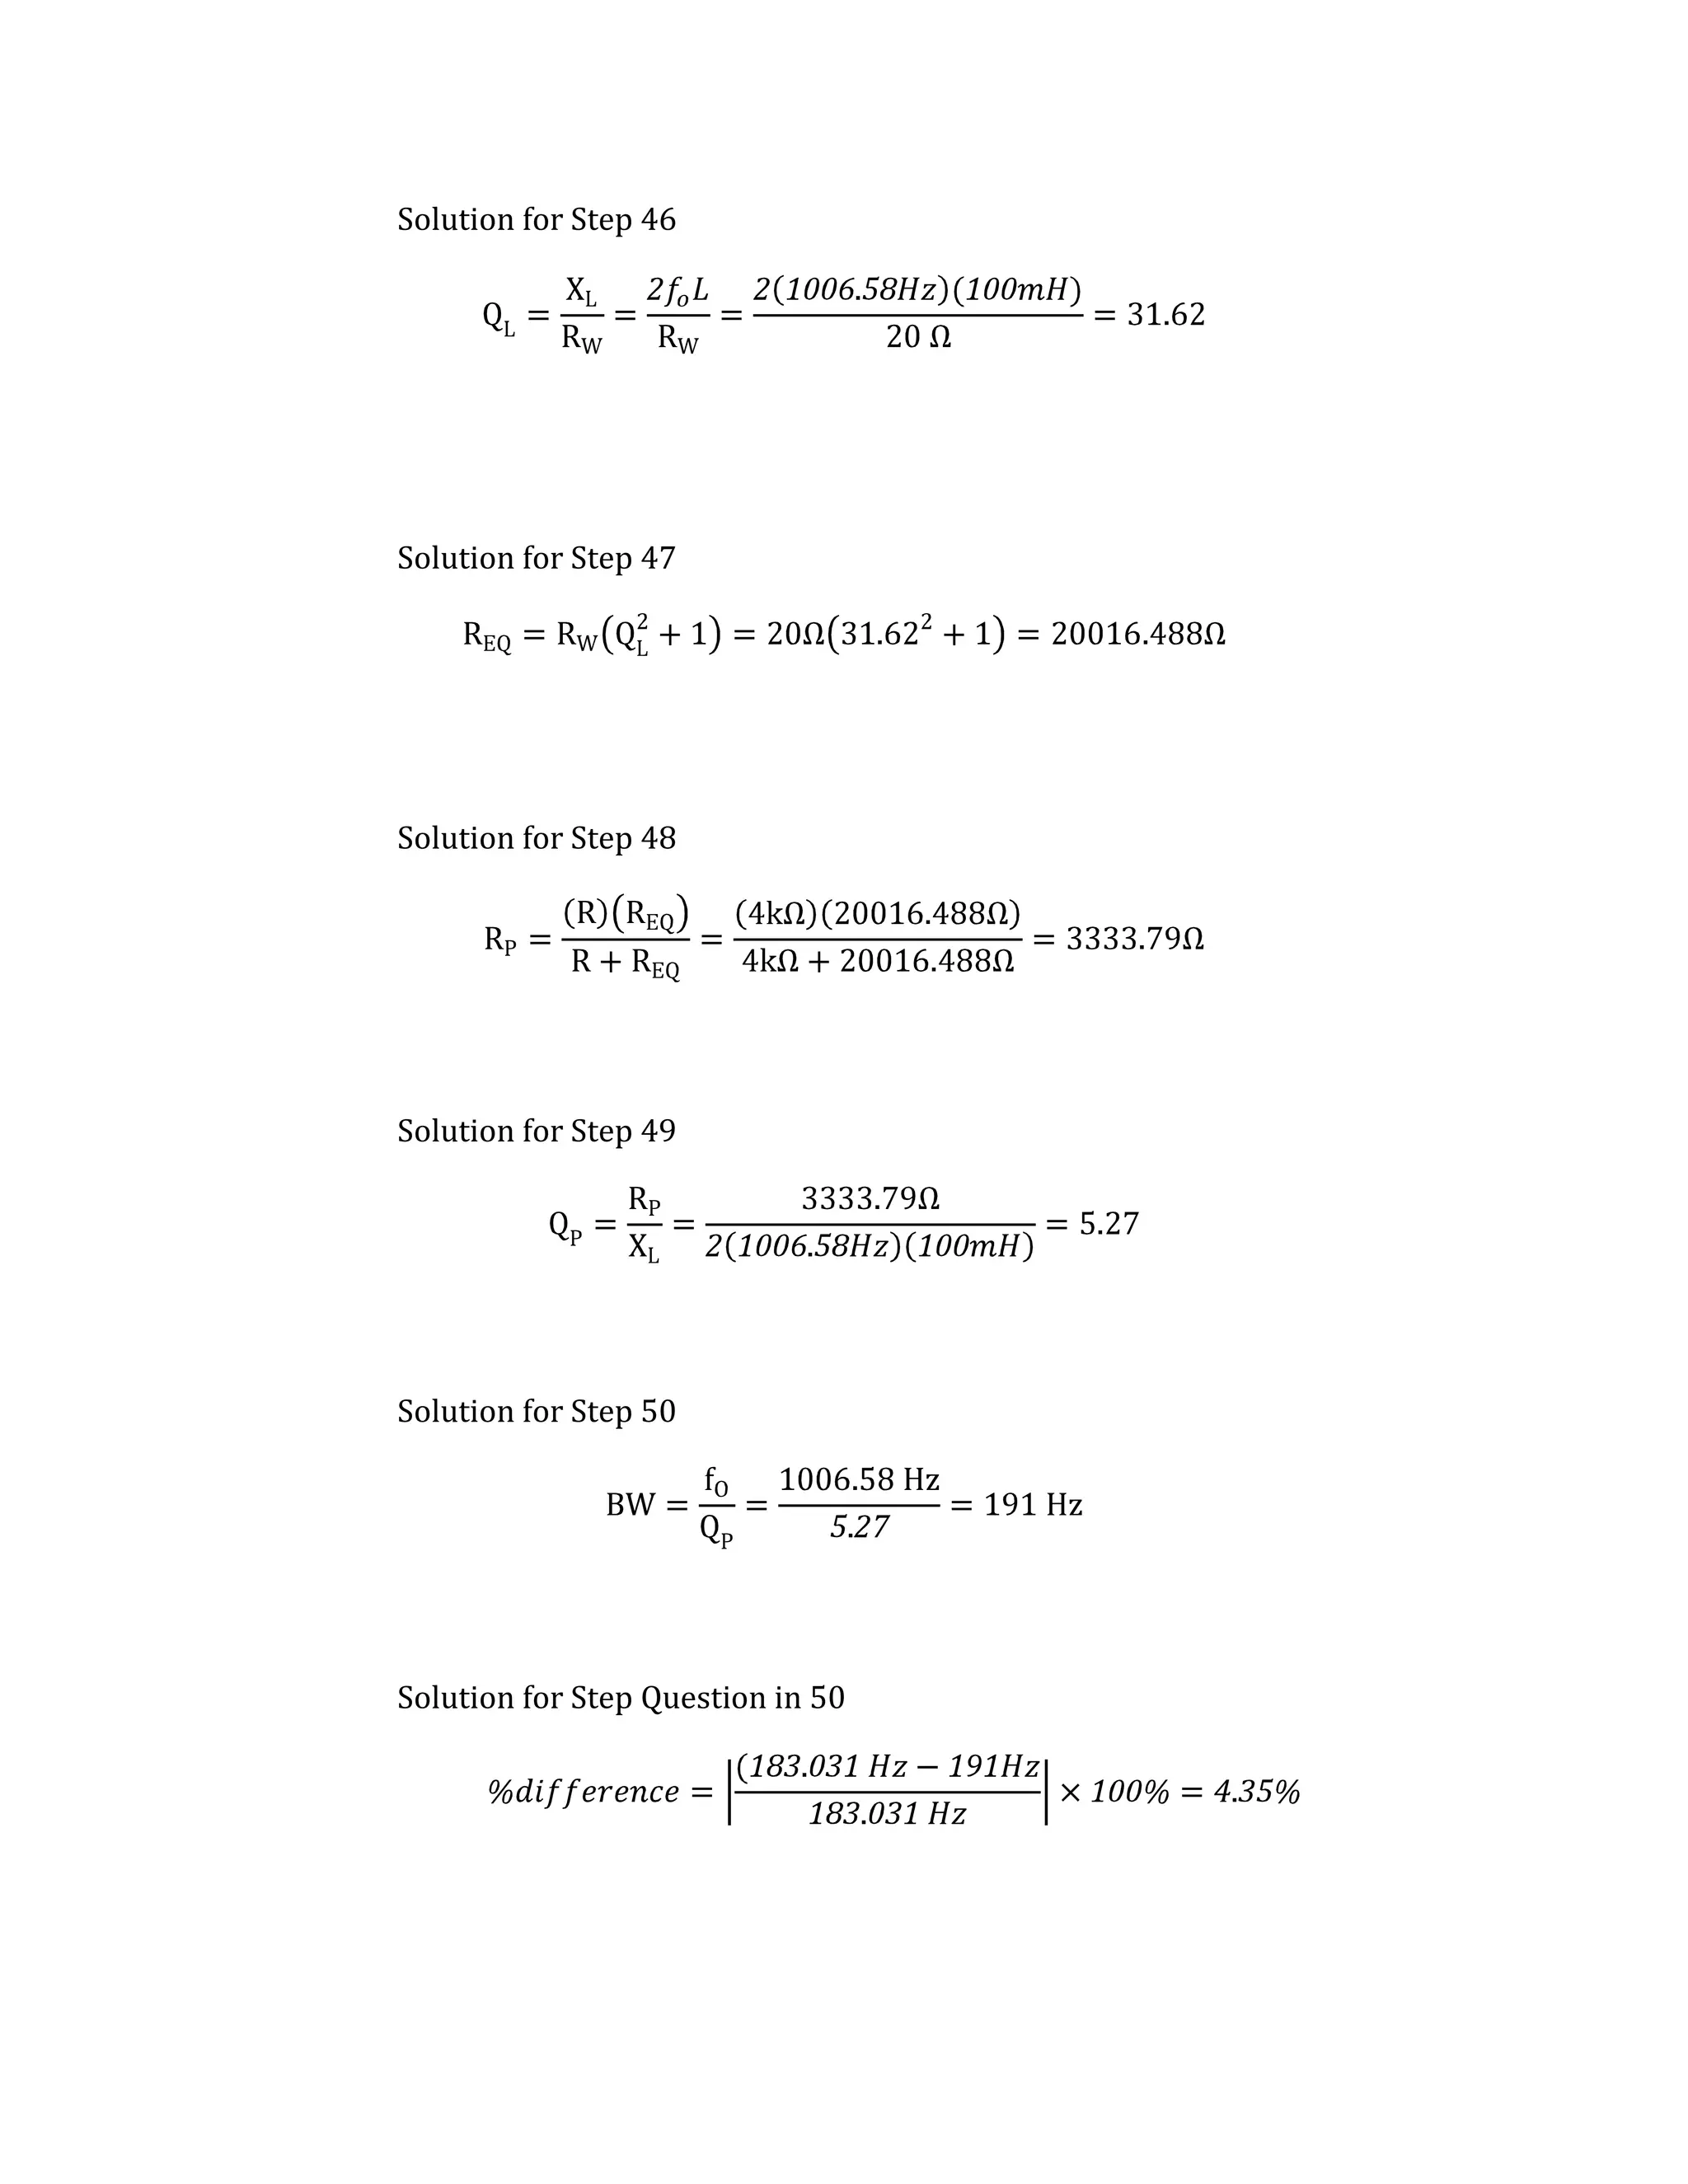
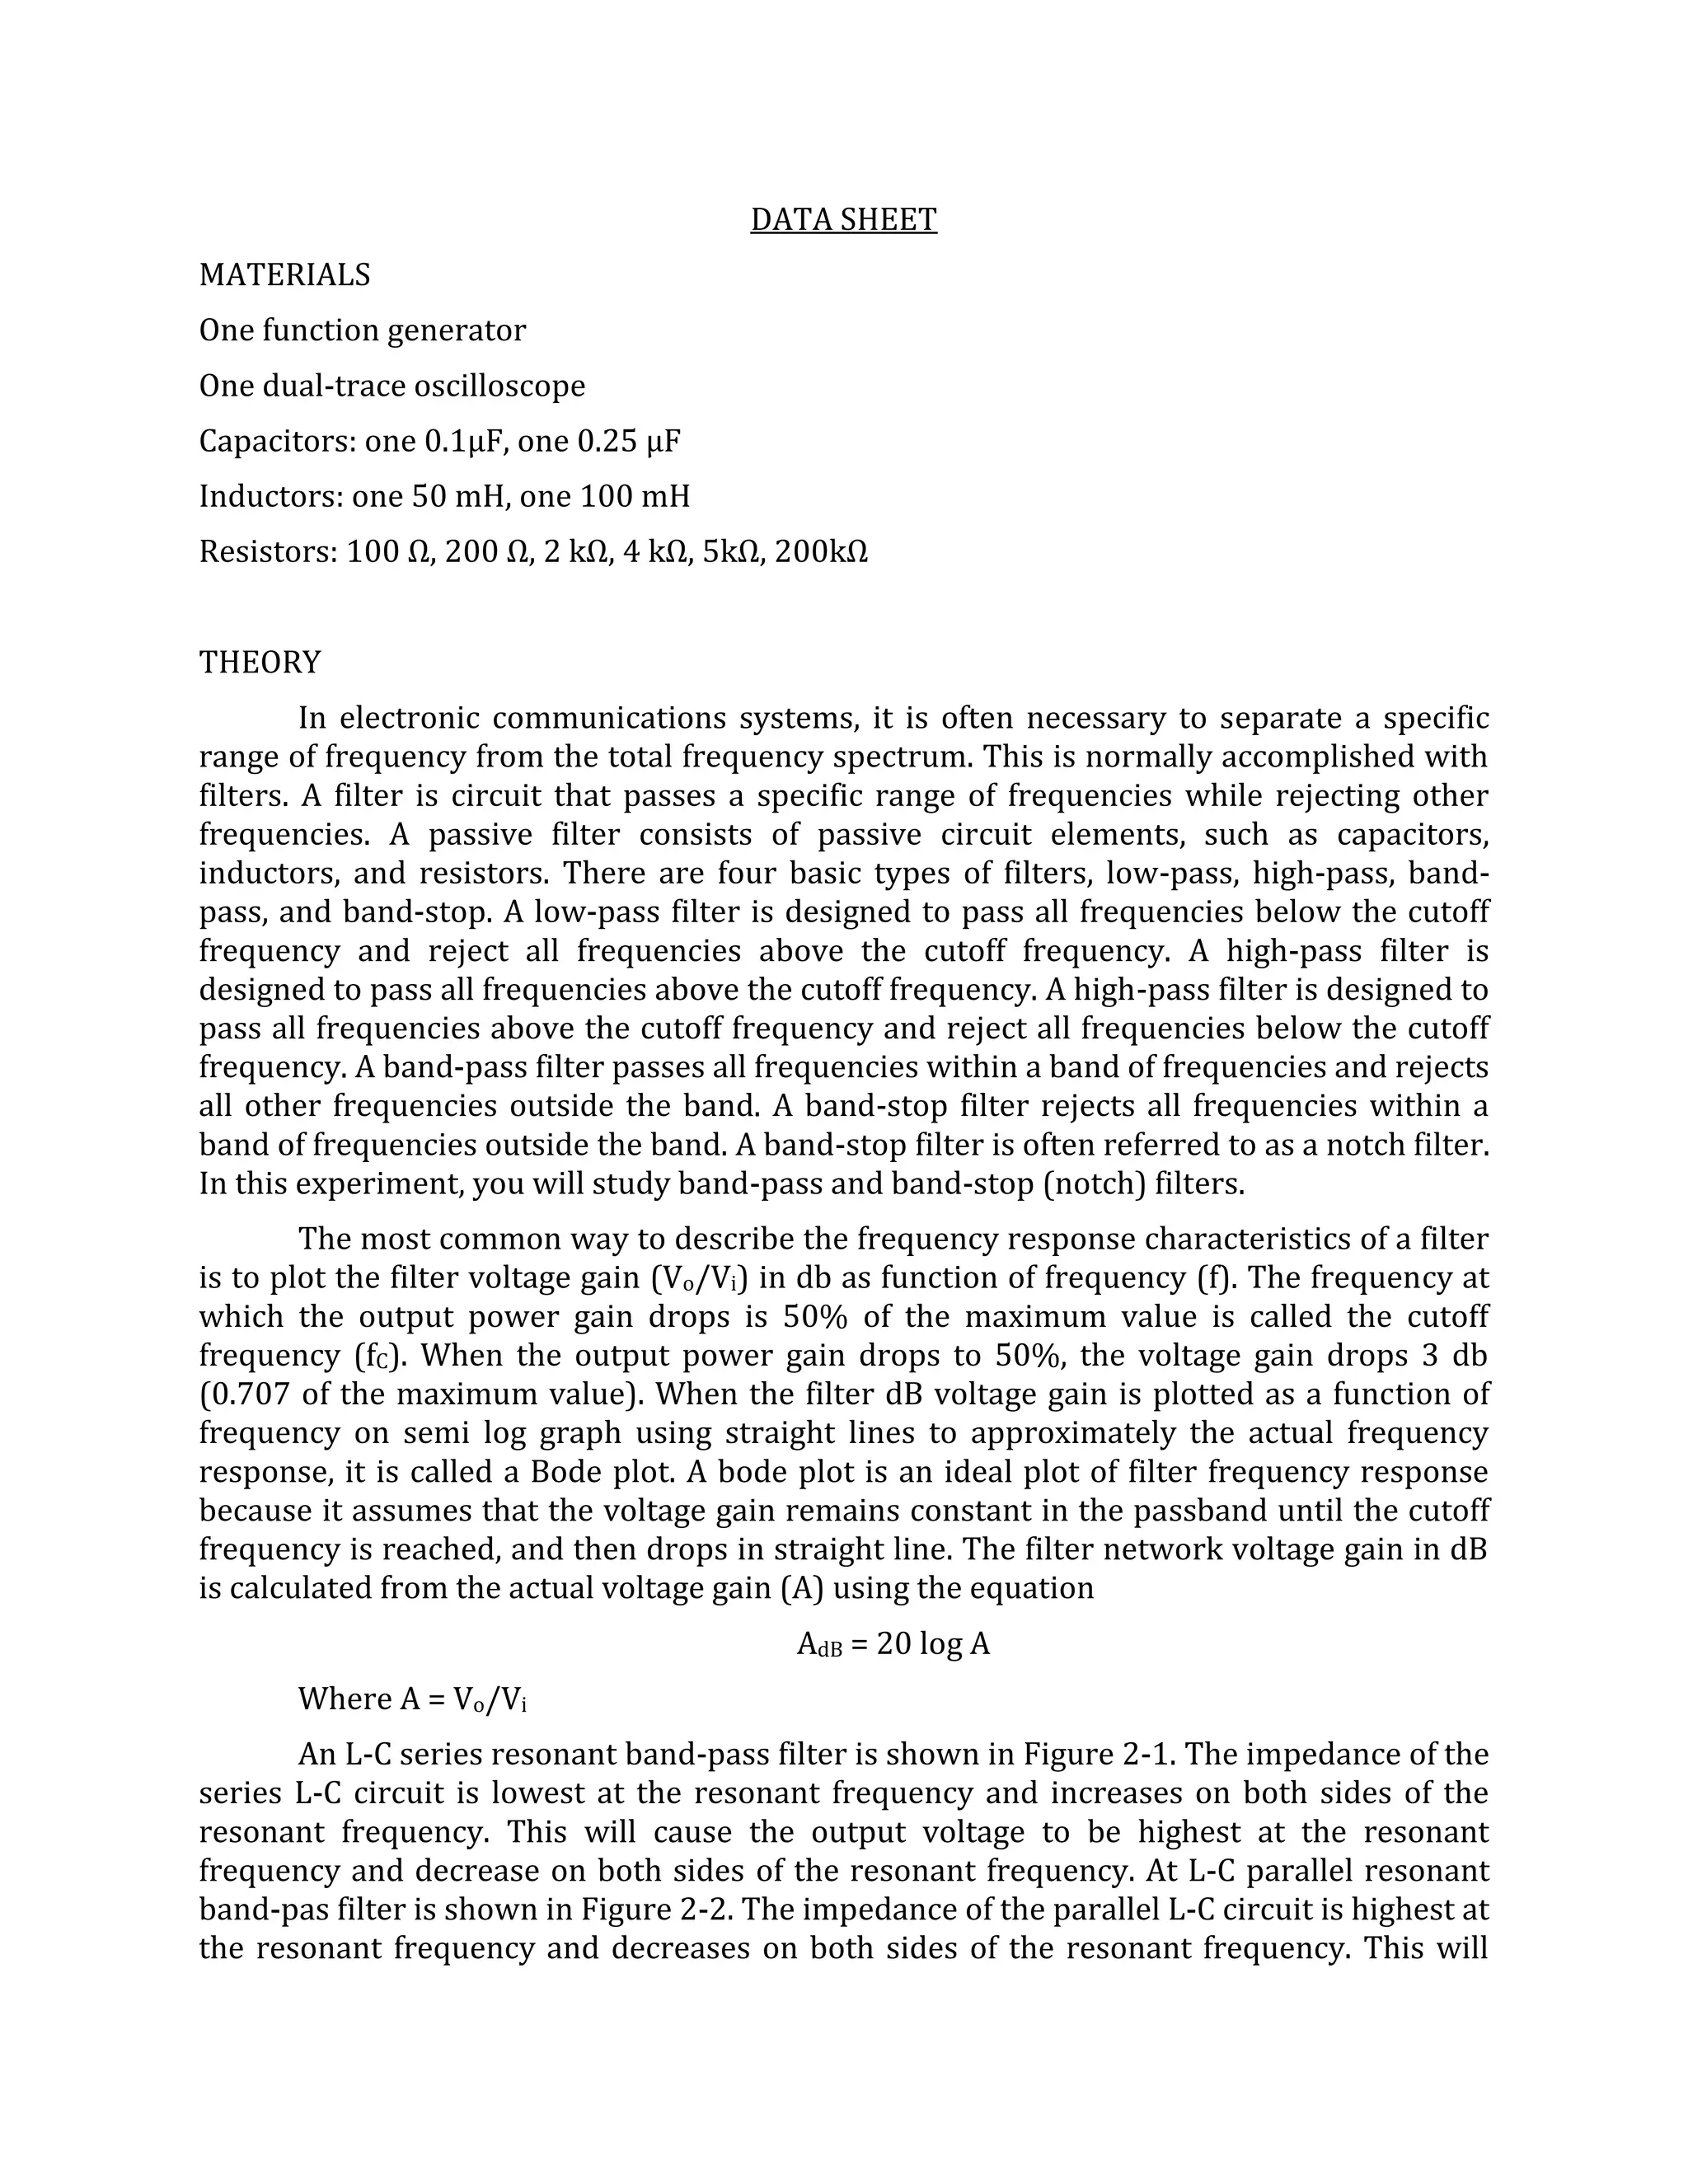

This document appears to be an experiment report for a college-level electronics course. It includes: 1. Objectives to plot gain-frequency responses of passive band-pass and band-stop filters, determine their center frequencies and bandwidths, and how circuit resistance affects bandwidth. 2. Sample computations showing solutions to steps in the experiment involving passive filter circuit analysis. 3. A data sheet listing materials used and theoretical background on passive band-pass, band-stop, low-pass, and high-pass filters. It describes how to analyze L-C series and parallel resonant filters. 4. A procedure outlining steps to simulate band-pass and band-stop filters and analyze their responses


![RF Circuit Design - [Ch4-2] LNA, PA, and Broadband Amplifier](https://cdn.slidesharecdn.com/ss_thumbnails/ch4-2-150613064410-lva1-app6891-thumbnail.jpg?width=640&height=640&fit=bounds)