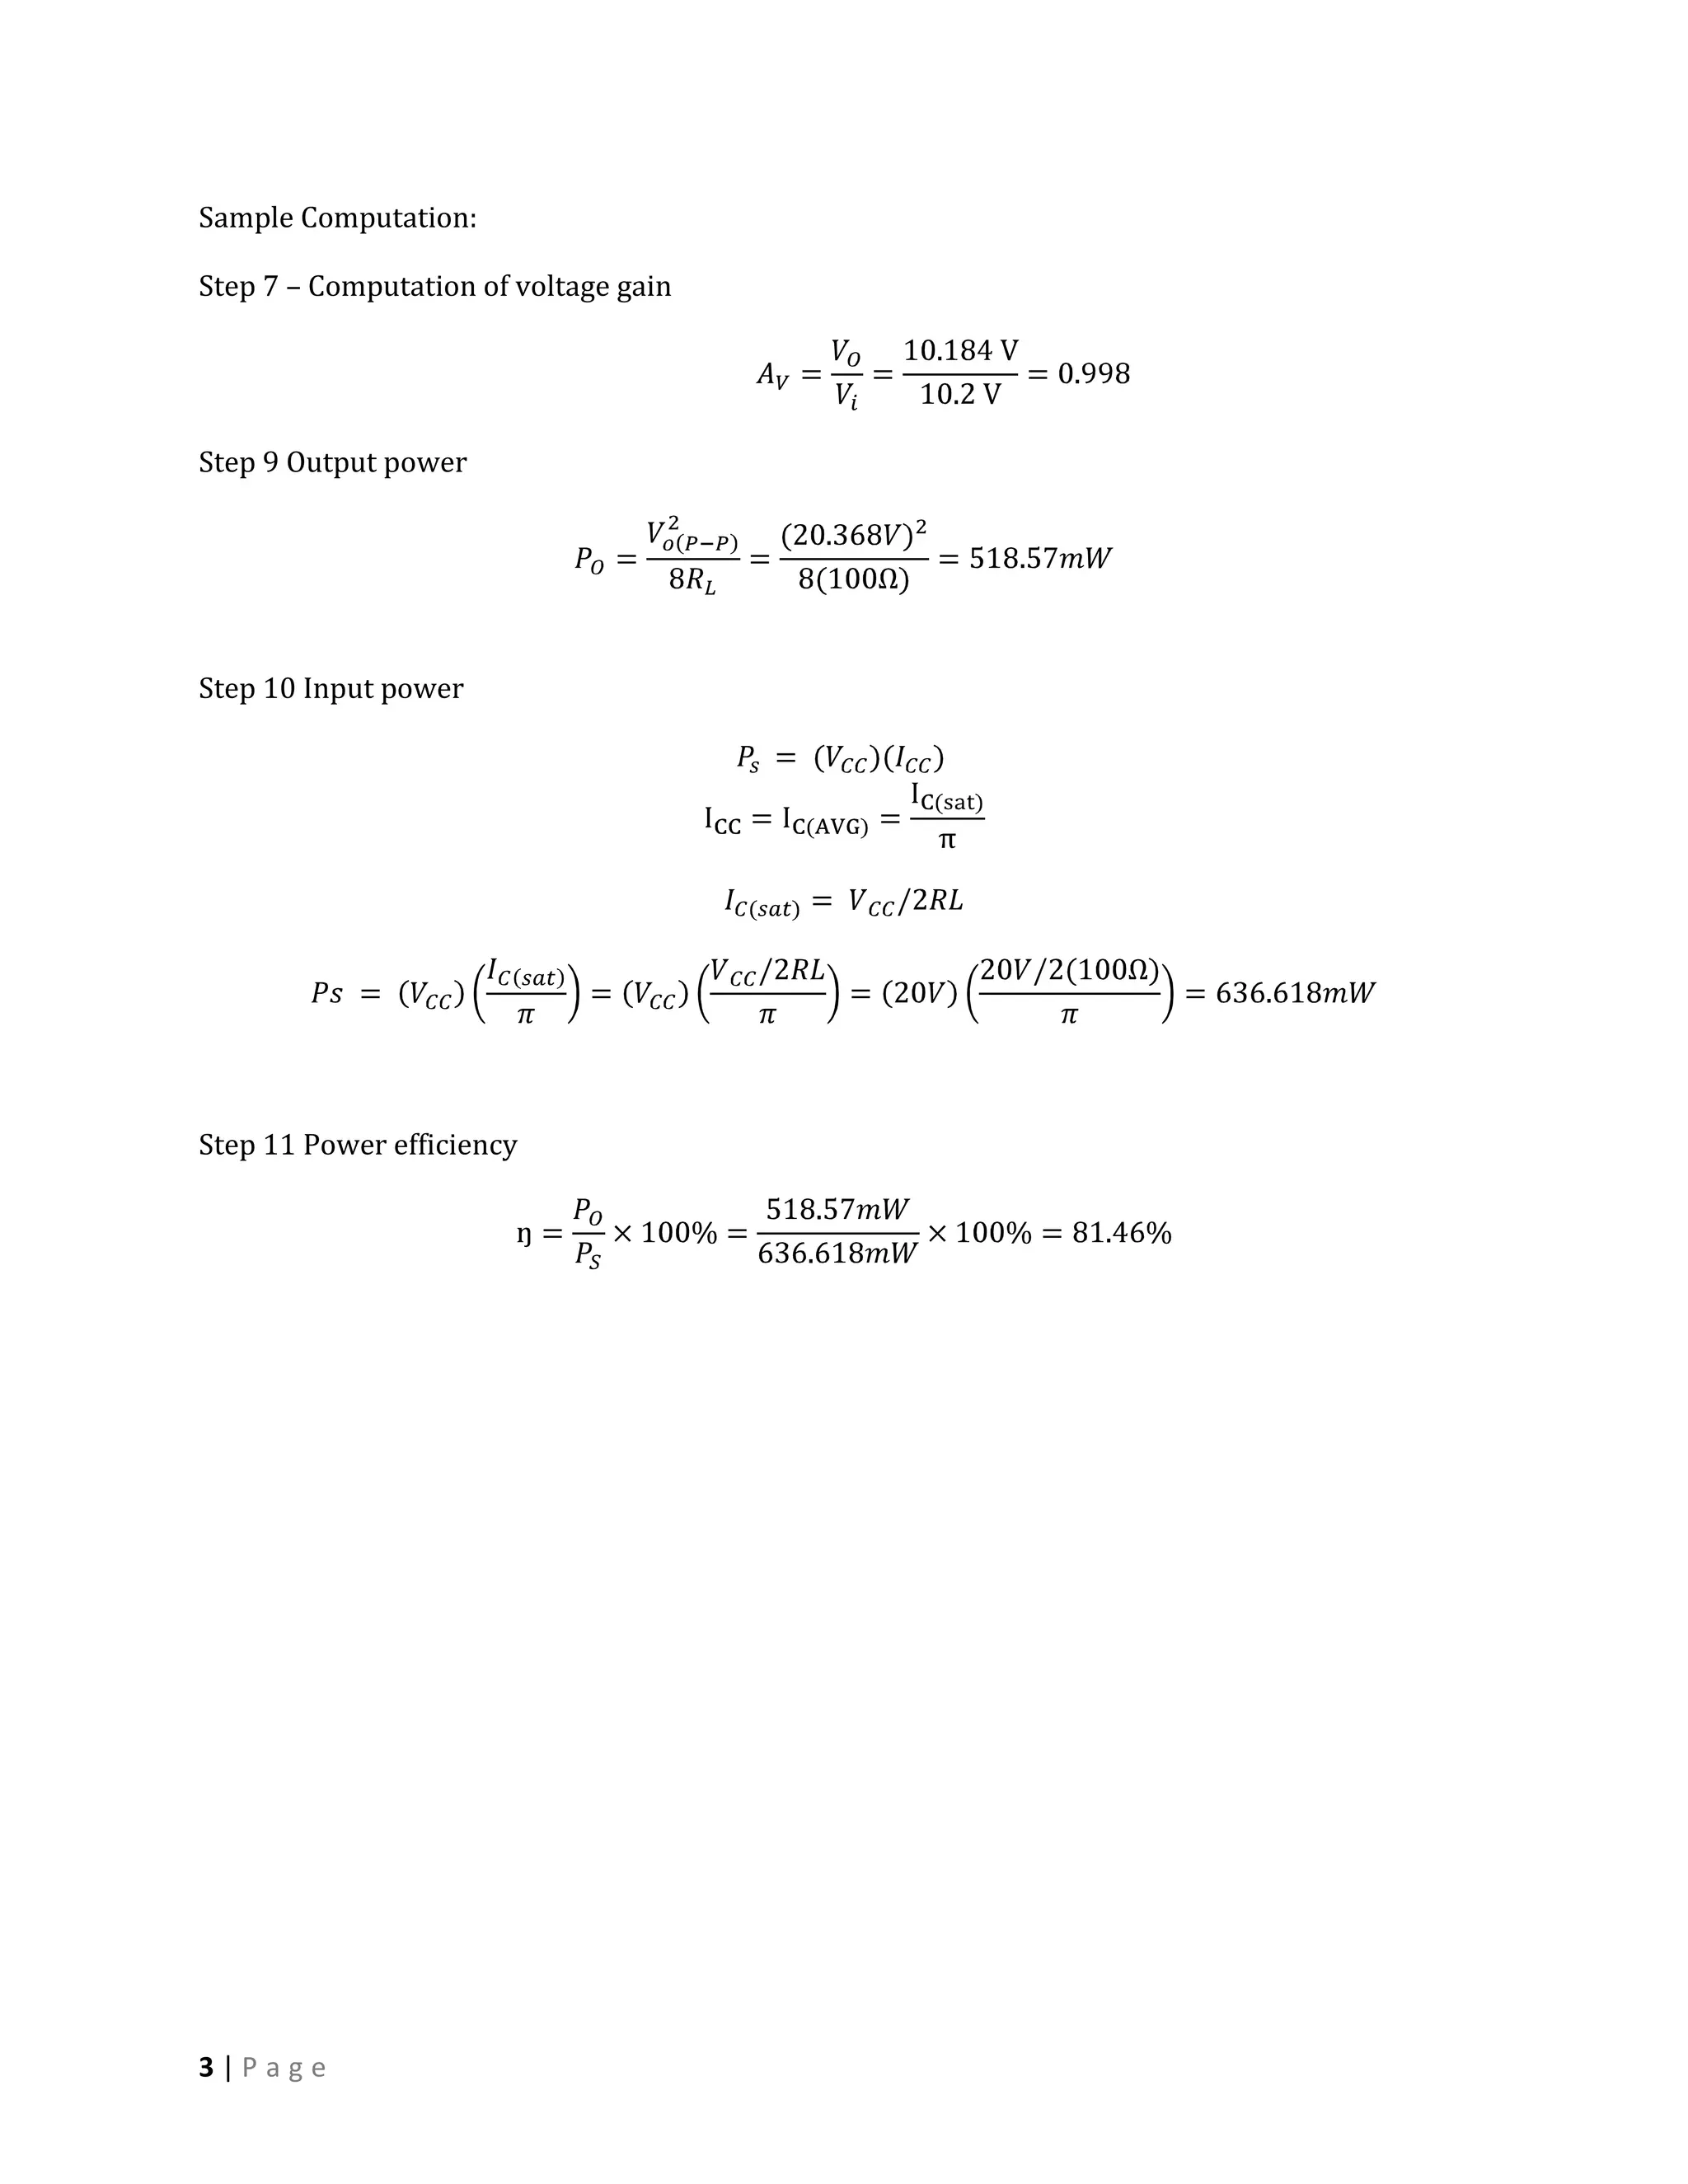
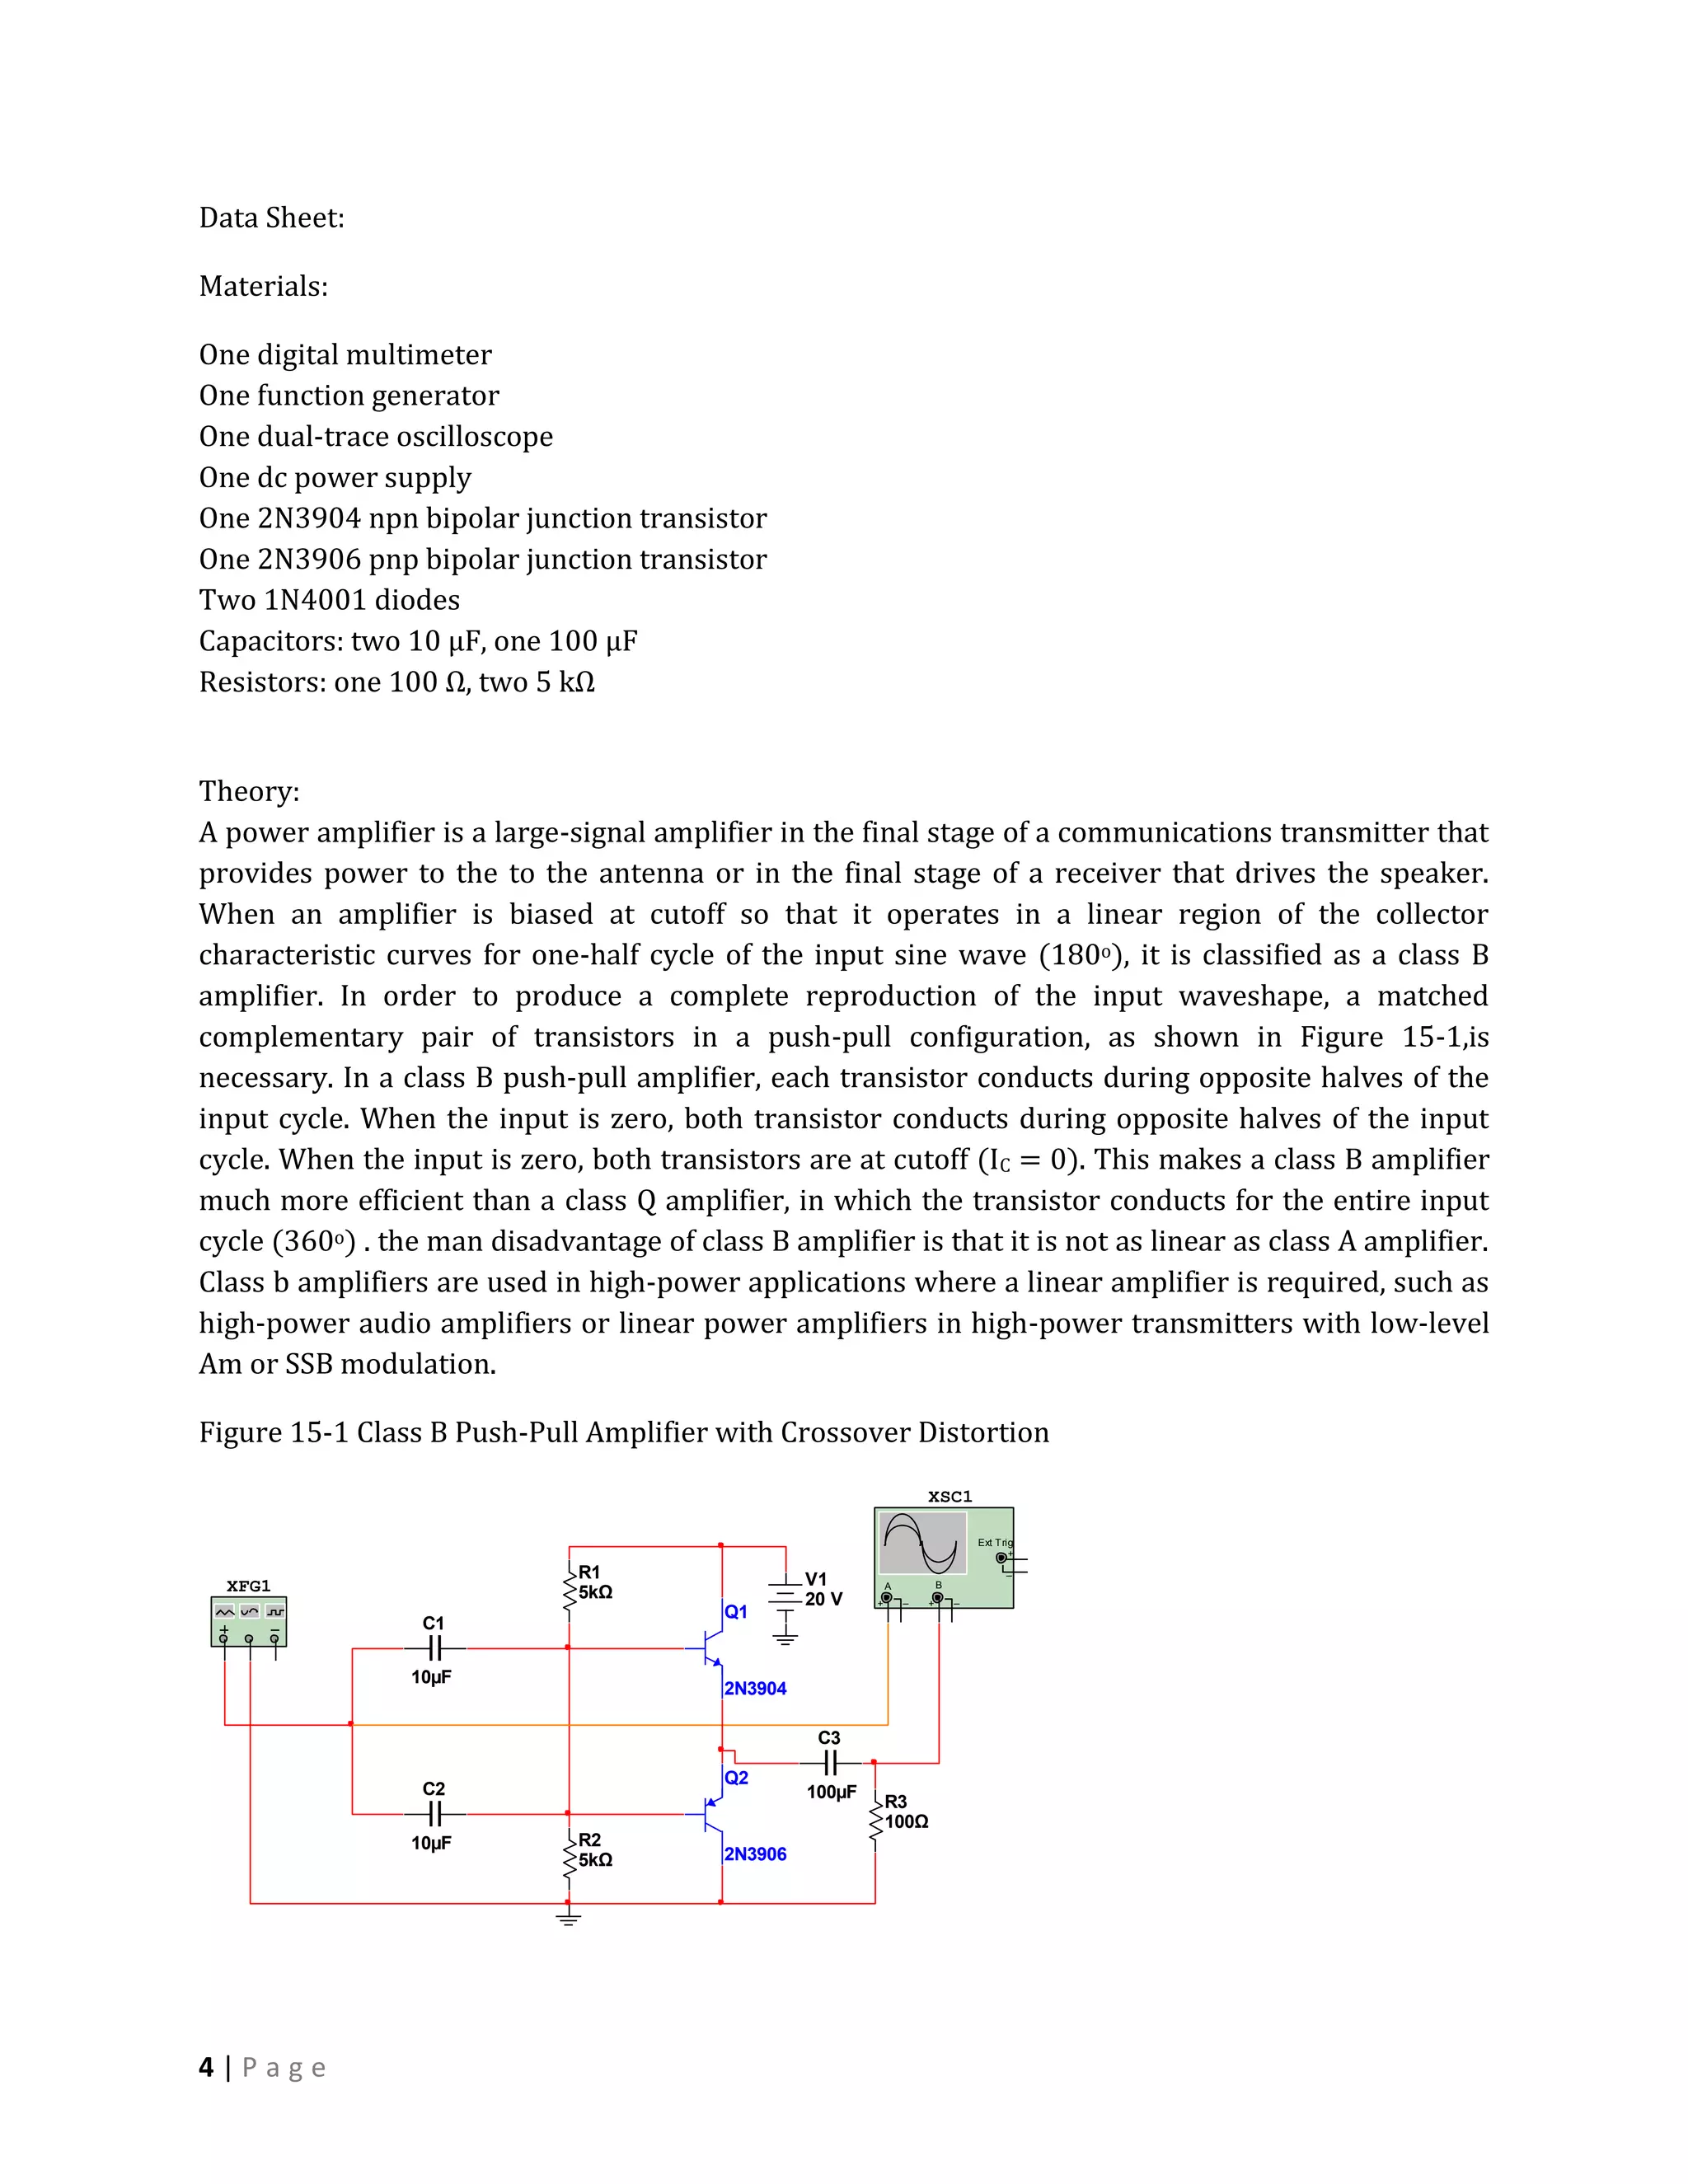
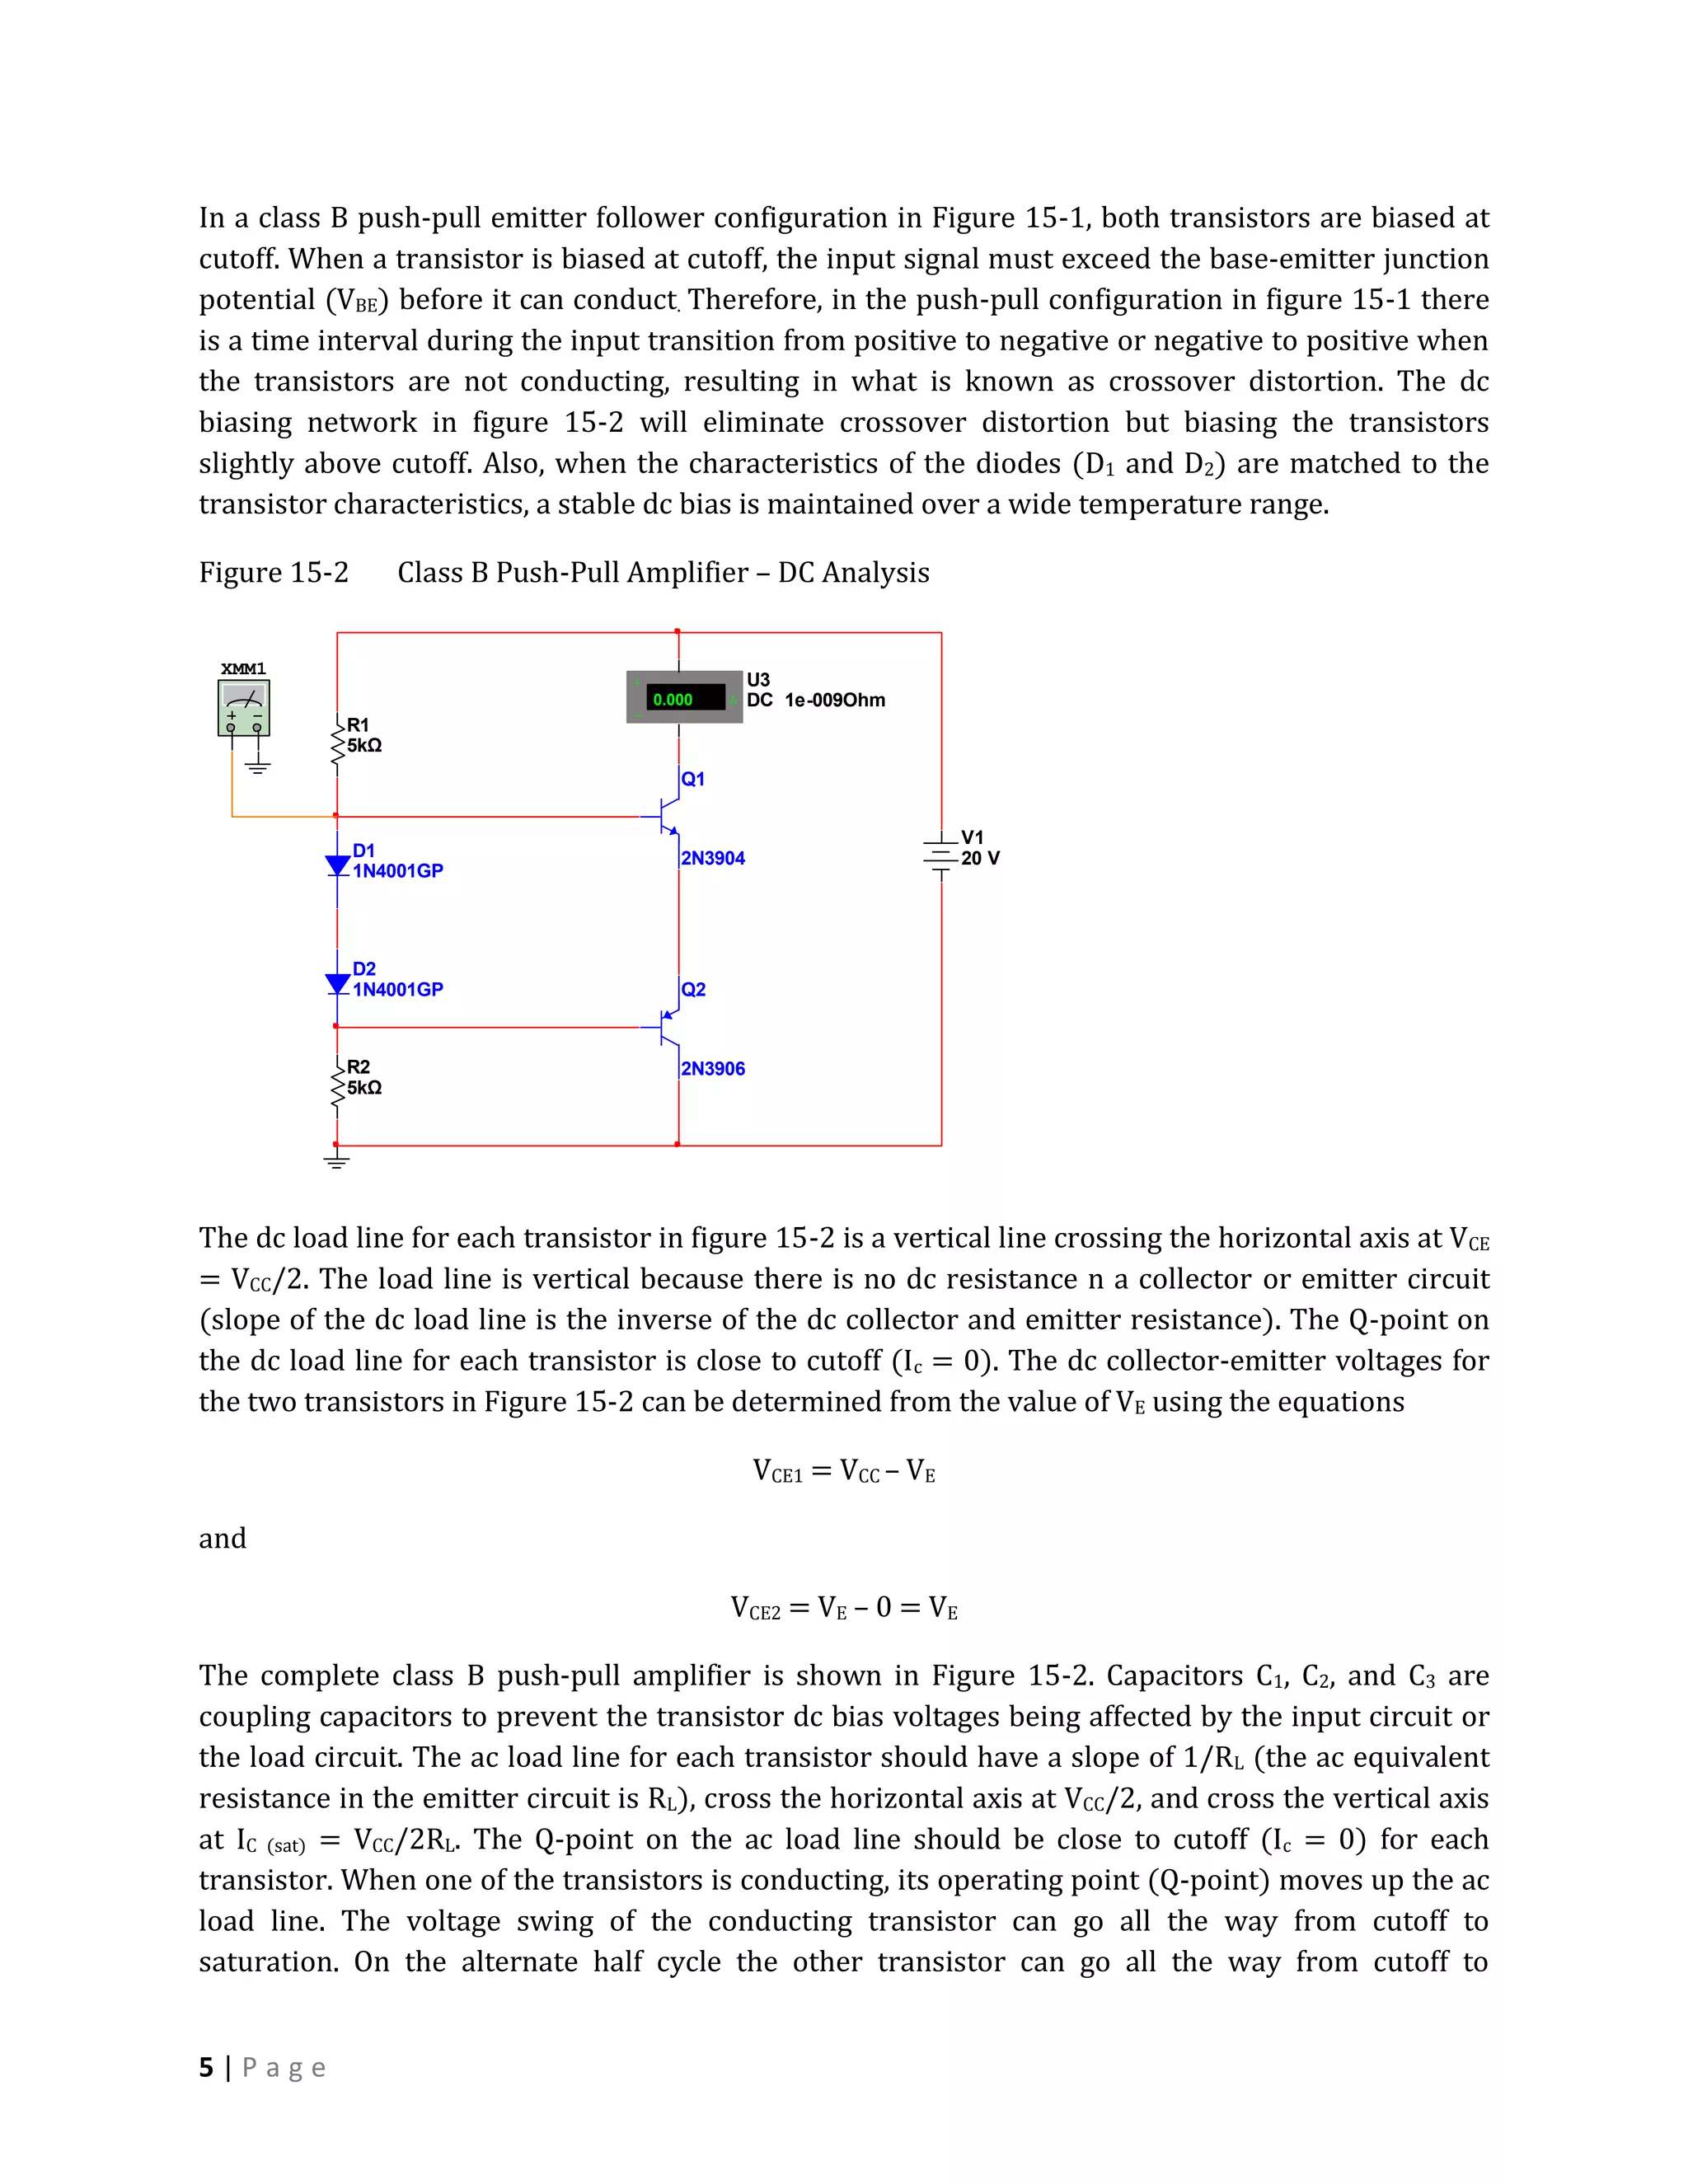
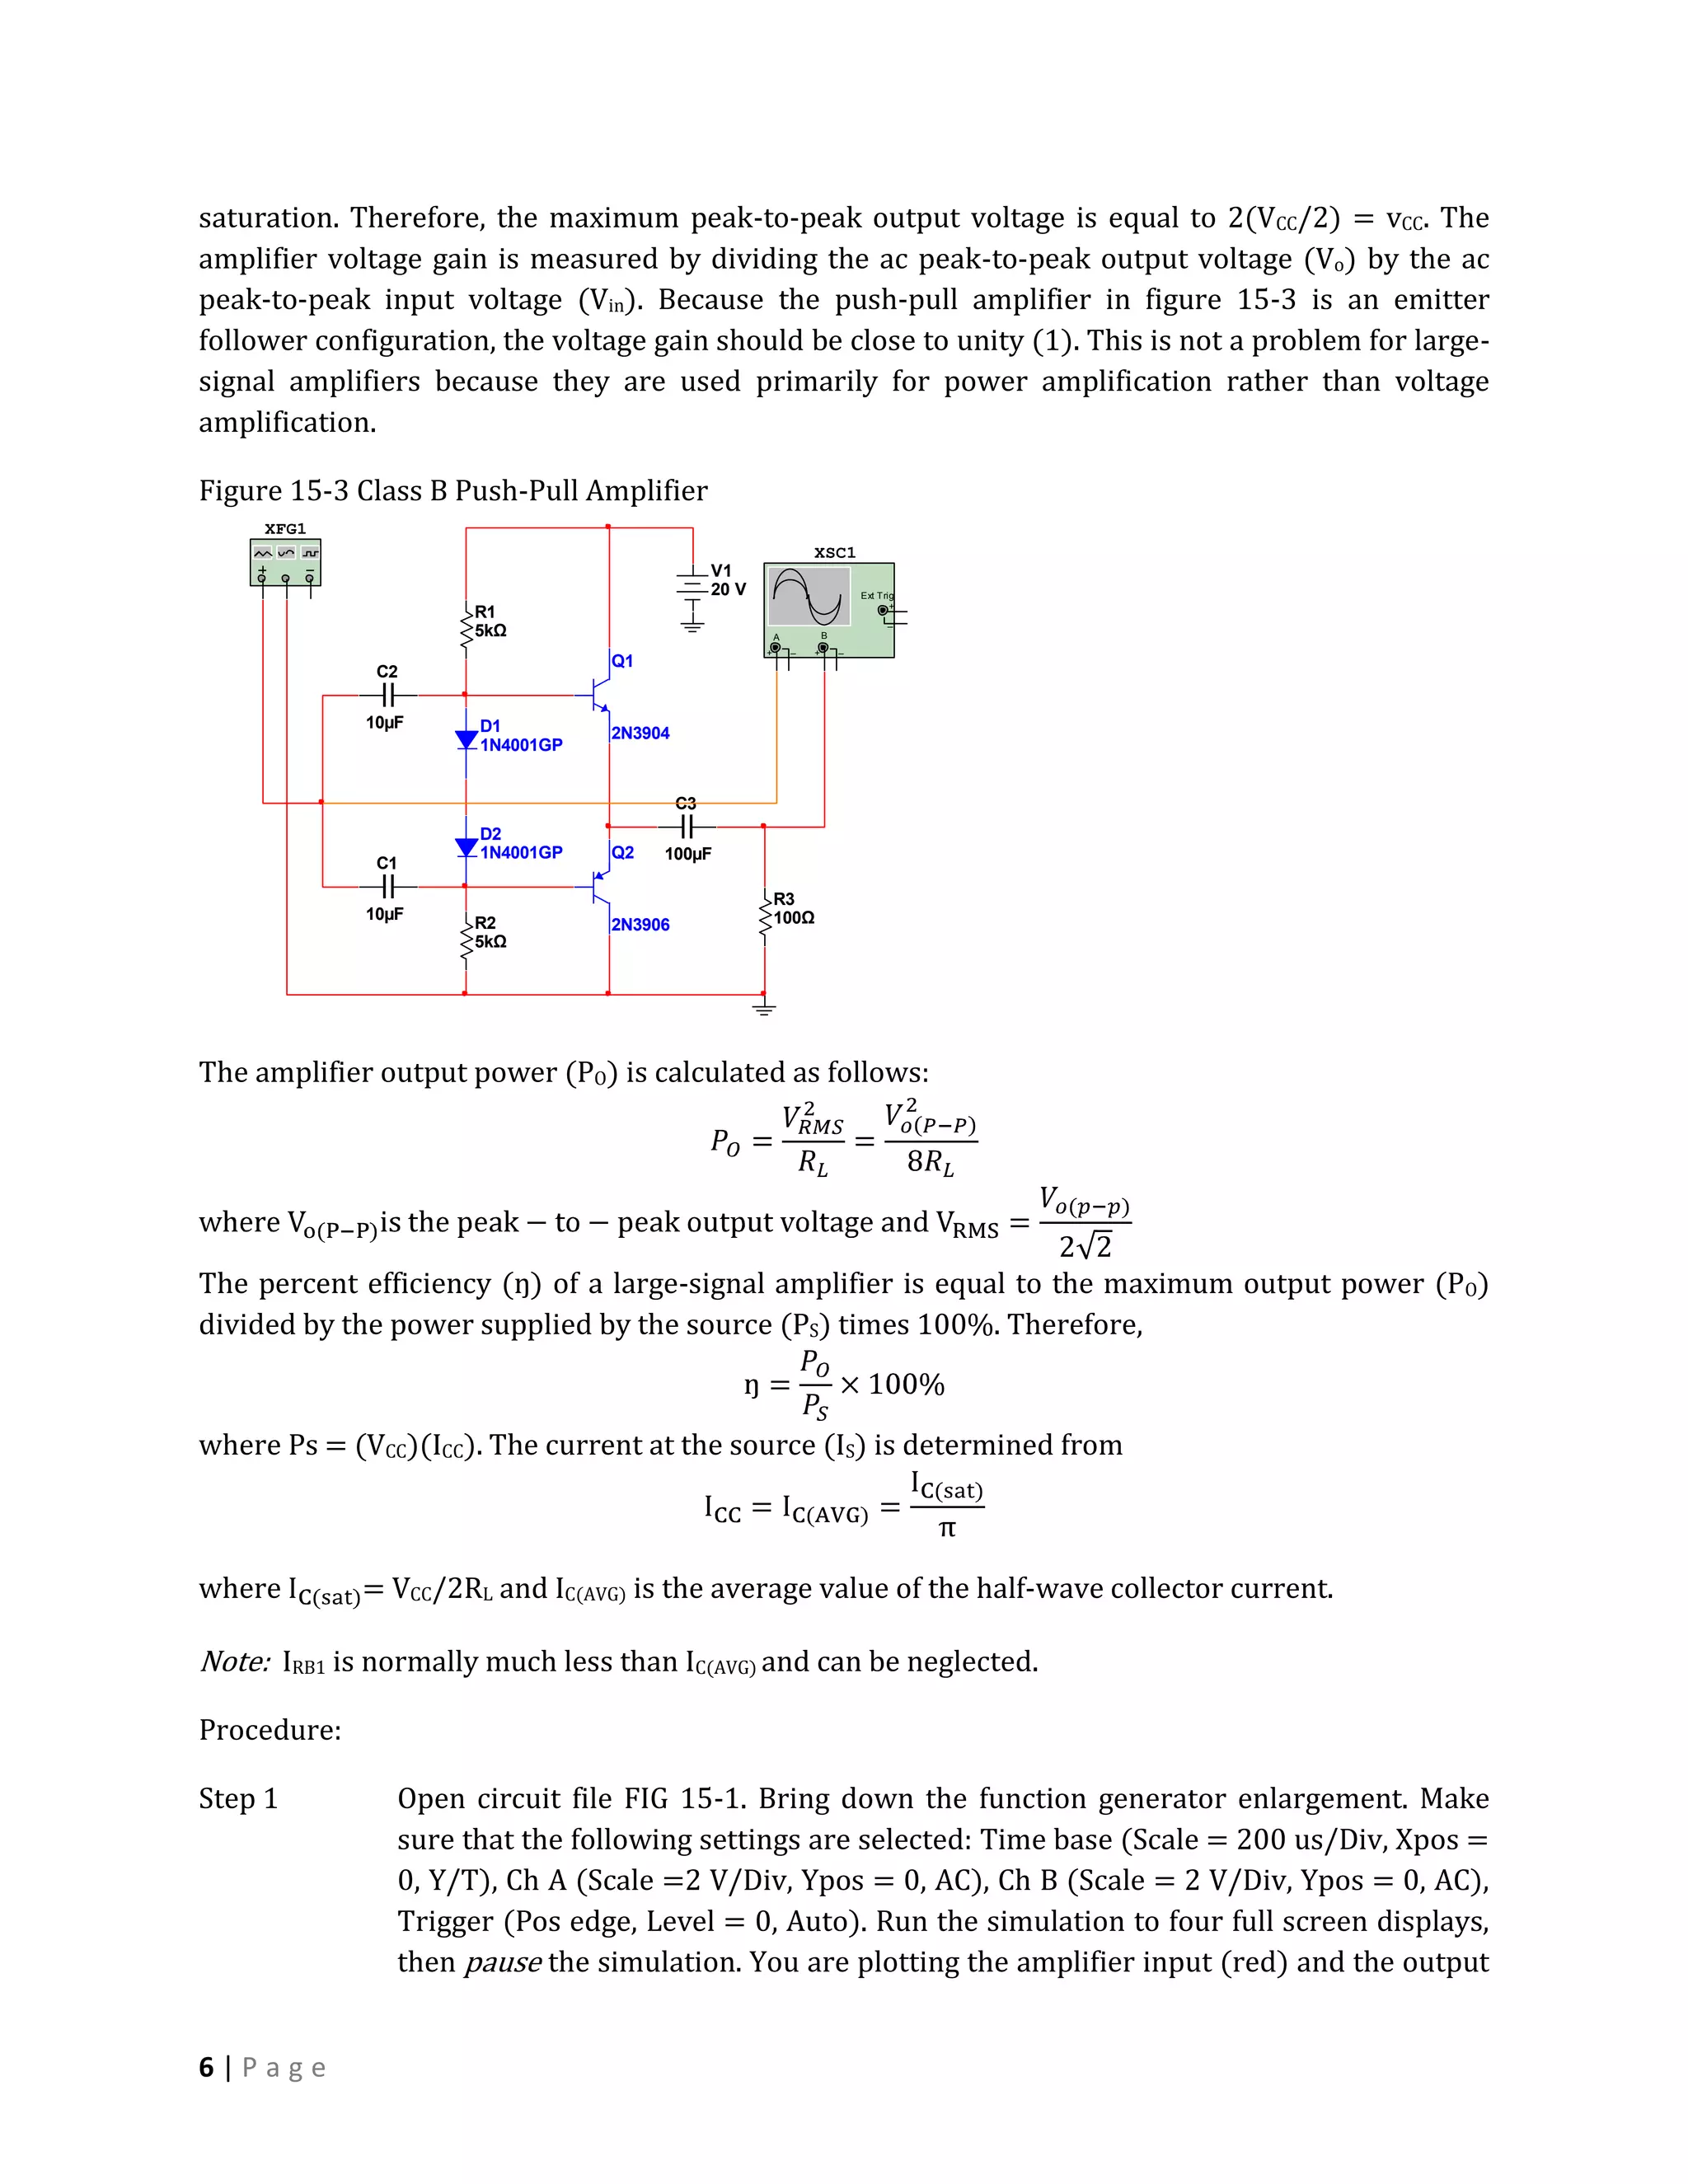
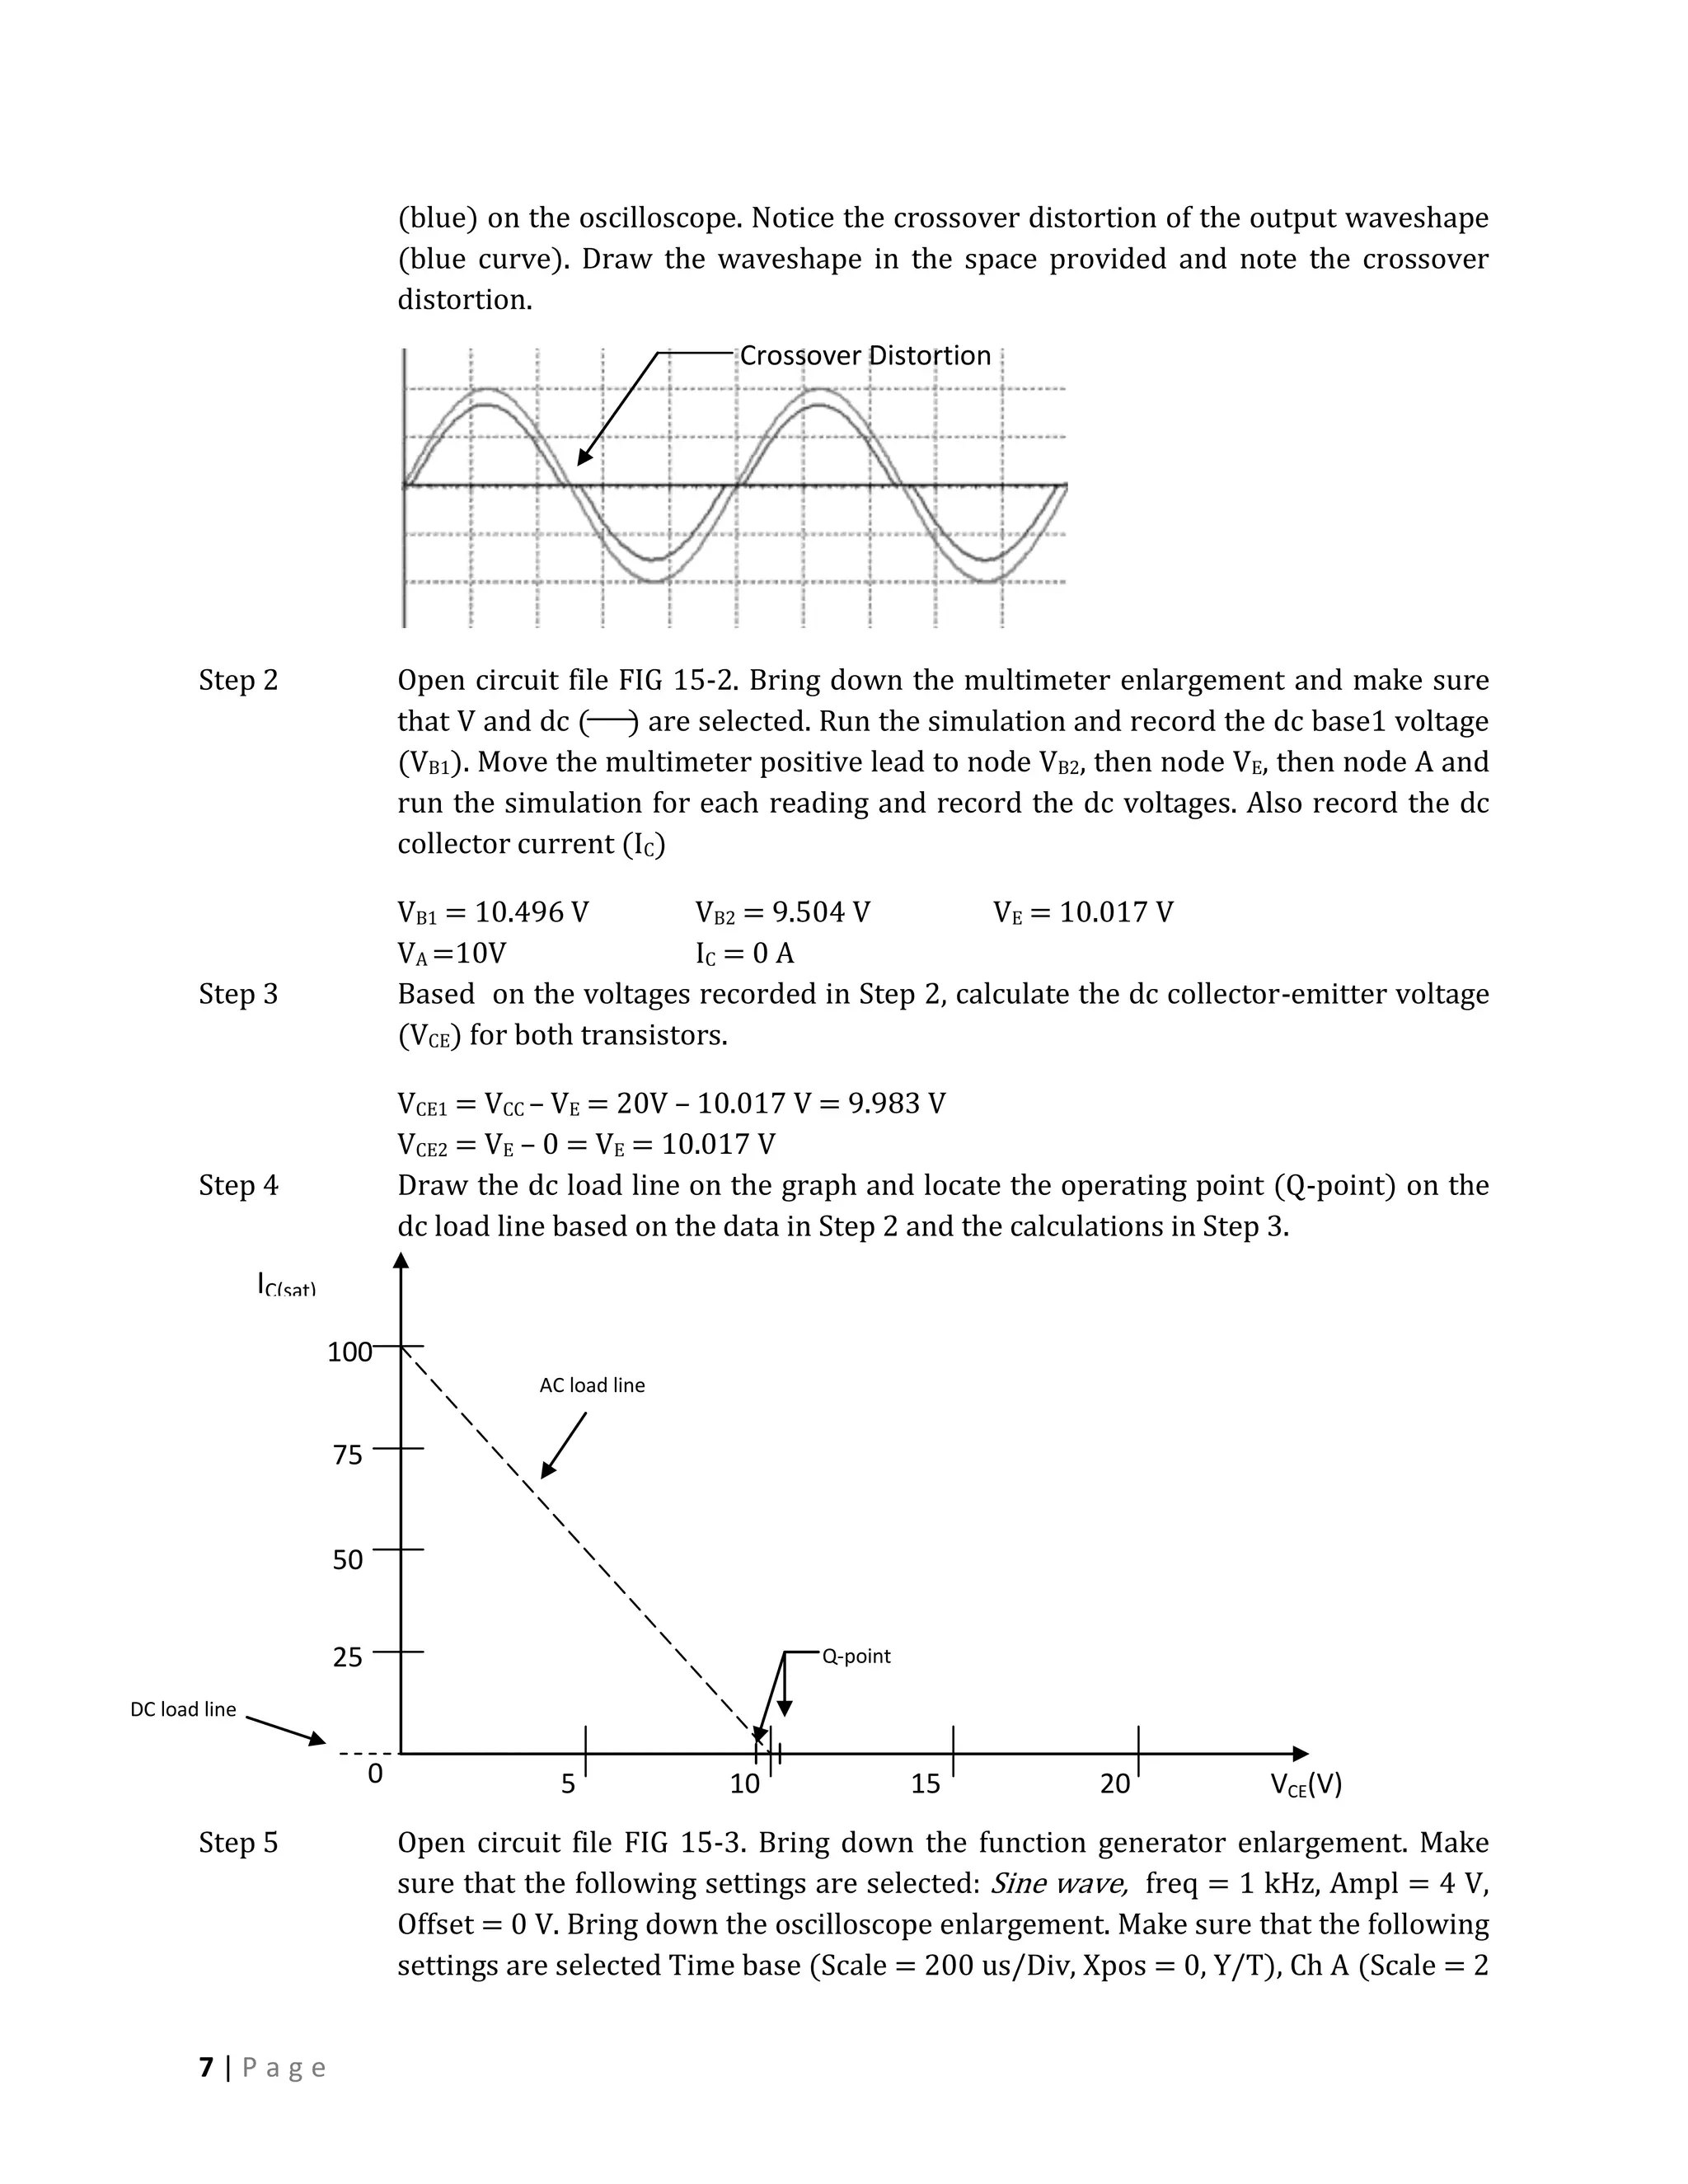
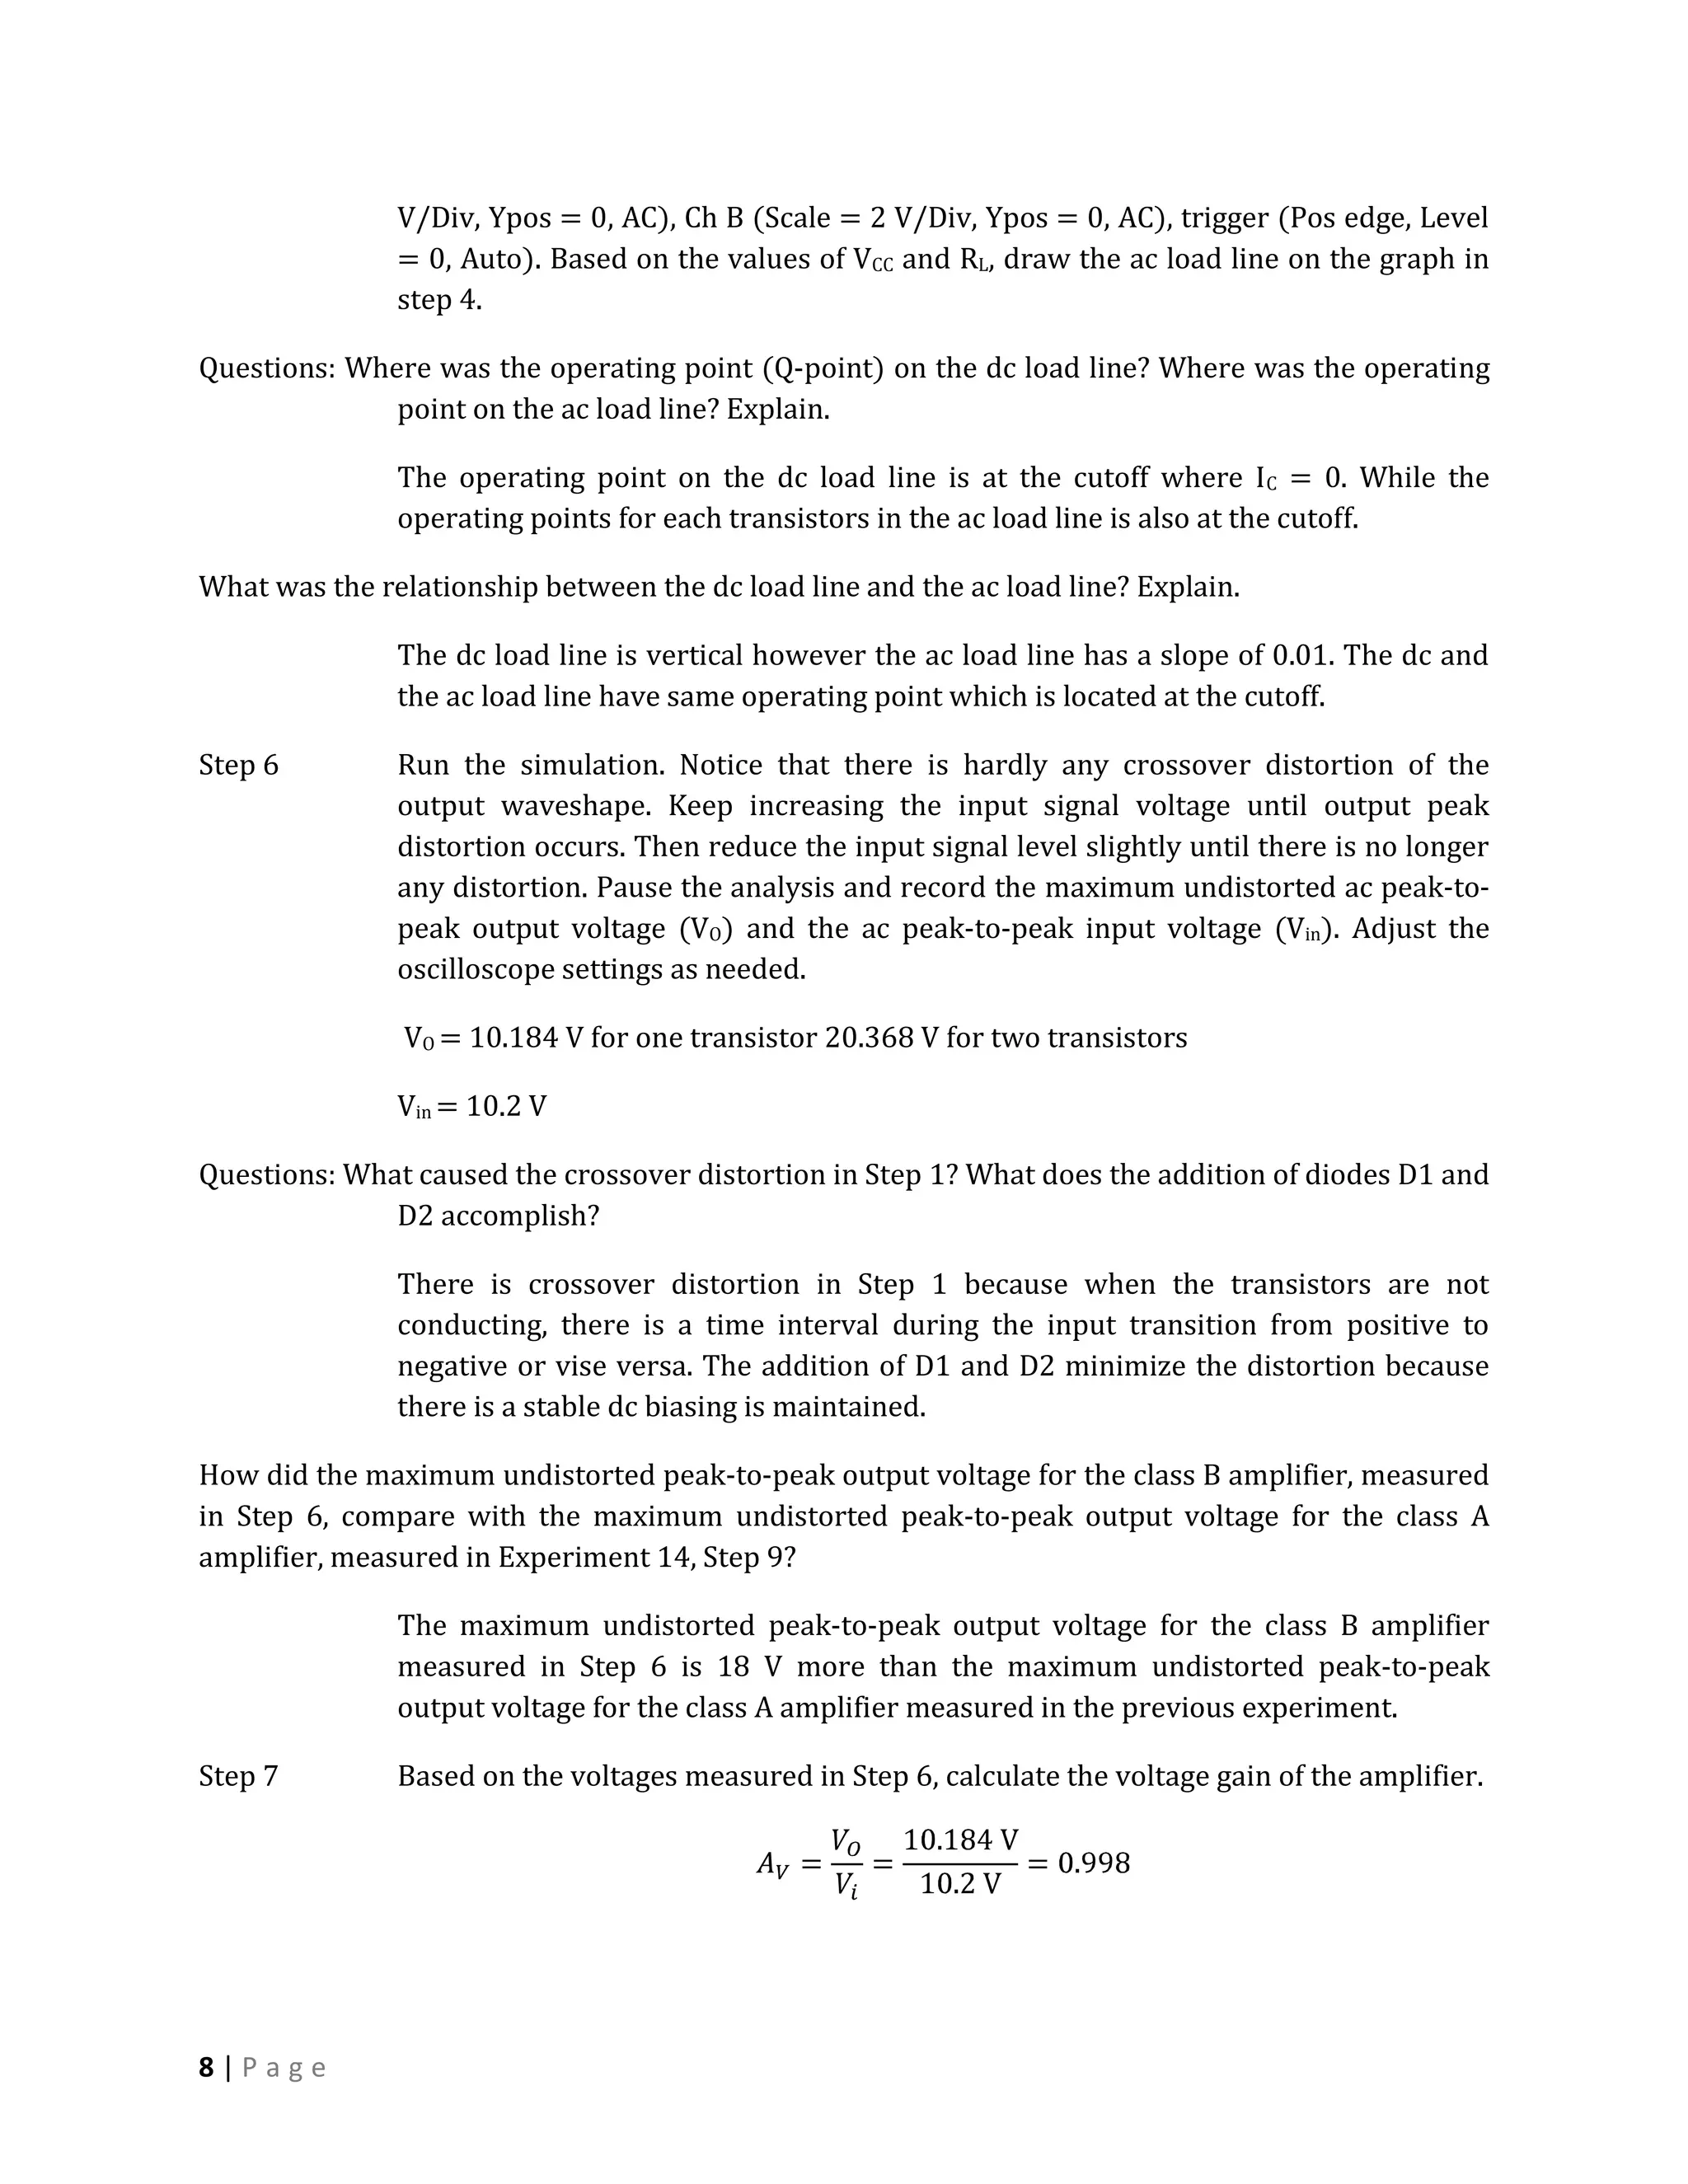
Bipolar Junction Transistor (BJT) DC and AC AnalysisJess Rangcasajo
BJT AC and DC Analysis
This slide condenses the two ways analysis of BJT (AC and DC).
At the end of the slide, it has review question answer with answer key as providing.
MULTISTAGE AMPLIFIERS
Definition: An amplifier formed by connecting several amplifiers in cascaded arrangement such that output of one amplifier becomes the input of other whose output becomes input of next and so on .
Each amplifier in this configuration is known as stage.
So several stages are connected to form multistage amplifier.
Working of multistage amplifier: Each amplifier connected perform the process of amplification
They convert their input signal into high amplified output signal.
Hence the output signal after passing through several amplifiers becomes highly amplified.
Each amplifier connected perform the process of amplification
They convert their input signal into high amplified output signal.
Hence the output signal after passing through several amplifiers becomes highly amplified.
Voltage gain: The overall voltage gain of multistage amplifier is product of voltage gain of individual amplifier.
If voltage is expressed in dB overall voltage gain is by the sum of voltage gain in dB of individual amplifier.
If we convert voltage gain into the db voltage gain then we use a relation.
Direct coupled multistage amplifier: A direct coupled amplifier is a type of amplifier in which two amplifier are connected in a such a way that one stage is coupled directly to the other without using any coupling or bypassing capacitor.
In this configuration dc collector voltage of first stage provides base bias to second stage means output of first stage becomes input of second stage.
Disadvantages : A small changes in the dc bias voltages due to temperature effects or power supply variation are amplified by the succeeding stages so an unwanted signal appears at the output.
Applicatons : It is used in TV receivers’ computers ,regulator circuits and other electronic instruments
Electronics and Communication Engineering is the Branch of Engineering. Electronics and Communication Engineering field requires an understanding of core areas including Engineering Graphics, Computer Programming,Electronics Devices and Circuits-I, Network Analysis, Signals and Systems, Communication Systems, Electromagnetics Engineering, Digital Signal Processing, Embedded Systems, Microprocessor and Computer Architecture. Ekeeda offers Online Mechanical Engineering Courses for all the Subjects as per the Syllabus. Visit : https://ekeeda.com/streamdetails/stream/Electronics-and-Communication-Engineering
SPICE MODEL of 1MB15D-060 (Professional+FWDS Model) in SPICE PARKTsuyoshi Horigome
SPICE MODEL of 1MB15D-060 (Professional+FWDS Model) in SPICE PARK. English Version is http://www.spicepark.net. Japanese Version is http://www.spicepark.com by Bee Technologies.
SPICE MODEL of LM7915 SIMetrix in SPICE PARK. English Version is http://www.spicepark.net. Japanese Version is http://www.spicepark.com by Bee Technologies.
Premium MEAN Stack Development Solutions for Modern BusinessesSynapseIndia
Stay ahead of the curve with our premium MEAN Stack Development Solutions. Our expert developers utilize MongoDB, Express.js, AngularJS, and Node.js to create modern and responsive web applications. Trust us for cutting-edge solutions that drive your business growth and success.
Know more: https://www.synapseindia.com/technology/mean-stack-development-company.html
Digital Transformation and IT Strategy Toolkit and TemplatesAurelien Domont, MBA
This Digital Transformation and IT Strategy Toolkit was created by ex-McKinsey, Deloitte and BCG Management Consultants, after more than 5,000 hours of work. It is considered the world's best & most comprehensive Digital Transformation and IT Strategy Toolkit. It includes all the Frameworks, Best Practices & Templates required to successfully undertake the Digital Transformation of your organization and define a robust IT Strategy.
Editable Toolkit to help you reuse our content: 700 Powerpoint slides | 35 Excel sheets | 84 minutes of Video training
This PowerPoint presentation is only a small preview of our Toolkits. For more details, visit www.domontconsulting.com
Putting the SPARK into Virtual Training.pptxCynthia Clay
This 60-minute webinar, sponsored by Adobe, was delivered for the Training Mag Network. It explored the five elements of SPARK: Storytelling, Purpose, Action, Relationships, and Kudos. Knowing how to tell a well-structured story is key to building long-term memory. Stating a clear purpose that doesn't take away from the discovery learning process is critical. Ensuring that people move from theory to practical application is imperative. Creating strong social learning is the key to commitment and engagement. Validating and affirming participants' comments is the way to create a positive learning environment.
Implicitly or explicitly all competing businesses employ a strategy to select a mix
of marketing resources. Formulating such competitive strategies fundamentally
involves recognizing relationships between elements of the marketing mix (e.g.,
price and product quality), as well as assessing competitive and market conditions
(i.e., industry structure in the language of economics).
B2B payments are rapidly changing. Find out the 5 key questions you need to be asking yourself to be sure you are mastering B2B payments today. Learn more at www.BlueSnap.com.
An introduction to the cryptocurrency investment platform Binance Savings.Any kyc Account
Learn how to use Binance Savings to expand your bitcoin holdings. Discover how to maximize your earnings on one of the most reliable cryptocurrency exchange platforms, as well as how to earn interest on your cryptocurrency holdings and the various savings choices available.
3.0 Project 2_ Developing My Brand Identity Kit.pptxtanyjahb
A personal brand exploration presentation summarizes an individual's unique qualities and goals, covering strengths, values, passions, and target audience. It helps individuals understand what makes them stand out, their desired image, and how they aim to achieve it.
Auditing study material for b.com final year students
SIGNAL SPECTRA EXPERIMENT 2 - FINALS (for CAUAN)
1. NATIONAL COLLEGE OF SCIENCE AND TECHNOLOGY
Amafel Bldg. Aguinaldo Highway Dasmariñas City, Cavite
EXPERIMENT # 2
Class B Push-Pull Power Amplifier
Cauan, Sarah Krystelle P. October 11, 2011
Signal Spectra and Signal Processing/ BSECE 41A1 Score:
Engr. Grace Ramones
Instructor
1|Page
2. Objectives:
1. Determine the dc load line and locate the operating point (Q-point) on the dc load line for a
class B push-pull amplifier.
2. Determine the ac load line for a class B push-pull amplifier.
3. Observe crossover distortion of the output waveshape and learn how to estimate it in a
class b push-pull amplifier.
4. Determine the maximum ac peak-to-peak output voltage swing before peak clipping occurs
and compare the measured value with the expected value for a class B push-pull amplifier.
5. Compare the maximum undistorted ac peak-to-peak output voltage swing for a class B
amplifier with the maximum for a class A amplifier.
6. Measure the large-signal voltage gain of a class B push-pull amplifier.
7. Measure the maximum undistorted output power for a class B push-pull amplifier.
8. Determine the amplifier efficiency of a class B push-pull amplifier.
2|Page
3. Sample Computation:
Step 7 – Computation of voltage gain
Step 9 Output power
Step 10 Input power
Step 11 Power efficiency
3|Page
4. Data Sheet:
Materials:
One digital multimeter
One function generator
One dual-trace oscilloscope
One dc power supply
One 2N3904 npn bipolar junction transistor
One 2N3906 pnp bipolar junction transistor
Two 1N4001 diodes
Capacitors: two 10 µF, one 100 µF
Resistors: one 100 Ω, two 5 kΩ
Theory:
A power amplifier is a large-signal amplifier in the final stage of a communications transmitter that
provides power to the to the antenna or in the final stage of a receiver that drives the speaker.
When an amplifier is biased at cutoff so that it operates in a linear region of the collector
characteristic curves for one-half cycle of the input sine wave (180o), it is classified as a class B
amplifier. In order to produce a complete reproduction of the input waveshape, a matched
complementary pair of transistors in a push-pull configuration, as shown in Figure 15-1,is
necessary. In a class B push-pull amplifier, each transistor conducts during opposite halves of the
input cycle. When the input is zero, both transistor conducts during opposite halves of the input
cycle. When the input is zero, both transistors are at cutoff (IC = 0). This makes a class B amplifier
much more efficient than a class Q amplifier, in which the transistor conducts for the entire input
cycle (360o) . the man disadvantage of class B amplifier is that it is not as linear as class A amplifier.
Class b amplifiers are used in high-power applications where a linear amplifier is required, such as
high-power audio amplifiers or linear power amplifiers in high-power transmitters with low-level
Am or SSB modulation.
Figure 15-1 Class B Push-Pull Amplifier with Crossover Distortion
XSC1
Ext T rig
+
R1 V1
_
XFG1 5kΩ A B
20 V + _ + _
Q1
C1
10µF
2N3904
C3
Q2
C2 100µF
R3
100Ω
10µF R2
5kΩ 2N3906
4|Page
5. In a class B push-pull emitter follower configuration in Figure 15-1, both transistors are biased at
cutoff. When a transistor is biased at cutoff, the input signal must exceed the base-emitter junction
potential (VBE) before it can conduct. Therefore, in the push-pull configuration in figure 15-1 there
is a time interval during the input transition from positive to negative or negative to positive when
the transistors are not conducting, resulting in what is known as crossover distortion. The dc
biasing network in figure 15-2 will eliminate crossover distortion but biasing the transistors
slightly above cutoff. Also, when the characteristics of the diodes (D1 and D2) are matched to the
transistor characteristics, a stable dc bias is maintained over a wide temperature range.
Figure 15-2 Class B Push-Pull Amplifier – DC Analysis
XMM1
+ U3
0.000 A DC 1e-009Ohm
-
R1
5kΩ
Q1
V1
D1 2N3904 20 V
1N4001GP
D2
1N4001GP Q2
R2 2N3906
5kΩ
The dc load line for each transistor in figure 15-2 is a vertical line crossing the horizontal axis at VCE
= VCC/2. The load line is vertical because there is no dc resistance n a collector or emitter circuit
(slope of the dc load line is the inverse of the dc collector and emitter resistance). The Q-point on
the dc load line for each transistor is close to cutoff (Ic = 0). The dc collector-emitter voltages for
the two transistors in Figure 15-2 can be determined from the value of VE using the equations
VCE1 = VCC – VE
and
VCE2 = VE – 0 = VE
The complete class B push-pull amplifier is shown in Figure 15-2. Capacitors C1, C2, and C3 are
coupling capacitors to prevent the transistor dc bias voltages being affected by the input circuit or
the load circuit. The ac load line for each transistor should have a slope of 1/RL (the ac equivalent
resistance in the emitter circuit is RL), cross the horizontal axis at VCC/2, and cross the vertical axis
at IC (sat) = VCC/2RL. The Q-point on the ac load line should be close to cutoff (Ic = 0) for each
transistor. When one of the transistors is conducting, its operating point (Q-point) moves up the ac
load line. The voltage swing of the conducting transistor can go all the way from cutoff to
saturation. On the alternate half cycle the other transistor can go all the way from cutoff to
5|Page
6. saturation. Therefore, the maximum peak-to-peak output voltage is equal to 2(VCC/2) = vCC. The
amplifier voltage gain is measured by dividing the ac peak-to-peak output voltage (Vo) by the ac
peak-to-peak input voltage (Vin). Because the push-pull amplifier in figure 15-3 is an emitter
follower configuration, the voltage gain should be close to unity (1). This is not a problem for large-
signal amplifiers because they are used primarily for power amplification rather than voltage
amplification.
Figure 15-3 Class B Push-Pull Amplifier
XFG1
XSC1
V1
20 V Ext T rig
+
R1 _
5kΩ A B
+ _ + _
Q1
C2
10µF D1 2N3904
1N4001GP
C3
D2
1N4001GP Q2 100µF
C1
R3
10µF 100Ω
R2 2N3906
5kΩ
The amplifier output power (PO) is calculated as follows:
The percent efficiency (ŋ) of a large-signal amplifier is equal to the maximum output power (PO)
divided by the power supplied by the source (PS) times 100%. Therefore,
where Ps = (VCC)(ICC). The current at the source (IS) is determined from
where = VCC/2RL and IC(AVG) is the average value of the half-wave collector current.
Note: IRB1 is normally much less than IC(AVG) and can be neglected.
Procedure:
Step 1 Open circuit file FIG 15-1. Bring down the function generator enlargement. Make
sure that the following settings are selected: Time base (Scale = 200 us/Div, Xpos =
0, Y/T), Ch A (Scale =2 V/Div, Ypos = 0, AC), Ch B (Scale = 2 V/Div, Ypos = 0, AC),
Trigger (Pos edge, Level = 0, Auto). Run the simulation to four full screen displays,
then pause the simulation. You are plotting the amplifier input (red) and the output
6|Page
7. (blue) on the oscilloscope. Notice the crossover distortion of the output waveshape
(blue curve). Draw the waveshape in the space provided and note the crossover
distortion.
Crossover Distortion
Step 2 Open circuit file FIG 15-2. Bring down the multimeter enlargement and make sure
that V and dc ( ) are selected. Run the simulation and record the dc base1 voltage
(VB1). Move the multimeter positive lead to node VB2, then node VE, then node A and
run the simulation for each reading and record the dc voltages. Also record the dc
collector current (IC)
VB1 = 10.496 V VB2 = 9.504 V VE = 10.017 V
VA =10V IC = 0 A
Step 3 Based on the voltages recorded in Step 2, calculate the dc collector-emitter voltage
(VCE) for both transistors.
VCE1 = VCC – VE = 20V – 10.017 V = 9.983 V
VCE2 = VE – 0 = VE = 10.017 V
Step 4 Draw the dc load line on the graph and locate the operating point (Q-point) on the
dc load line based on the data in Step 2 and the calculations in Step 3.
IC(sat)
100
AC load line
75
50
25 Q-point
DC load line
0 5 10 15 20 VCE(V)
Step 5 Open circuit file FIG 15-3. Bring down the function generator enlargement. Make
sure that the following settings are selected: Sine wave, freq = 1 kHz, Ampl = 4 V,
Offset = 0 V. Bring down the oscilloscope enlargement. Make sure that the following
settings are selected Time base (Scale = 200 us/Div, Xpos = 0, Y/T), Ch A (Scale = 2
7|Page
8. V/Div, Ypos = 0, AC), Ch B (Scale = 2 V/Div, Ypos = 0, AC), trigger (Pos edge, Level
= 0, Auto). Based on the values of VCC and RL, draw the ac load line on the graph in
step 4.
Questions: Where was the operating point (Q-point) on the dc load line? Where was the operating
point on the ac load line? Explain.
The operating point on the dc load line is at the cutoff where I C = 0. While the
operating points for each transistors in the ac load line is also at the cutoff.
What was the relationship between the dc load line and the ac load line? Explain.
The dc load line is vertical however the ac load line has a slope of 0.01. The dc and
the ac load line have same operating point which is located at the cutoff.
Step 6 Run the simulation. Notice that there is hardly any crossover distortion of the
output waveshape. Keep increasing the input signal voltage until output peak
distortion occurs. Then reduce the input signal level slightly until there is no longer
any distortion. Pause the analysis and record the maximum undistorted ac peak-to-
peak output voltage (VO) and the ac peak-to-peak input voltage (Vin). Adjust the
oscilloscope settings as needed.
VO = 10.184 V for one transistor 20.368 V for two transistors
Vin = 10.2 V
Questions: What caused the crossover distortion in Step 1? What does the addition of diodes D1 and
D2 accomplish?
There is crossover distortion in Step 1 because when the transistors are not
conducting, there is a time interval during the input transition from positive to
negative or vise versa. The addition of D1 and D2 minimize the distortion because
there is a stable dc biasing is maintained.
How did the maximum undistorted peak-to-peak output voltage for the class B amplifier, measured
in Step 6, compare with the maximum undistorted peak-to-peak output voltage for the class A
amplifier, measured in Experiment 14, Step 9?
The maximum undistorted peak-to-peak output voltage for the class B amplifier
measured in Step 6 is 18 V more than the maximum undistorted peak-to-peak
output voltage for the class A amplifier measured in the previous experiment.
Step 7 Based on the voltages measured in Step 6, calculate the voltage gain of the amplifier.
8|Page
9. Questions: How did the measured amplifier voltage gain compare with the expected value for a
class B push-pull emitter circuit?
The measured and expected value of the amplifier voltage gain have a difference of
0.002 therefore, the measured AV is almost what expected value is.
Step 8 Based on the ac load line and Q-point located on the graph in Step 4, estimate what
the maximum ac peak-to-peak output voltage (Vo) should be before output clipping
occurs. Record your answer.
Vo = 10V
Question: How did the maximum undistorted peak-to-peak output voltage measured in step 6
compare with the expected maximum estimated in Step 8?
The difference is 0.184 V or 1.81% difference.
Step 9 Based on the maximum undistorted ac peak-to-peak output voltage measured in
Step 6, calculate the maximum undistorted output power (PO) to the load (RL).
Step 10 Based on the supply voltage (VCC) and the average collector current (IC(AVG)),
calculate the power supplied by the dc voltage source (PS).
Step 11 Based on the power supplied by the dc voltage source (PS) and the maximum
undistorted output power (PO) calculated in Step 9, calculate the efficiency (ŋ) of the
amplifier.
Questions: How did the efficiency of this class B push-pull amplifier compare with the efficiency of
the class A amplifier in Experiment 14?
The efficiency of this class B push-pull amplifier is much higher than the efficiency of the class A
amplifier.
9|Page
10. Conclusion
After performing the experiment about class B, I conclude that class B is much different
from class A. Class B conducts at half cycle unlike class A. To produce full cycle wave class B uses a
matched complementary pairs of transistors in a push-pull configuration. Moreover, the quiescent
point of the class B amplifier is located at the cutoff of each transistor because the value of the
collector current is zero that is why the dc load line appears as a vertical line. The ac load line
crosses the saturation current and the half of the supply voltage. Its slope is the inverse of the load
resistance.
In addition, when the input voltage exceeds the maximum ac peak-to-peak output voltage
swing, a crossover distortion will occur in the output signal. Furthermore, a crossover distortion
occurs because there are time intervals when the transistors are not conducting. To avoid this,
diodes are connected to the network to maintain a stable dc bias. The voltage gain of class B push-
pull amplifier is close to the unity gain. Lastly, the power efficiency of class B is much higher than
with class A amplifier.
10 | P a g e