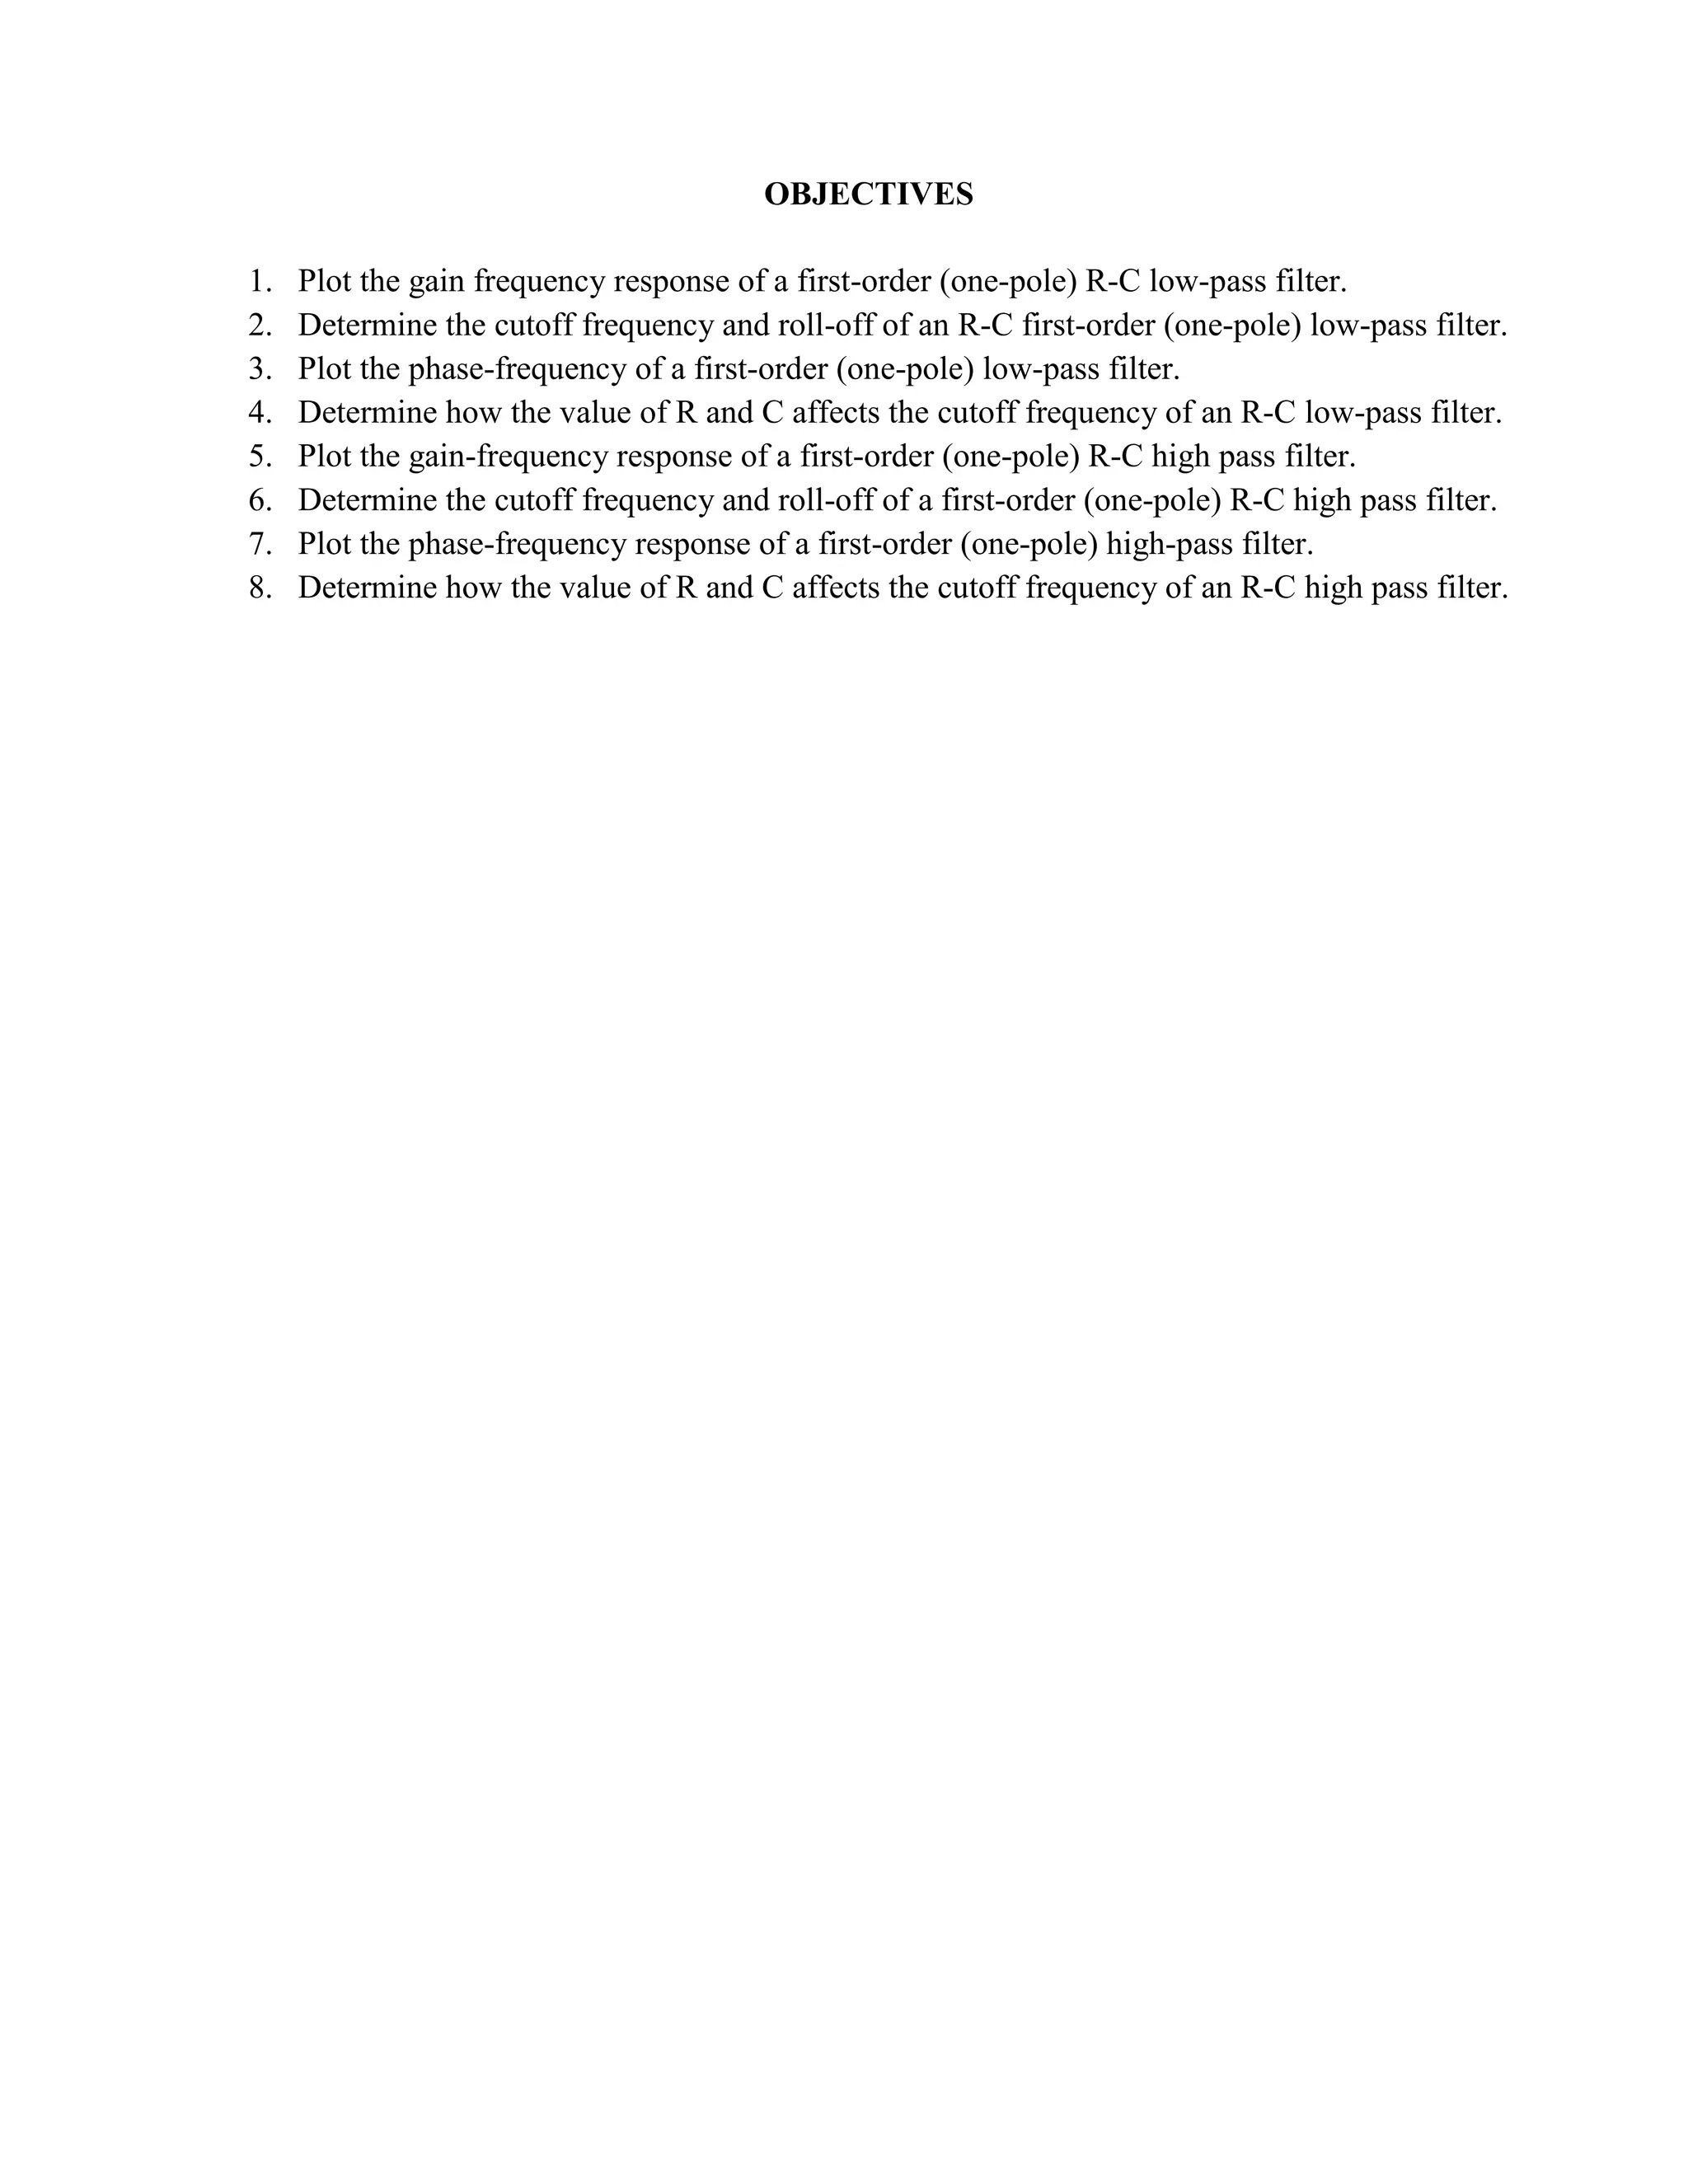
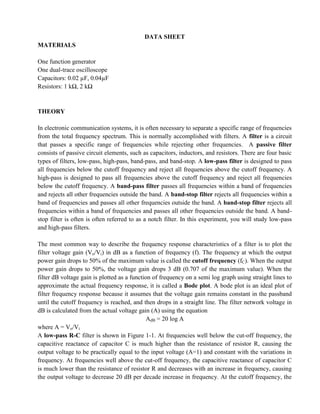
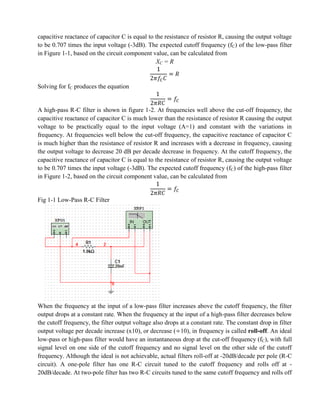
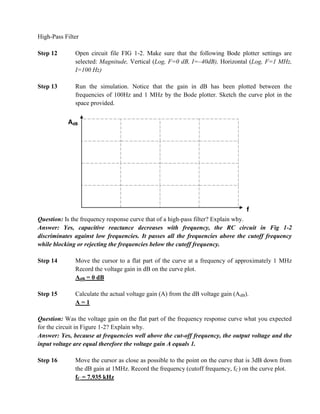
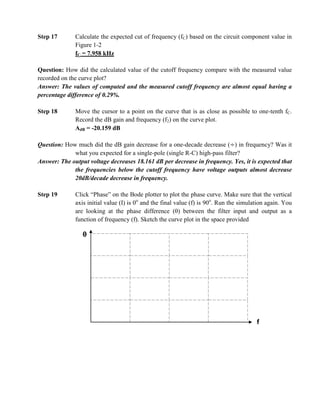
This document outlines objectives and procedures for analyzing low-pass and high-pass filters. It includes plotting gain and phase responses, determining cutoff frequencies, and examining how component values affect cutoff frequency. Key points are:
- Low-pass filters pass low frequencies and reject high frequencies, with output dropping 20dB/decade above the cutoff frequency.
- High-pass filters pass high frequencies and reject low frequencies, with output dropping 20dB/decade below the cutoff frequency.
- Cutoff frequency is where the output drops to 70.7% of the maximum and is determined by component values based on formulas.
5. An analog filer has system fnction Ha(s)--a (a) (10 pts,) Comvert .pdfinfo324235
5. An analog filer has system fnction Ha(s)--a (a) (10 pts,) Comvert this analog filter into a
digital iker by means of the bilineasr filter by means of the bilinear trasformation method with T,
= 0.1. (b) (5 pts.) Is this filter FIR or IIR? (c) (5 pts.) Find the poles of this digital filher
Solution
Hundreds if not thousands of different kinds of filters have been developed to meet the needs of
various applications. Despite this variety, many filters can be described by a few common
characteristics. The first of these is the frequency range of their pass band. A filter\'s pass band is
the range of frequencies over which it will pass an incoming signal. Signal frequencies lying
outside the pass band are attenuated. Many filters fall into one of the following response
categories, based on the overall shape of their pass band.
Low-pass filters pass low-frequency signals while blocking high-frequency signals. The pass
band ranges from DC (0 Hz) to a corner frequency FC.
High-pass filters pass high-frequency signals while blocking DC and low-frequency signals. The
pass band ranges from a corner frequency (FC) to infinity.
Band-pass filters pass only signals between two given frequencies, blocking lower and higher
signals. The pass band lies between two frequencies, FL and FH. Signals between DC and FL are
blocked, as are signals from FH to infinity. The pass band of these filters is often characterized
as having a bandwidth that is symmetric around a center frequency.
Band-stop filters block signals occurring between two given frequencies, FL and FH. The pass
band is split into a low side (DC to FL) and a high side (FH to infinity). For this reason, it\'s
often simpler to specify a band-stop filter by the width and center frequency of its stop band.
Band-stop filters are also called notch filters, especially when the stop band is narrow.
Figure 1 shows how each of these filters operates on a swept-frequency input signal.
Figure 1. Filters are usually characterized by their frequency-domain performance. The effects
of a few common filter types on a swept-frequency input signal are shown here.
In the examples, the signal increases continuously in frequency, from a low frequency to a high
frequency. When the signal frequency is within the filter\'s pass band, the filter passes the signal.
As the signal moves out of the pass band, the filter begins to attenuate the signal.
Note that the transition from the pass band to the stop band is a gradual process, where the
filter\'s response decreases continuously. Although you can make this transition arbitrarily sharp
(at the cost of filter complexity), it can never be instantaneous, at least not in filters physically
realizable with today\'s technology.
The Bode and Phase Plots
Bode plots describe the behavior of a filter by relating the magnitude of the filter\'s response
(gain) to its frequency. An example of this type of plot is shown in Figure 2.
Figure 2. Filter responses are plotted on Bode plots, wh.
India Orthopedic Devices Market: Unlocking Growth Secrets, Trends and Develop...Kumar Satyam
According to TechSci Research report, “India Orthopedic Devices Market -Industry Size, Share, Trends, Competition Forecast & Opportunities, 2030”, the India Orthopedic Devices Market stood at USD 1,280.54 Million in 2024 and is anticipated to grow with a CAGR of 7.84% in the forecast period, 2026-2030F. The India Orthopedic Devices Market is being driven by several factors. The most prominent ones include an increase in the elderly population, who are more prone to orthopedic conditions such as osteoporosis and arthritis. Moreover, the rise in sports injuries and road accidents are also contributing to the demand for orthopedic devices. Advances in technology and the introduction of innovative implants and prosthetics have further propelled the market growth. Additionally, government initiatives aimed at improving healthcare infrastructure and the increasing prevalence of lifestyle diseases have led to an upward trend in orthopedic surgeries, thereby fueling the market demand for these devices.
As a business owner in Delaware, staying on top of your tax obligations is paramount, especially with the annual deadline for Delaware Franchise Tax looming on March 1. One such obligation is the annual Delaware Franchise Tax, which serves as a crucial requirement for maintaining your company’s legal standing within the state. While the prospect of handling tax matters may seem daunting, rest assured that the process can be straightforward with the right guidance. In this comprehensive guide, we’ll walk you through the steps of filing your Delaware Franchise Tax and provide insights to help you navigate the process effectively.
Buy Verified PayPal Account | Buy Google 5 Star Reviewsusawebmarket
Buy Verified PayPal Account
Looking to buy verified PayPal accounts? Discover 7 expert tips for safely purchasing a verified PayPal account in 2024. Ensure security and reliability for your transactions.
PayPal Services Features-
🟢 Email Access
🟢 Bank Added
🟢 Card Verified
🟢 Full SSN Provided
🟢 Phone Number Access
🟢 Driving License Copy
🟢 Fasted Delivery
Client Satisfaction is Our First priority. Our services is very appropriate to buy. We assume that the first-rate way to purchase our offerings is to order on the website. If you have any worry in our cooperation usually You can order us on Skype or Telegram.
24/7 Hours Reply/Please Contact
usawebmarketEmail: support@usawebmarket.com
Skype: usawebmarket
Telegram: @usawebmarket
WhatsApp: +1(218) 203-5951
USA WEB MARKET is the Best Verified PayPal, Payoneer, Cash App, Skrill, Neteller, Stripe Account and SEO, SMM Service provider.100%Satisfection granted.100% replacement Granted.
Remote sensing and monitoring are changing the mining industry for the better. These are providing innovative solutions to long-standing challenges. Those related to exploration, extraction, and overall environmental management by mining technology companies Odisha. These technologies make use of satellite imaging, aerial photography and sensors to collect data that might be inaccessible or from hazardous locations. With the use of this technology, mining operations are becoming increasingly efficient. Let us gain more insight into the key aspects associated with remote sensing and monitoring when it comes to mining.
RMD24 | Debunking the non-endemic revenue myth Marvin Vacquier Droop | First ...BBPMedia1
Marvin neemt je in deze presentatie mee in de voordelen van non-endemic advertising op retail media netwerken. Hij brengt ook de uitdagingen in beeld die de markt op dit moment heeft op het gebied van retail media voor niet-leveranciers.
Retail media wordt gezien als het nieuwe advertising-medium en ook mediabureaus richten massaal retail media-afdelingen op. Merken die niet in de betreffende winkel liggen staan ook nog niet in de rij om op de retail media netwerken te adverteren. Marvin belicht de uitdagingen die er zijn om echt aansluiting te vinden op die markt van non-endemic advertising.
Enterprise Excellence is Inclusive Excellence.pdfKaiNexus
Enterprise excellence and inclusive excellence are closely linked, and real-world challenges have shown that both are essential to the success of any organization. To achieve enterprise excellence, organizations must focus on improving their operations and processes while creating an inclusive environment that engages everyone. In this interactive session, the facilitator will highlight commonly established business practices and how they limit our ability to engage everyone every day. More importantly, though, participants will likely gain increased awareness of what we can do differently to maximize enterprise excellence through deliberate inclusion.
What is Enterprise Excellence?
Enterprise Excellence is a holistic approach that's aimed at achieving world-class performance across all aspects of the organization.
What might I learn?
A way to engage all in creating Inclusive Excellence. Lessons from the US military and their parallels to the story of Harry Potter. How belt systems and CI teams can destroy inclusive practices. How leadership language invites people to the party. There are three things leaders can do to engage everyone every day: maximizing psychological safety to create environments where folks learn, contribute, and challenge the status quo.
Who might benefit? Anyone and everyone leading folks from the shop floor to top floor.
Dr. William Harvey is a seasoned Operations Leader with extensive experience in chemical processing, manufacturing, and operations management. At Michelman, he currently oversees multiple sites, leading teams in strategic planning and coaching/practicing continuous improvement. William is set to start his eighth year of teaching at the University of Cincinnati where he teaches marketing, finance, and management. William holds various certifications in change management, quality, leadership, operational excellence, team building, and DiSC, among others.
Affordable Stationery Printing Services in Jaipur | Navpack n PrintNavpack & Print
Looking for professional printing services in Jaipur? Navpack n Print offers high-quality and affordable stationery printing for all your business needs. Stand out with custom stationery designs and fast turnaround times. Contact us today for a quote!
Premium MEAN Stack Development Solutions for Modern BusinessesSynapseIndia
Stay ahead of the curve with our premium MEAN Stack Development Solutions. Our expert developers utilize MongoDB, Express.js, AngularJS, and Node.js to create modern and responsive web applications. Trust us for cutting-edge solutions that drive your business growth and success.
Know more: https://www.synapseindia.com/technology/mean-stack-development-company.html
Unveiling the Secrets How Does Generative AI Work.pdfSam H
At its core, generative artificial intelligence relies on the concept of generative models, which serve as engines that churn out entirely new data resembling their training data. It is like a sculptor who has studied so many forms found in nature and then uses this knowledge to create sculptures from his imagination that have never been seen before anywhere else. If taken to cyberspace, gans work almost the same way.
Accpac to QuickBooks Conversion Navigating the Transition with Online Account...PaulBryant58
This article provides a comprehensive guide on how to
effectively manage the convert Accpac to QuickBooks , with a particular focus on utilizing online accounting services to streamline the process.
5 Things You Need To Know Before Hiring a Videographer
Exp passive filter (2)
1. OBJECTIVES
1. Plot the gain frequency response of a first-order (one-pole) R-C low-pass filter.
2. Determine the cutoff frequency and roll-off of an R-C first-order (one-pole) low-pass filter.
3. Plot the phase-frequency of a first-order (one-pole) low-pass filter.
4. Determine how the value of R and C affects the cutoff frequency of an R-C low-pass filter.
5. Plot the gain-frequency response of a first-order (one-pole) R-C high pass filter.
6. Determine the cutoff frequency and roll-off of a first-order (one-pole) R-C high pass filter.
7. Plot the phase-frequency response of a first-order (one-pole) high-pass filter.
8. Determine how the value of R and C affects the cutoff frequency of an R-C high pass filter.
2. COMPUTATION
Solution for Step 4
Solution for Step 6
Solution for Question on Step 6
Solution for Question on Step 7
Solution for Step 15
Solution for Step 17
4. DATA SHEET
MATERIALS
One function generator
One dual-trace oscilloscope
Capacitors: 0.02 µF, 0.04µF
Resistors: 1 kΩ, 2 kΩ
THEORY
In electronic communication systems, it is often necessary to separate a specific range of frequencies
from the total frequency spectrum. This is normally accomplished with filters. A filter is a circuit
that passes a specific range of frequencies while rejecting other frequencies. A passive filter
consists of passive circuit elements, such as capacitors, inductors, and resistors. There are four basic
types of filters, low-pass, high-pass, band-pass, and band-stop. A low-pass filter is designed to pass
all frequencies below the cutoff frequency and reject all frequencies above the cutoff frequency. A
high-pass is designed to pass all frequencies above the cutoff frequency and reject all frequencies
below the cutoff frequency. A band-pass filter passes all frequencies within a band of frequencies
and rejects all other frequencies outside the band. A band-stop filter rejects all frequencies within a
band of frequencies and passes all other frequencies outside the band. A band-stop filter rejects all
frequencies within a band of frequencies and passes all other frequencies outside the band. A band-
stop filter is often is often referred to as a notch filter. In this experiment, you will study low-pass
and high-pass filters.
The most common way to describe the frequency response characteristics of a filter is to plot the
filter voltage gain (Vo/Vi) in dB as a function of frequency (f). The frequency at which the output
power gain drops to 50% of the maximum value is called the cutoff frequency (fC). When the output
power gain drops to 50%, the voltage gain drops 3 dB (0.707 of the maximum value). When the
filter dB voltage gain is plotted as a function of frequency on a semi log graph using straight lines to
approximate the actual frequency response, it is called a Bode plot. A bode plot is an ideal plot of
filter frequency response because it assumes that the voltage gain remains constant in the passband
until the cutoff frequency is reached, and then drops in a straight line. The filter network voltage in
dB is calculated from the actual voltage gain (A) using the equation
AdB = 20 log A
where A = Vo/Vi
A low-pass R-C filter is shown in Figure 1-1. At frequencies well below the cut-off frequency, the
capacitive reactance of capacitor C is much higher than the resistance of resistor R, causing the
output voltage to be practically equal to the input voltage (A=1) and constant with the variations in
frequency. At frequencies well above the cut-off frequency, the capacitive reactance of capacitor C
is much lower than the resistance of resistor R and decreases with an increase in frequency, causing
the output voltage to decrease 20 dB per decade increase in frequency. At the cutoff frequency, the
5. capacitive reactance of capacitor C is equal to the resistance of resistor R, causing the output voltage
to be 0.707 times the input voltage (-3dB). The expected cutoff frequency (fC) of the low-pass filter
in Figure 1-1, based on the circuit component value, can be calculated from
XC = R
Solving for fC produces the equation
A high-pass R-C filter is shown in figure 1-2. At frequencies well above the cut-off frequency, the
capacitive reactance of capacitor C is much lower than the resistance of resistor R causing the output
voltage to be practically equal to the input voltage (A=1) and constant with the variations in
frequency. At frequencies well below the cut-off frequency, the capacitive reactance of capacitor C
is much higher than the resistance of resistor R and increases with a decrease in frequency, causing
the output voltage to decrease 20 dB per decade decrease in frequency. At the cutoff frequency, the
capacitive reactance of capacitor C is equal to the resistance of resistor R, causing the output voltage
to be 0.707 times the input voltage (-3dB). The expected cutoff frequency (fC) of the high-pass filter
in Figure 1-2, based on the circuit component value, can be calculated from
Fig 1-1 Low-Pass R-C Filter
When the frequency at the input of a low-pass filter increases above the cutoff frequency, the filter
output drops at a constant rate. When the frequency at the input of a high-pass filter decreases below
the cutoff frequency, the filter output voltage also drops at a constant rate. The constant drop in filter
output voltage per decade increase (x10), or decrease ( 10), in frequency is called roll-off. An ideal
low-pass or high-pass filter would have an instantaneous drop at the cut-off frequency (fC), with full
signal level on one side of the cutoff frequency and no signal level on the other side of the cutoff
frequency. Although the ideal is not achievable, actual filters roll-off at -20dB/decade per pole (R-C
circuit). A one-pole filter has one R-C circuit tuned to the cutoff frequency and rolls off at -
20dB/decade. At two-pole filter has two R-C circuits tuned to the same cutoff frequency and rolls off
6. at -40dB/decade. Each additional pole (R-C circuit) will cause the filter to roll-off an additional -
20dB/decade. Therefore, an R-C filter with more poles (R-C circuits) more closely approaches an
ideal filter.
In a pole filter, as shown the Figure 1-1 and 1-2 the phase (θ) between the input and the output will
change by 90 degrees and over the frequency range and be 45 degrees at the cutoff frequency. In a
two-pole filter, the phase (θ) will change by 180 degrees over the frequency range and be 90 degrees
at the cutoff frequency.
Fig 1-2 High-Pass R-C Filter
PROCEDURE
Low-Pass Filter
Step 1 Open circuit file FIG 1-1. Make sure that the following Bode plotter settings are
selected: Magnitude, Vertical (Log, F=0 dB, I=–40dB), Horizontal (Log, F=1 MHz,
I=100 Hz)
7. Step 2 Run the simulation. Notice that the voltage gain in dB has been plotted between the
frequencies 200 Hz and 1 MHz by the Bode plotter. Sketch the curve plot in the space
provided.
AdB
f
Question: Is the frequency response curve that of a low-pass filter? Explain why.
Answer: Yes. Since capacitive reactance decreases with frequency, the R-C circuit in Fig 1-1
discriminates against high frequencies. In other words, because it is a passive low-pass filter, it is
expected to reject the higher frequencies or frequencies above the cut off frequency.
Step 3 Move the cursor to a flat part of the curve at a frequency of approximately 100 Hz.
Record the voltage gain in dB on the curve plot.
AdB = -0.001 dB
Step 4 Calculate the actual voltage gain (A) from the dB voltage gain (AdB)
A = 0.99988 1
Question: Was the voltage gain on the flat part of the frequency response curve what you expected
for the circuit in Fig 1-1? Explain why.
Answer: Yes, because at frequencies well below the cut-off frequency or at low frequencies, the
output voltage and the input voltage are almost equal making the voltage gain A equal to 1.
Step 5 Move the cursor as close as possible to a point on the curve that is 3dB down from the
dB at 100 Hz. Record the frequency (cut-off frequency, fC) on the curve plot.
fC (measured) = 7.935 kHz
Step 6 Calculate the expected cutoff frequency (fC) based on the circuit component values in
Figure 1-1.
fC (computed) = 7.958 kHz
8. Question: How did the calculated value for the cutoff frequency compare with the measured value
recorded on the curve plot?
Answer: The computed and measured values of the cut-off frequency are almost equal. Their
percentage difference is only 0.29%.
Step 7 Move the cursor to a point on the curve that is as close as possible to ten times f C.
Record the dB gain and frequency (f2) on the curve plot.
AdB = -20.108 dB
Question: How much did the dB gain decrease for a one decade increase (x10) in frequency? Was it
what you expected for a single-pole (single R-C) low-pass filter?
Answer: The output voltage decreases 17.11 dB per decade increase in frequency. Yes, because at
well above frequency the output voltage decreases 20dB/decade increase in frequency, therefore it
is expected that the frequencies above the cutoff frequency (but not at well above frequency) have
voltage outputs almost decrease 20dB/decade increase in frequency.
Step 8 Click “Phase” on the Bode plotter to plot the phase curve. Make sure that the vertical
axis initial value (1) is -90 and the final value (F) is 0. Run the simulation again. You
are looking at the phase difference (θ) between the filter input and output as a
function of frequency (f). Sketch the curve plot in the space provided.
θ
f
Step 9 Move the cursor to approximately 100 Hz and 1 MHz and record the phase (θ) in
degrees on the curve plot for each frequency (f). Next, move the cursor as close as
possible on the curve to the cutoff frequency (fC) and phase (θ) on the curve plot.
at 100 Hz: θ = –0.72o
at 1MHz: θ = –89.544o
at fC(7.935 kHz): θ = –44.917o
9. Question: Was the phase at the cutoff frequency what you expected for a singles-pole (single R-C)
low-pass filter?
Answer: Yes, It was what I expected; the input and the output change 88.824 degrees 90
degrees on the frequency range and 44.917 degrees 45 degrees.
Did the phase change with frequency? Is this expected for an R-C low-pass filter?
Answer: Yes, the phase changes. Yes in R-C low pass filter the phase between the input and
output changes.
Step 10 Change the value of resistor R to 2 kΩ in Fig 1-1. Click “Magnitude” on the Bode
plotter. Run the simulation. Measure the cutoff frequency (fC) and record your
answer.
fC = 4.049 kHz
Question: Did the cutoff frequency changes? Did the dB per decade roll-off changes? Explain.
Answer: Yes, the cut-off frequency changes. However, the dB per decade roll-off still the same.
For any value of resistance of resistor R, the first order or single pole’s power roll-off will always
approach 20 dB per decade in the limit of high frequency.
Step 11 Change the value of capacitor C is 0.04 µF in Figure 1-1. Run the simulation.
Measure the new cutoff frequency (fC) and record your answer.
fC = 4.049 kHz
Question: Did the cutoff frequency change? Did the dB per decade roll-off change? Explain.
Answer: Yes, compare to Fig1-1 the cut-off frequency changes. However, the dB per decade roll-
off still the same. Just like what I explained earlier, for any value of capacitive reactance of
capacitor C, the first order (single pole) power roll-off will always approach 20 dB per decade in
the limit of high frequency.
10. High-Pass Filter
Step 12 Open circuit file FIG 1-2. Make sure that the following Bode plotter settings are
selected: Magnitude, Vertical (Log, F=0 dB, I=–40dB), Horizontal (Log, F=1 MHz,
I=100 Hz)
Step 13 Run the simulation. Notice that the gain in dB has been plotted between the
frequencies of 100Hz and 1 MHz by the Bode plotter. Sketch the curve plot in the
space provided.
AdB
f
Question: Is the frequency response curve that of a high-pass filter? Explain why.
Answer: Yes, capacitive reactance decreases with frequency, the RC circuit in Fig 1-2
discriminates against low frequencies. It passes all the frequencies above the cutoff frequency
while blocking or rejecting the frequencies below the cutoff frequency.
Step 14 Move the cursor to a flat part of the curve at a frequency of approximately 1 MHz
Record the voltage gain in dB on the curve plot.
AdB = 0 dB
Step 15 Calculate the actual voltage gain (A) from the dB voltage gain (AdB).
A=1
Question: Was the voltage gain on the flat part of the frequency response curve what you expected
for the circuit in Figure 1-2? Explain why.
Answer: Yes, because at frequencies well above the cut-off frequency, the output voltage and the
input voltage are equal therefore the voltage gain A equals 1.
Step 16 Move the cursor as close as possible to the point on the curve that is 3dB down from
the dB gain at 1MHz. Record the frequency (cutoff frequency, fC) on the curve plot.
fC = 7.935 kHz
11. Step 17 Calculate the expected cut of frequency (fC) based on the circuit component value in
Figure 1-2
fC = 7.958 kHz
Question: How did the calculated value of the cutoff frequency compare with the measured value
recorded on the curve plot?
Answer: The values of computed and the measured cutoff frequency are almost equal having a
percentage difference of 0.29%.
Step 18 Move the cursor to a point on the curve that is as close as possible to one-tenth fC.
Record the dB gain and frequency (f2) on the curve plot.
AdB = -20.159 dB
Question: How much did the dB gain decrease for a one-decade decrease ( ) in frequency? Was it
what you expected for a single-pole (single R-C) high-pass filter?
Answer: The output voltage decreases 18.161 dB per decrease in frequency. Yes, it is expected that
the frequencies below the cutoff frequency have voltage outputs almost decrease
20dB/decade decrease in frequency.
Step 19 Click “Phase” on the Bode plotter to plot the phase curve. Make sure that the vertical
axis initial value (I) is 0o and the final value (f) is 90o. Run the simulation again. You
are looking at the phase difference (θ) between the filter input and output as a
function of frequency (f). Sketch the curve plot in the space provided
θ
f
12. Step 20 Move the cursor to approximately 100 Hz and 1 MHz and record the phase (θ) in
degrees on the curve plot for each frequency (f). Next, move the cursor as close as
possible on the curve to the cutoff frequency (fC). Record the frequency (fC) and
phase (θ).
at 100 Hz: θ = 89.28
at 1MHz: θ = 0.456o
at fC(7.935 kHz): θ = 44.738o
Question: Was the phase at the cutoff frequency (fC) what you expected for a single-pole (single R-
C) high pass filter?
Yes, it was what I expected; the input and the output change 89.824 degrees 90 degrees on the
frequency range and 44.738 degrees 45 degrees.
Did the phase change with frequency? Is this expected for an R-C high pass filter?
Answer: Yes, the phase changes. Yes in R-C low pass filter the phase between the input and
output changes.
Step 21 Change the value of resistor R to 2 kΩ in Figure 1-2. Click “Magnitude” on the Bode
plotter. Run the simulation. Measure the cutoff frequency (fC) and record your
answer.
fC = 4.049 kHz
Question: Did the cutoff frequency change? Did the dB per decade roll-off change? Explain.
Answer: Yes, the cut-off frequency changes. Meanwhile, the roll-off did not change. For any
value of resistance of resistor R, the first order (single pole) dB per decade roll-off will always
approach 20 dB per decade in the limit of low frequency.
Step 22 Change the value of the capacitor C to 0.04µF in Figure 1-2. Run the simulation/
measure the cutoff frequency (fC) and record you answer.
fC = 4.049 kHz
Question: Did the cutoff frequency change? Did the dB per decade roll-off change? Explain.
Answer: Yes, compare to Figure 1-2 the cutoff frequency changes. Meanwhile, the roll-off did not
change. For any value of capacitive reactance of capacitor C, the first order (single pole) power
roll-off will always approach 20 dB per decade in the limit of low frequency.
13. CONCLUSION
After performing the experiment I concluded that the cutoff frequency is the basis if the filter will
pass a frequency. In R-C one-pole low-pass filter is a filter that passes low-frequency signals but
reduces the amplitude of signals with frequencies higher than the cutoff frequency. On the other
hand, the high-pass filter reduces the amplitude of signals with frequencies lower than the cut-off
frequency and passes all the frequencies higher than the cutoff frequency.
Moreover, I observe that the voltage gain of low-pass filter at well below the cutoff frequency (fC) is
almost equal to 1, while the voltage gain in high-pass filter becomes 1 if it is well above the fC.
I also took notice in low-pass filter that at well above fC (1 MHz) the dB per decade roll-off
decreases by 20 dB per decade increase in frequency; yet my answer in Step 7 Question is 17.11 dB
per decade decrease in frequency. It is because there is no 79.35 kHz on the Bode Plotter. The Bode
Plotter already had assigned values so I only move the cursor as close as possible to 79.35 kHz.
Anyway, the output voltages decrease 20 dB per decade increase in frequency at frequencies above
the cut-off frequency. Meanwhile, in high-pass filter the frequencies below fC, the output voltage
decrease 20 dB/decade decrease in frequency.
Furthermore, the phase between the input and the output changes approximately equal to 90 degrees
over the frequency range, and approximately equal to 45 degrees at the cutoff frequency.
Lastly, the value of the components affects the value of the cutoff frequency. As the capacitance or
resistance increases, the cutoff frequency decreases. Therefore the resistance and the capacitance are
inversely proportional to the cutoff frequency. However, roll-off frequency was not affected by the
value of the resistance and the capacitance.