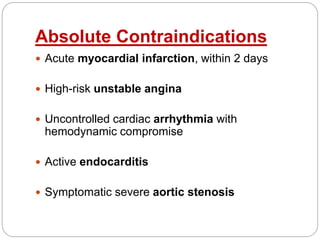
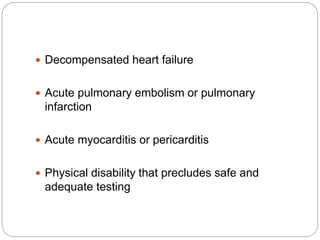
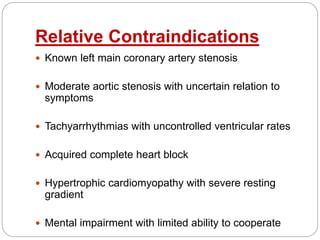
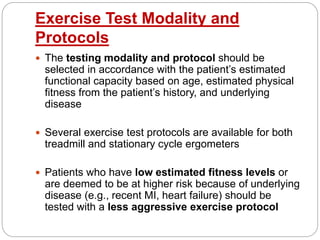
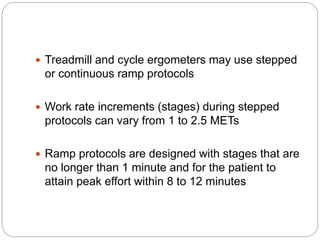
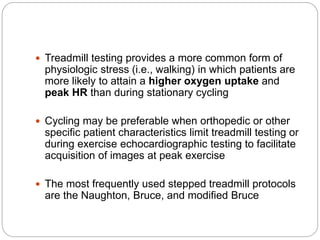
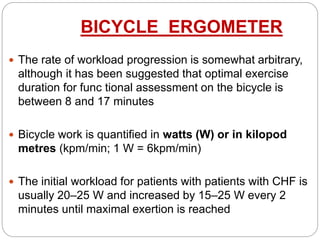
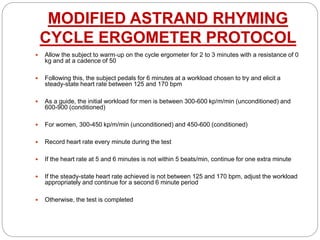
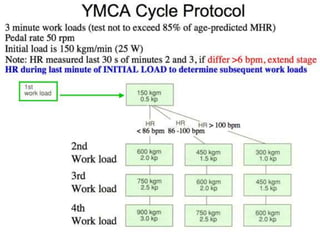
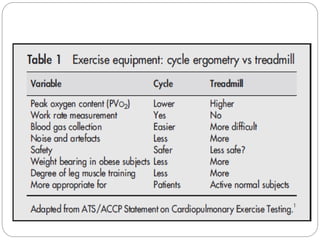
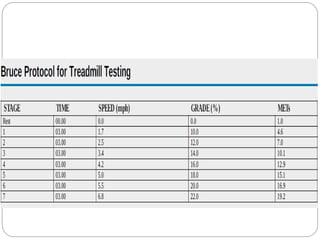
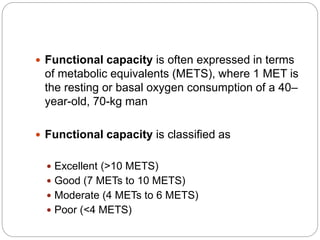
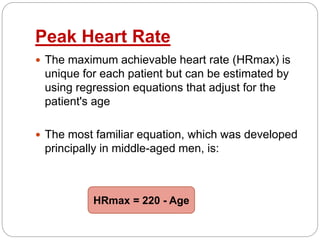
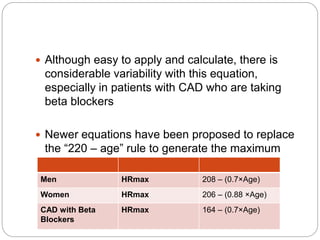
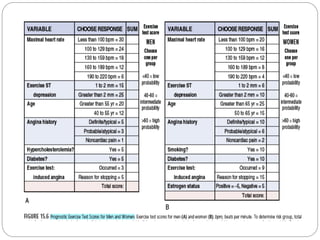
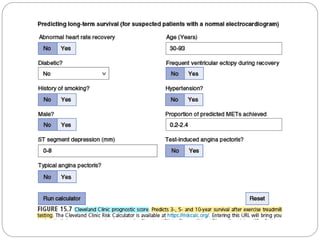
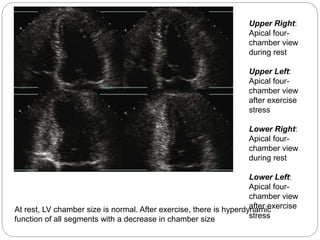
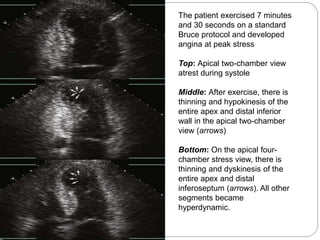
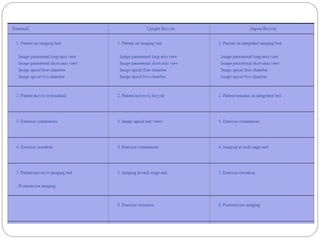
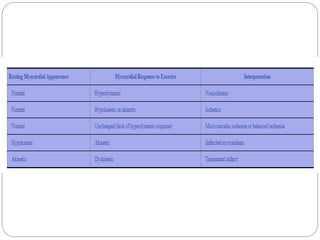
The testing modality and protocol should be selected in accordance with the patient’s estimated functional capacity based on age, estimated physical fitness from the patient’s history, and underlying disease
Several exercise test protocols are available for both treadmill and stationary cycle ergometers
Patients who have low estimated fitness levels or are deemed to be at higher risk because of underlying disease (e.g., recent MI, heart failure) should be tested with a less aggressive exercise protocol
Treadmill and cycle ergometers may use stepped or continuous ramp protocols
Work rate increments (stages) during stepped protocols can vary from 1 to 2.5 METs
Ramp protocols are designed with stages that are no longer than 1 minute and for the patient to attain peak effort within 8 to 12 minutes
4. Decompensated heart failure
Acute pulmonary embolism or pulmonary
infarction
Acute myocarditis or pericarditis
Physical disability that precludes safe and
adequate testing
5. Relative Contraindications
Known left main coronary artery stenosis
Moderate aortic stenosis with uncertain relation to
symptoms
Tachyarrhythmias with uncontrolled ventricular rates
Acquired complete heart block
Hypertrophic cardiomyopathy with severe resting
gradient
Mental impairment with limited ability to cooperate
6. Exercise Test Modality and
Protocols
The testing modality and protocol should be
selected in accordance with the patient’s estimated
functional capacity based on age, estimated physical
fitness from the patient’s history, and underlying
disease
Several exercise test protocols are available for both
treadmill and stationary cycle ergometers
Patients who have low estimated fitness levels or
are deemed to be at higher risk because of underlying
disease (e.g., recent MI, heart failure) should be
tested with a less aggressive exercise protocol
7. Treadmill and cycle ergometers may use stepped
or continuous ramp protocols
Work rate increments (stages) during stepped
protocols can vary from 1 to 2.5 METs
Ramp protocols are designed with stages that are
no longer than 1 minute and for the patient to
attain peak effort within 8 to 12 minutes
9. Treadmill testing provides a more common form of
physiologic stress (i.e., walking) in which patients are
more likely to attain a higher oxygen uptake and
peak HR than during stationary cycling
Cycling may be preferable when orthopedic or other
specific patient characteristics limit treadmill testing or
during exercise echocardiographic testing to facilitate
acquisition of images at peak exercise
The most frequently used stepped treadmill protocols
are the Naughton, Bruce, and modified Bruce
10. BRUCE SUBMAXIMAL
TREADMILL TEST
The test is administered in three-minute stages
until the client achieves 85% of his or her age-
predicted maximum heart rate (MHR)
In a clinical setting, the test is typically performed
to maximal effort, to evaluate both fitness and
cardiac function
Given the degree of difficulty with this test, it is
generally not appropriate for deconditioned
individuals or the elderly
11. Pre-test procedure
Measure pre-exercise HR, sitting and standing, and record the
values on a testing form or data sheet
Estimate the submaximal target exercise HR
Each of the stages is three minutes in length with a goal to
achieve steady-state HR (HRss) at each workload
As long as HRss has been achieved, the speed and incline will
increase at the end of each three-minute interval
12. Secure the blood pressure (BP) cuff on the
client’s arm (tape the cuff in place with medical
tape to avoid slippage)
Allow the client to walk on the treadmill to warm
up and get used to the apparatus (≤1.7 mph)
He or she should avoid holding the handrails. If
the client is too unstable without holding onto the
rails, consider using another testing modality
The results will not be accurate if the client must hold
on to the handrails the entire time
13.
14. Modified Bruce Protocol
The modified Bruce protocol employs 2 initial low level 3-
minutes stages at a speed of 1.7 mph and grades 0 % and
5%, respectively, and then continues into the full Bruce
protocol
15. NAUGHTON PROTOCOL
The Naughton protocol is a sub-maximal
exercise test designed to keep you in a heart
rate zone that is lower than your maximum
heart rate
Your heart rate gradually increases throughout
the test with an endpoint target zone that is 80 to
90 percent of your maximum heart rate
16. NAUGHTON PROTOCOL
The Naughton protocol is less intense than other
testing procedures, such as the more popular
Bruce protocol
The test has a more gradual increase in
intensity and uses lower speeds
For this reason, the Naughton protocol is used for
diseased populations, those at high coronary risk
17.
18. NAUGHTON PROTOCOL
The Naughton protocol starts with a 2 minute warm-
up
The speed is set to 1 mph and the incline is set to 0
After the warm-up, the speed is set at 2 mph and
does not change for the remainder of the test
The test consists of six, 2 minute intervals
The grade starts at 0 for the first interval, and
increases by 3.5 percent every 2 minutes
20. During the Exercise Period
12-lead ECG during last minute of each stage, or
at least every 3 min
Blood pressure during last minute of each stage,
or at least every 3 min
Symptom rating scales as appropriate for the
test indication and lab protocol
21. During the Recovery Period
Monitoring for a minimum of six minutes after
exercise in sitting or supine position, or until near
baseline heart rate, blood pressure, ECG and
symptom measures are reached
A period of active cool-down may be included in the
recovery period, particularly following high levels of
exercise in order to minimize the post-exercise
hypotensive effects of venous pooling in the lower
extremities
12-lead ECG every minute
22. Heart rate and blood pressure immediately after
exercise, then every one or two minutes
thereafter until near-baseline measures are
reached.
Symptomatic ratings every minute as long as they
persist after exercise
Patients should be observed until all symptoms
have resolved or returned to baseline levels.
23. BICYCLE ERGOMETER
The rate of workload progression is somewhat arbitrary,
although it has been suggested that optimal exercise
duration for func tional assessment on the bicycle is
between 8 and 17 minutes
Bicycle work is quantified in watts (W) or in kilopod
metres (kpm/min; 1 W = 6kpm/min)
The initial workload for patients with patients with CHF is
usually 20–25 W and increased by 15–25 W every 2
minutes until maximal exertion is reached
24. MODIFIED ASTRAND RHYMING
CYCLE ERGOMETER PROTOCOL
Allow the subject to warm‐up on the cycle ergometer for 2 to 3 minutes with a resistance of 0
kg and at a cadence of 50
Following this, the subject pedals for 6 minutes at a workload chosen to try and elicit a
steady-state heart rate between 125 and 170 bpm
As a guide, the initial workload for men is between 300-600 kp/m/min (unconditioned) and
600-900 (conditioned)
For women, 300-450 kp/m/min (unconditioned) and 450-600 (conditioned)
Record heart rate every minute during the test
If the heart rate at 5 and 6 minutes is not within 5 beats/min, continue for one extra minute
If the steady-state heart rate achieved is not between 125 and 170 bpm, adjust the workload
appropriately and continue for a second 6 minute period
Otherwise, the test is completed
28. SIX-MINUTE WALK TEST
The 6-minute walk test can be used as a
surrogate measure of exercise capacity when
standard treadmill or cycle testing is not available
Distance walked is the primary outcome of the
test
It is not useful in the objective determination of
myocardial ischemia and is best used in a serial
manner to evaluate changes in exercise capacity
and the response to interventions that may affect
exercise capacity over time
29. Testing Site
The Six Minute Walk Test Protocol should be performed
indoors, along a long, flat, straight, enclosed corridor with a
hard surface that is seldom traveled
The walking course must be 30 m in length
A 100-ft (30.4 m) hallway is required and its length should
be marked every 3 m
The turnaround points should be marked with a cone (such
as an orange traffic cone)
A starting line, which marks the beginning and end of each
60-m lap, should be marked on the floor using brightly
colored tape
30.
31. Measurements
Assemble all necessary equipment (lap counter,
timer, clipboard, worksheet) and move to the
starting point
Set the lap counter to zero and the timer to 6 min.
Position the patient at the starting line
As soon as the patient starts to walk, start the
timer
Do not talk to anyone during the walk
32. Use an even tone of voice when using the standard
phrases of encouragement
Each time the patient returns to the starting line, click
the lap counter once (or mark the lap on the
worksheet)
At the end of 6 min, tell the patient to stop walking,
and measure the total distance traveled (meters)
Heart rate, blood pressure and oxygen saturation
should be measured at rest and at the end of exercise
as well
The main outcome of this test is total distance
traveled
33.
34. Functional Capacity
Functional capacity is a strong predictor of
mortality and nonfatal cardiovascular outcomes in
both men and women with and without CAD
Even though exercise capacity is most accurately
measured by CPX, a reasonable estimate can be
obtained from treadmill testing alone
35. The best methods for estimating predicted METs are
the following simple regression equations
Men : Predicted METs = 18 − (0 . 15 × Age)
Women : Predicted METs = 14 . 7 − (0 . 13 × Age)
The reported exercise time can be translated into
METs or METs based on the exercise test protocol
The reported METs can then be expressed as a
percentage of the predicted METs
36.
37. Functional capacity is often expressed in terms
of metabolic equivalents (METS), where 1 MET is
the resting or basal oxygen consumption of a 40–
year-old, 70-kg man
Functional capacity is classified as
Excellent (>10 METS)
Good (7 METs to 10 METS)
Moderate (4 METs to 6 METS)
Poor (<4 METS)
38. Peak Heart Rate
The maximum achievable heart rate (HRmax) is
unique for each patient but can be estimated by
using regression equations that adjust for the
patient's age
The most familiar equation, which was developed
principally in middle-aged men, is:
HRmax = 220 - Age
39. Although easy to apply and calculate, there is
considerable variability with this equation,
especially in patients with CAD who are taking
beta blockers
Newer equations have been proposed to replace
the “220 – age” rule to generate the maximum
age-predicted heart rate (MPHR)
Men HRmax 208 – (0.7×Age)
Women HRmax 206 – (0.88 ×Age)
CAD with Beta
Blockers
HRmax 164 – (0.7×Age)
40. Chronotropic Incompetence
The inability of the heart to increase its rate to
meet the demand placed on it is termed
chronotropic incompetence
It is considered an independent predictor
(including the well-established Duke treadmill
score) of cardiac or all-cause mortality
41. An inadequate study is defined by failure to
achieve a predefined goal, such as 85% of
MPHR
If a patient without known CAD has an
inadequate study, the term nondiagnostic study
is often applied
In the presence of any other diagnostic
endpoints, such as 2-mm or greater ST-segment
depression, exercise-induced hypotension, or
exercise-induced anginal chest pain, the heart
42. CHRONOTROPIC INDEX
(HR Max – HR Rest) ×
100
(220 – Age – HR Rest)
• Failure to achieve a chronotropic index higher than 80%
defines the presence of chronotropic incompetence
• In patients taking nontrivial doses of beta blockers who
are compliant with their medication, a value lower than
62% is considered chronotropic incompetence
• Criteria for assessing chronotropic incompetence in
patients with atrial fibrillation (AF) have not been
established
44. Heart Rate Recovery
Abnormal heart rate recovery (HRR) has been
defined by many methods, but the most
commonly accepted include:
Less than 12 beats/min after 1 minute with
postexercise cool down
Less than 18 beats/min after 1 minute with
immediate cessation of movement into either the
supine or sitting position
Less than 22 beats/min after 2 minutes
45. Blood Pressure Responses
Exercise BP responses, as with those for HR, reflect the
balance between sympathetic and parasympathetic
influences
Systolic blood pressure
Pulse pressure (difference between systolic and diastolic BP)
HR-BP product (also called the double product), and
Double-product reserve (change in double product from peak
to rest) all increase steadily as workload increases
Diastolic BP increases only minimally or may fall
In most normal individuals, systolic BP will increase to
higher than 140 mm Hg and the double product to higher
than 20,000
46. Hypertensive Systolic Pressure
Response
This response is usually defined as greater than
210 mm Hg in men and greater than 190 mm Hg
in women
Even though these exercise responses are
considered abnormal, they are not generally
reasons to terminate exercise
Such responses may be indicative of the future
development of hypertension or adverse cardiac
events
47. Exercise-Induced Systolic
Hypotension
This has been variably defined but most frequently as
systolic pressure during exercise falling below
resting systolic pressure
Another definition is a 20 mm Hg fall after an initial
rise
Either of these definitions would be an absolute
reason to terminate the exercise test
The former definition is more predictive of a poor
prognosis and is usually related to severe multivessel
CAD with LV dysfunction, especially when noted with
other signs of ischemia, such as ST depression or
angina at a low workload
48. Pseudo–Exercise-Induced
Hypotension
This response occurs in patients who are anxious
about the exercise study and begin exercise with a
somewhat elevated systolic pressure
As exercise proceeds in the first stage, this elevated
BP usually settles down or “falls” toward its customary
resting level
As exercise continues, continued observation reveals
a gradual upward trend in BP
Considerable judgment needs to be used when
interpreting this response
49. Low Maximum Systolic Pressure
Peak
This is defined as a rise to less than 140 mm Hg
or a lower than 10 mm Hg rise overall
After excluding poor exercise effort, this
response is often associated with severe CAD
and worse cardiovascular outcomes in persons
with and without known CAD and warrants further
evaluation
53. ST Depression
1 mm or greater or 0.1 mV or greater of horizontal
or downsloping ST-segment depression in three
consecutive beats
Sensitivity of 68% and specificity of 77%.
54. This assumes that the PQ point (not the TP
segment) is used as the isoelectric reference and
that the point of ST-segment measurement is 60
to 80 milliseconds after the J point
The 60-millisecond post–J point criterion is used
at HR higher than 130 beats/min
This criterion should be added to and not
included with existing resting ST-segment
depression
55. Unlike ST-segment elevation, exercise-induced ST-
segment depression does not localize ischemia to
a precise region or vascular bed
The lateral precordial leads are the best for defining
positive responses. However, the inferior leads can be
helpful in assessing the extent of ischemia when the
lateral leads are abnormal as well
Isolated inferior ST depression is frequently falsely
abnormal because of the influence of atrial
repolarization in these leads
56. ST ELEVATION
1 mm or greater or 0.1 mV of ST-segment elevation above the
PQ point at 60 milliseconds after the J point in three consecutive
beats
The J point may or may not be elevated as well
Without pathologic Q waves, exercise-induced ST elevation
usually indicates either significant proximal coronary stenosis or
epicardial coronary spasm
ST-segment elevation precisely localizes the transmural
ischemia to a particular vascular region
In contrast, when pathologic Q waves are present, ST-
segment elevation is usually indicative of an LV aneurysm or
significant wall motion change. Ischemia may be involved in this
process, and myocardial perfusion imaging is generally required
to determine this
58. Absolute Indications
ST elevation (>1.0 mm) in leads without Q waves
due to prior MI (other than aVR, aVL, or V1)
Drop in systolic BP of >10 mm Hg, despite an
increase in workload, when accompanied by any
other evidence of ischemia
Moderate to severe angina
Central nervous system symptoms (e.g., ataxia,
dizziness, or near syncope)
59. Signs of poor perfusion (cyanosis or pallor)
Sustained ventricular tachycardia or other
arrhythmia that interferes with normal
maintenance of cardiac output during exercise
Technical difficulties monitoring the ECG or
systolic BP
Patient’s request to stop
60. Relative Indications
Marked ST displacement (horizontal or
downsloping of >2 mm) in a patient with
suspected ischemia
Drop in systolic BP of >10 mm Hg (persistently
below baseline) despite an increase in workload,
in the absence of other evidence of ischemia
Increasing chest pain
Fatigue, shortness of breath, wheezing, leg
cramps, or claudication
61. Arrhythmias other than sustained ventricular
tachycardia, including multifocal ectopy,
ventricular triplets, supraventricular tachycardia,
atrioventricular heart block, or bradyarrhythmias
Exaggerated hypertensive response (systolic
blood pressure >250 mm Hg and/or diastolic
blood pressure >115 mm Hg)
Development of bundle branch block that
cannot be distinguished from ventricular
tachycardia
63. Digitalis Glycosides
That digitalis can have an adverse effect on ST-
segment interpretation is generally common
knowledge
The principal issue has been false-positive results
and reduced specificity
The absence of ST-segment change at rest does not
eliminate the effect occurring during exercise
Sensitivity is not affected by digitalis
Therefore, a negative ST-segment response with
digitalis is still reliable
64. Beta Adrenoreceptor Blockers
Beta blockers clearly reduce the rate-pressure
product in most patients receiving adequate
doses
Evidence indicates that the diagnostic sensitivity
and NPV of exercise testing are adversely
affected
For those without established CAD who are
undergoing a diagnostic-level exercise ECG, beta
blockers should ideally be withheld to allow an
adequate HR response
65. Men HRmax 208 – (0.7×Age)
Women HRmax 206 – (0.88 ×Age)
CAD with Beta
Blockers
HRmax 164 – (0.7×Age)
66. Prognostic Value
The strongest predictor of prognosis derived
from the exercise test is functional capacity
A weaker predictor is ST-segment depression
All other variables, such as the HR achieved,
HRR, BP response, ventricular arrhythmias, and
exercise-induced angina, fall between these two
extremes
This prognostic hierarchy is similar in both men
and women.
67.
68. DUKE’S TREADMILL SCORE
The Duke Treadmill Score (DTS) is a weighted index combining
treadmill exercise time using standard Bruce protocol,
maximum net ST segment deviation (depression or elevation),
and exercise-induced angina
DTS = Exercise time (minutes) - (5 x ST
deviation in mm) - (4 x angina index)
Risk Score
High < -11
Intermedia
te
-11 to +5
Low > +5
Angina Index
0 No Angina
1 Angina
2 Angina leading to stoppage of
test
69.
70.
71. Physiologic Principles of Exercise
Echocardiography
During exercise, increases in myocardial oxygen demand
results in augmented systolic function with increased
myocardial thickening
With a hemodynamically significant coronary stenosis, the
relative disparity in oxygen delivery to the distal coronary
bed cannot meet increases in myocardial oxygen demand
Transient hypoperfusion results in mechanical dysfunction
of affected myocardium
Stress echocardiography is well suited to assess this
ischemic response by visualizing global and regional
myocardial motion, allowing for localization of coronary
lesions, given that coronary artery anatomy and
myocardial distribution are relatively similar among
patients
72. Myocardial ischemia generally progresses in a
defined sequence of events, termed
the ischemic cascade
Ischemia is initiated by regional hypoperfusion of
a distal coronary bed
After resultant metabolic changes within affected
myocardium, alterations in function occur; initially
with abnormalities in myocardial relaxation
(diastolic dysfunction), and subsequently with
systolic dysfunction of affected segments
73.
74. Only in the later stages of ischemia are characteristic
ECG changes, such as ST segment depression, and
frank angina manifest
However, because endocardial myocardial oxygen
demand is higher, only moderate ischemia is needed
to produce visually identifiable contractile dysfunction
With exercise ECG testing, ischemia diagnosis occurs
with onset of angina or ECG changes, occurring in the
later stages of the ischemic cascade , contributing to
acknowledged limitations in diagnostic accuracy for
exercise ECG testing
75. In contrast, stress testing with integrated cardiac
imaging identifies ischemia earlier, at onset of
regional hypoperfusion (nuclear perfusion stress)
or with systolic dysfunction (echocardiography)
With stressor cessation and restoration of
adequate coronary flow, induced abnormalities
typically recover rapidly, but may persist if
ischemia is severe
76. In the absence of a physiologically significant coronary
narrowing, the myocardial response to stress is
augmented systolic function with increased
inward hyperdynamic motion
In the presence of ischemia, myocardial responses include
the following:
Hypokinesis, myocardial thickening with inward motion less
than 5 mm or relatively less than the rest of the myocardium
Akinesis, absence of thickening or inward motion
Dyskinesis, thinned myocardium with paradoxical outward
systolic motion, a passive myocardial response to increased
intraventricular pressure
77. At rest, LV chamber size is normal. After exercise, there is hyperdynamic
function of all segments with a decrease in chamber size
Upper Right:
Apical four-
chamber view
during rest
Upper Left:
Apical four-
chamber view
after exercise
stress
Lower Right:
Apical four-
chamber view
during rest
Lower Left:
Apical four-
chamber view
after exercise
stress
78. The patient exercised 7 minutes
and 30 seconds on a standard
Bruce protocol and developed
angina at peak stress
Top: Apical two-chamber view
atrest during systole
Middle: After exercise, there is
thinning and hypokinesis of the
entire apex and distal inferior
wall in the apical two-chamber
view (arrows)
Bottom: On the apical four-
chamber stress view, there is
thinning and dyskinesis of the
entire apex and distal
inferoseptum (arrows). All other
segments became
hyperdynamic.
83. Patients with symptoms provoked by exercise
testing should be considered symptomatic, even
if the clinical history is equivocal
Exercise-induced angina, excessive dyspnea
early in exercise, dizziness, and syncope are
consistent with symptoms of AS
However, exercise testing is avoided in
symptomatic patients with AS because of a high
risk of complications, including syncope,
ventricular tachycardia, and death
86. LVOT gradients can be dynamic, and maneuvers
performed during a resting TTE to provoke an LVOT
gradient (such as Valsalva) can be variable because
of inconsistencies in instruction and patient effort
Stress echocardiography, representing the most
physiologic form of provocation, can be most helpful
for those patients where the presence or severity of
LVOTO is uncertain after the baseline
echocardiogram
LV outflow gradients in the postprandial state are
higher than when fasting and treatment with beta-
blockers often reduces the severity of exercise-
induced LVOTO
87. Although there are few data comparing treadmill
and bicycle ergometry, both are acceptable
when performed in experienced laboratories
Exercise testing is only useful in older children,
typically >7 to 8 years of age, because young
children are often unable to cooperate with
exercise testing