Download as PDF, PPTX
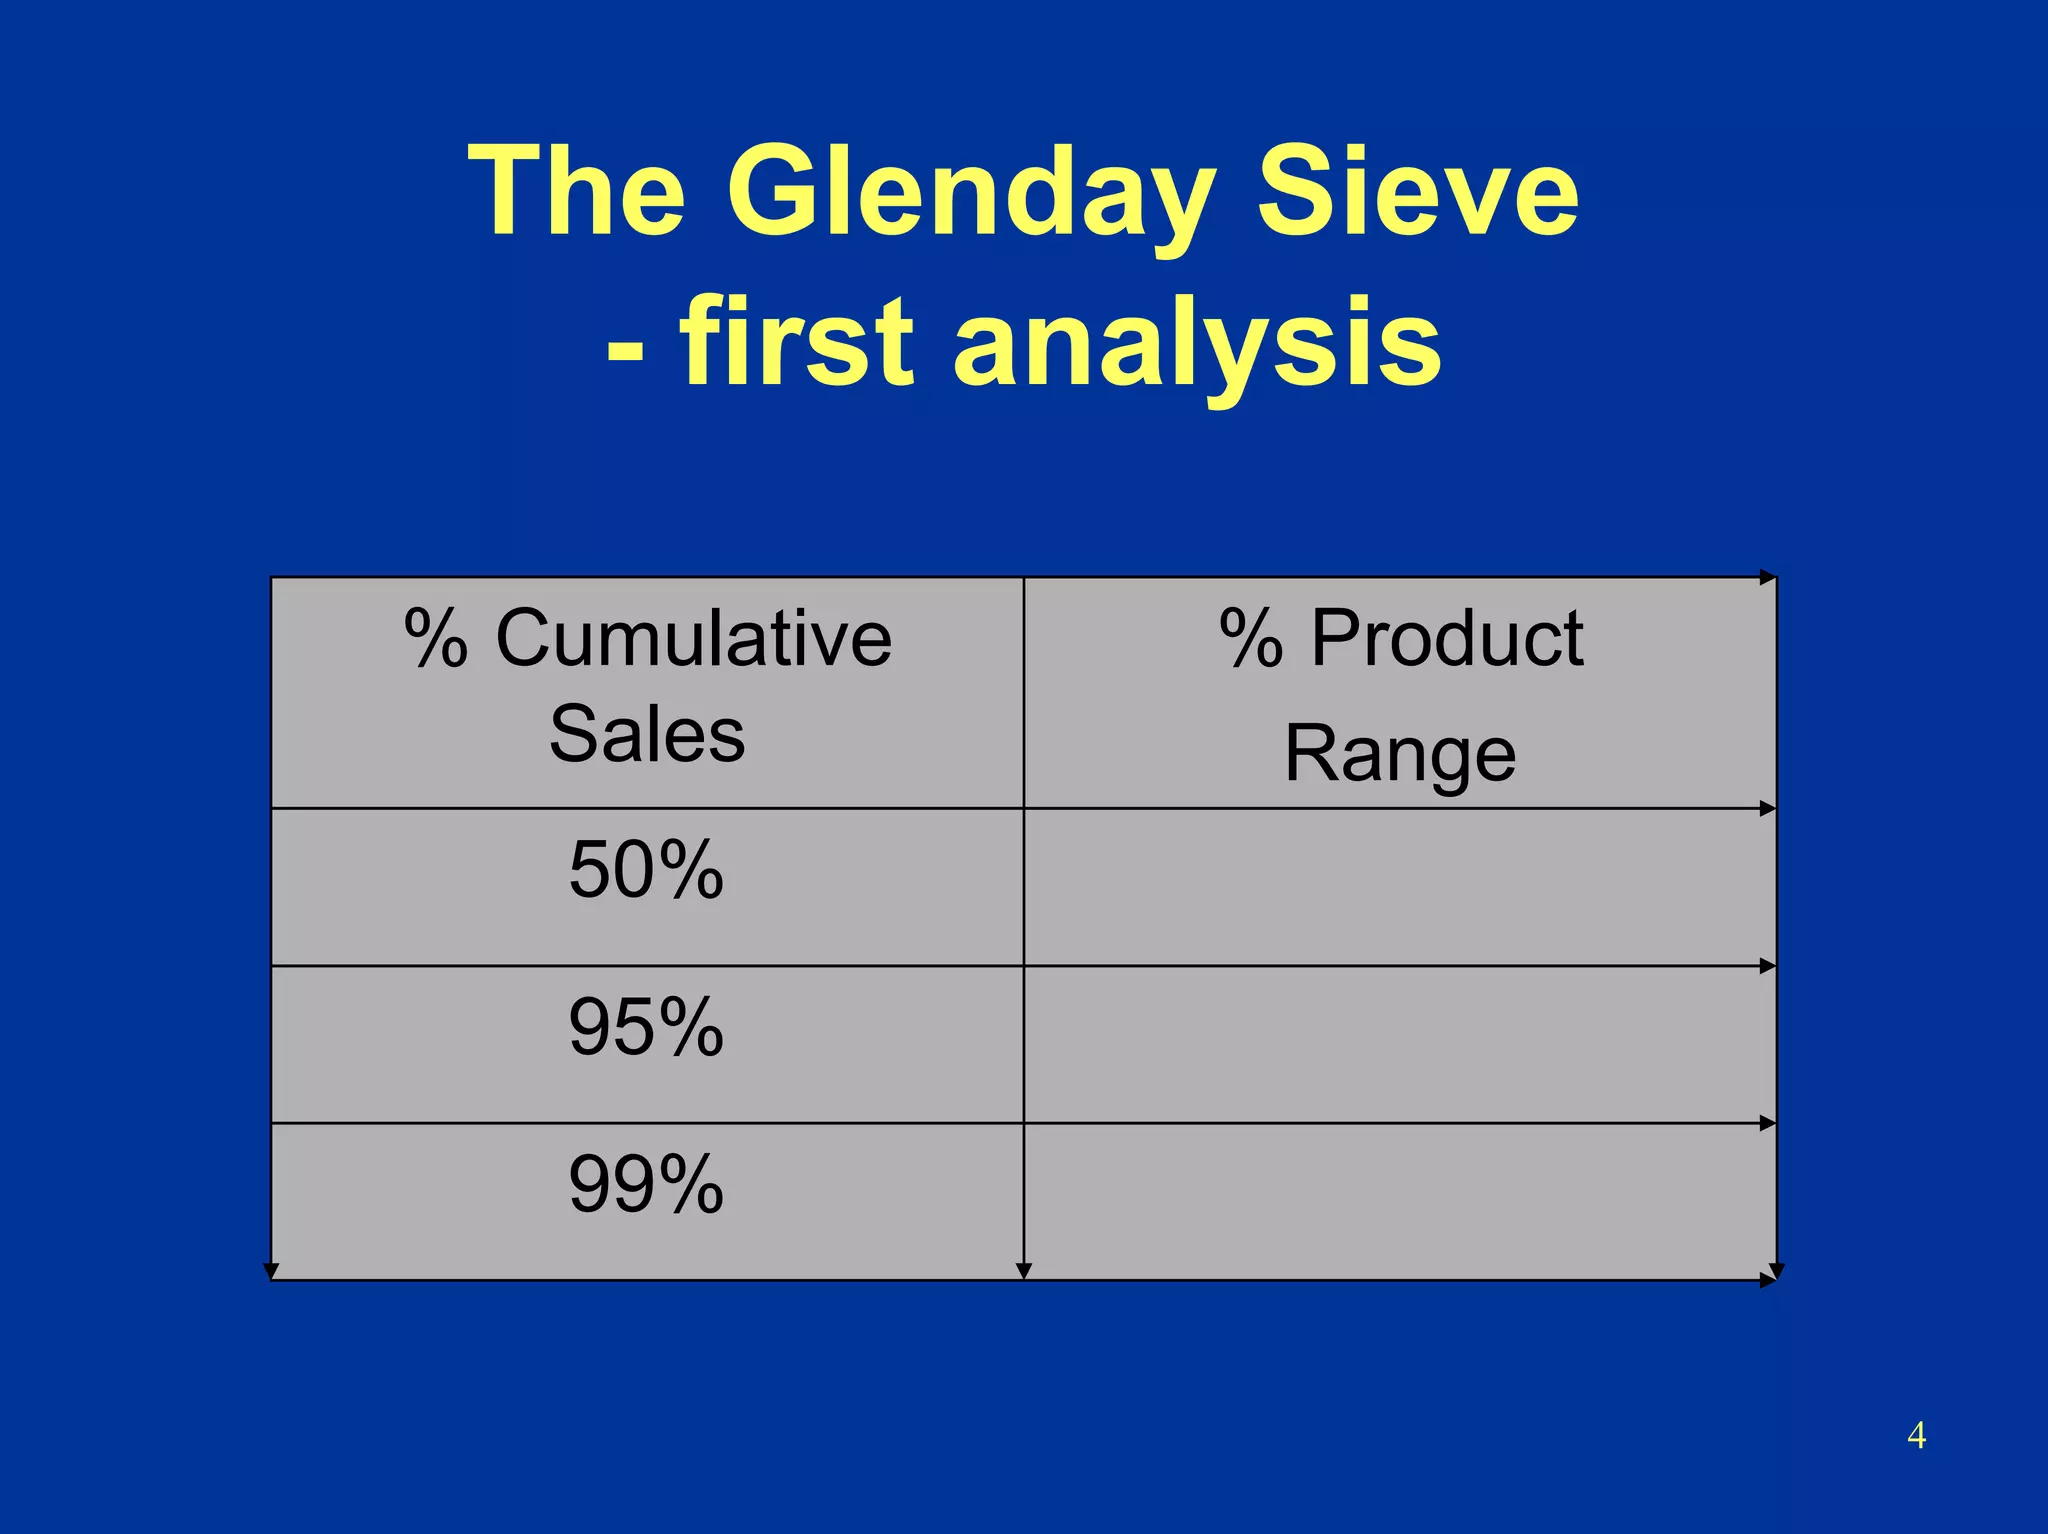
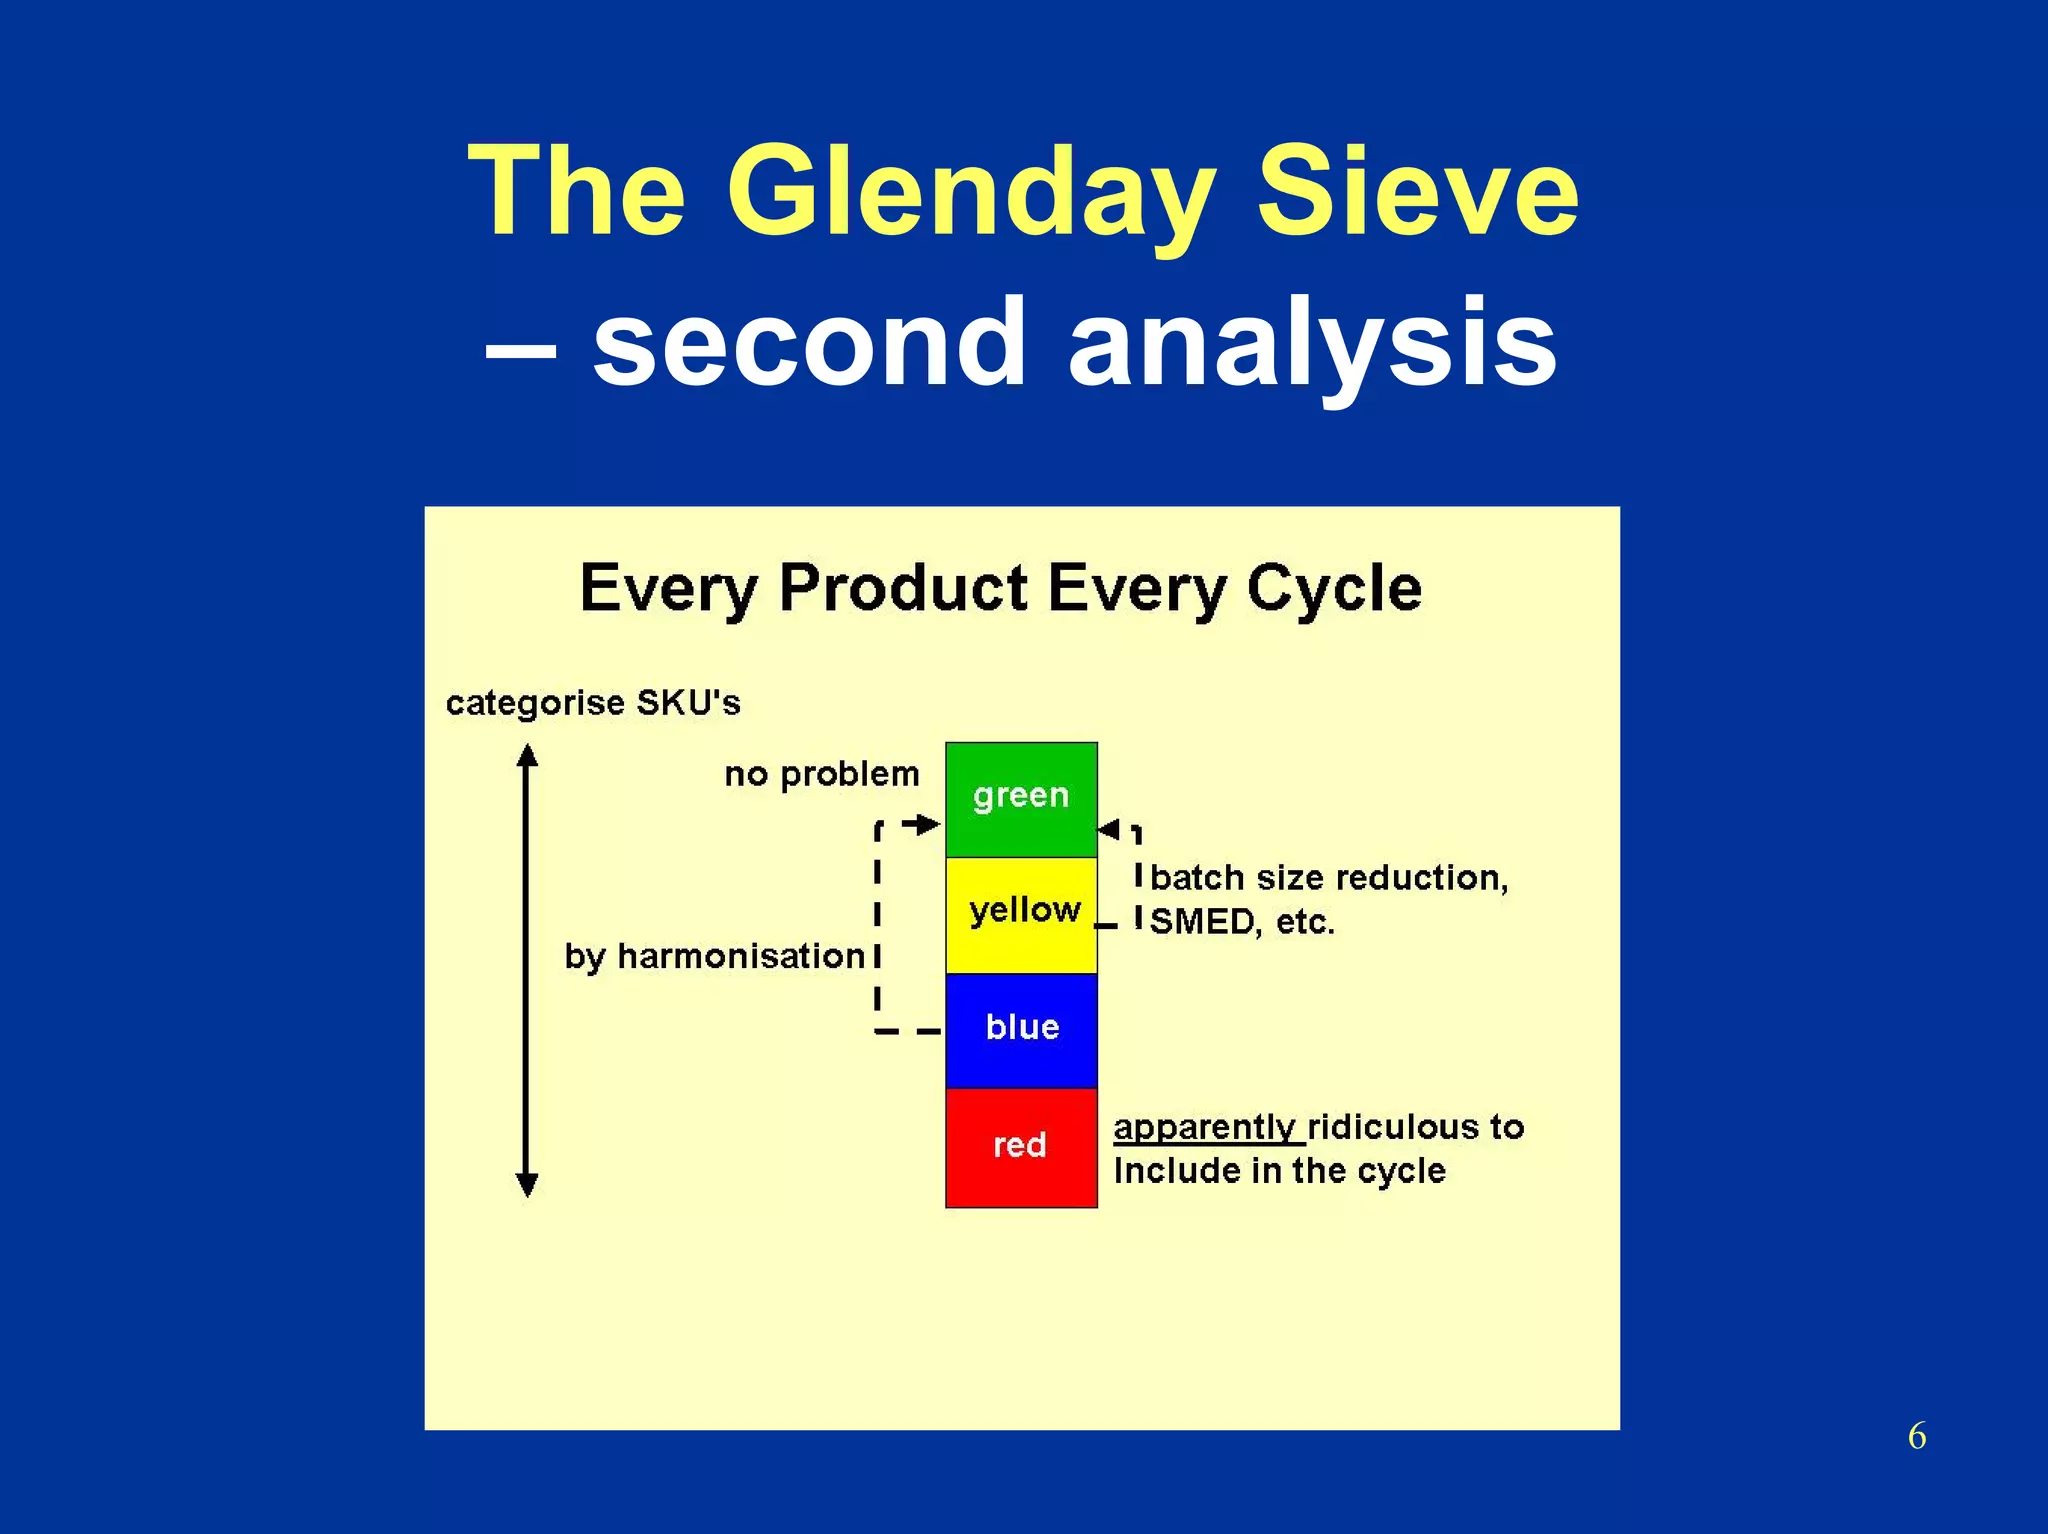
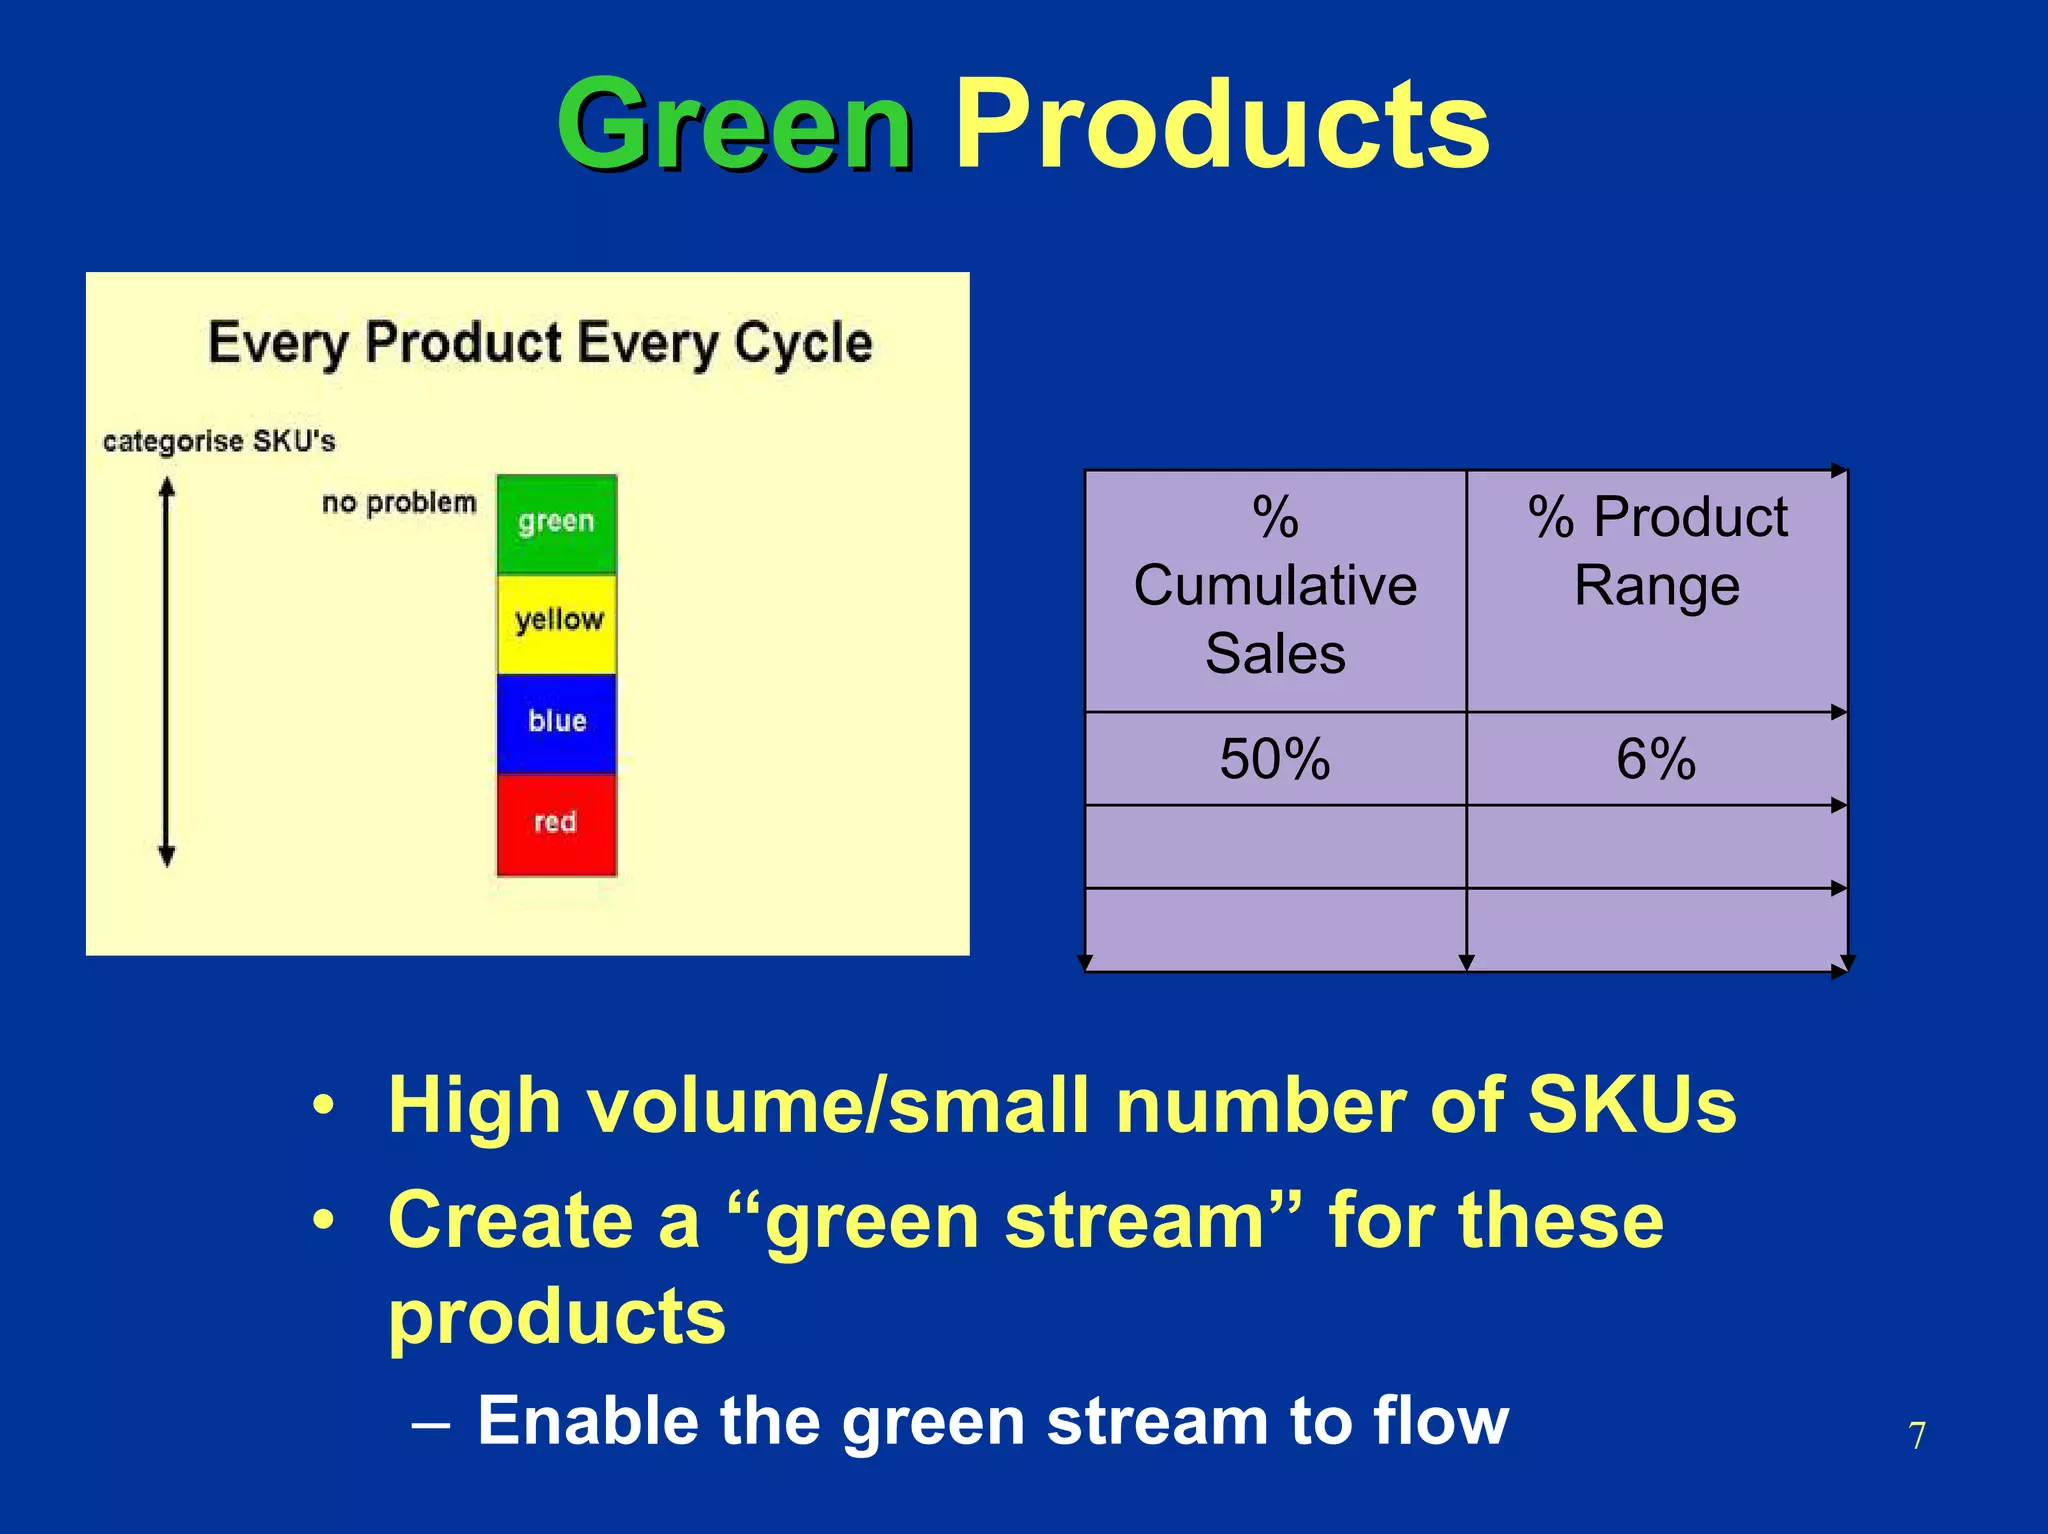

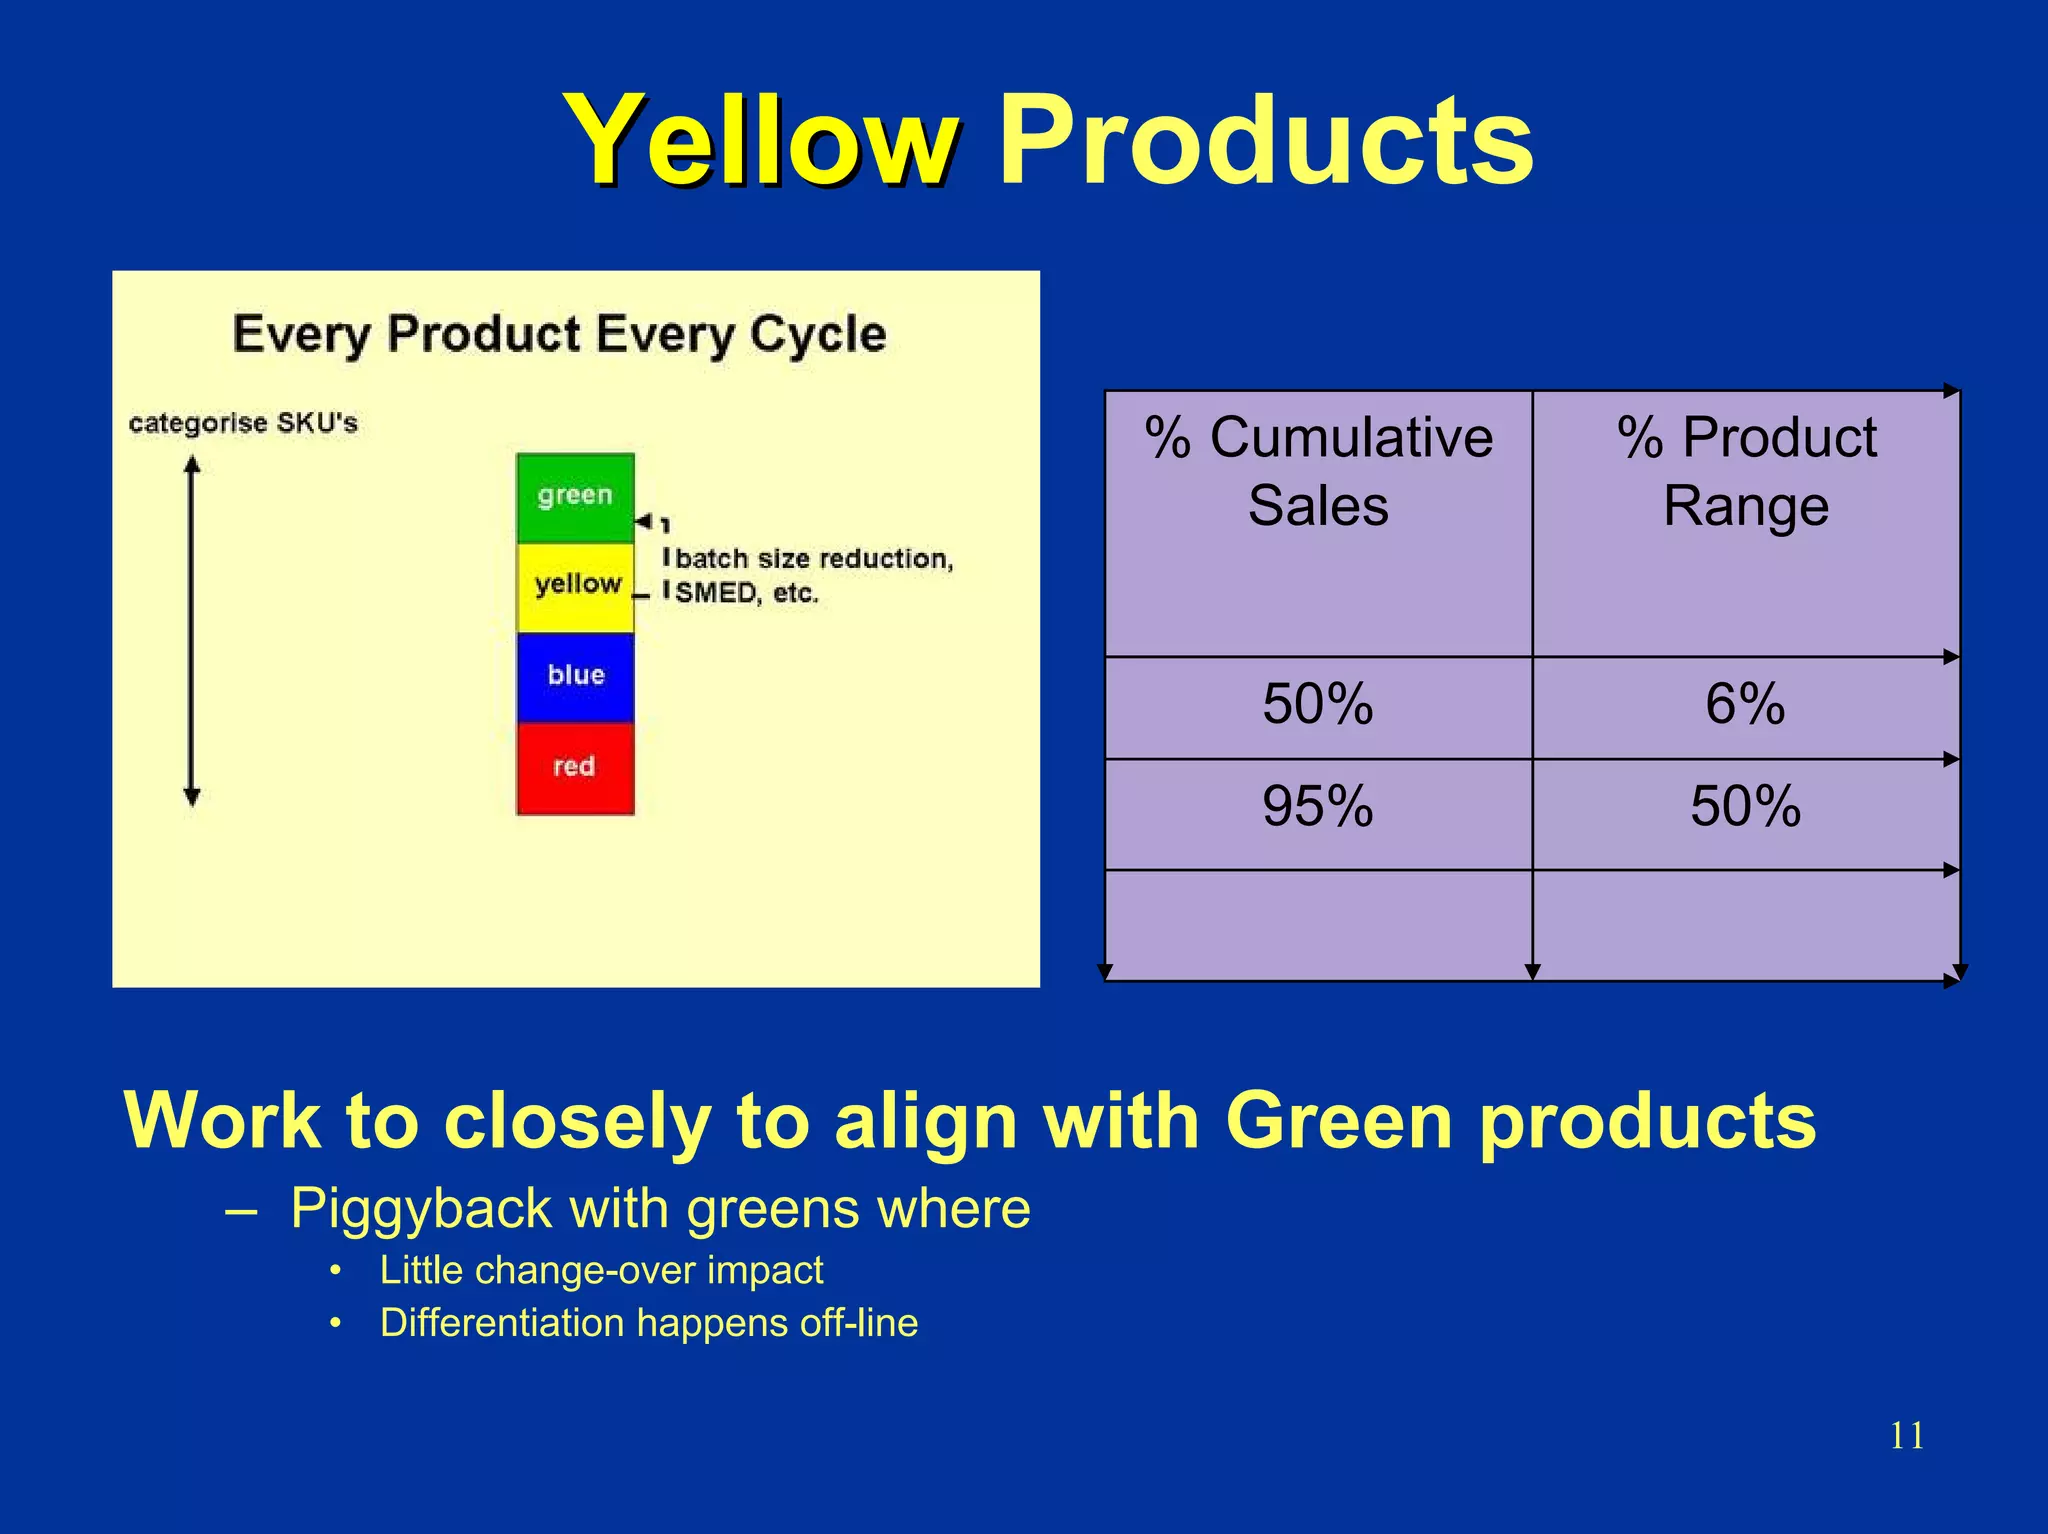
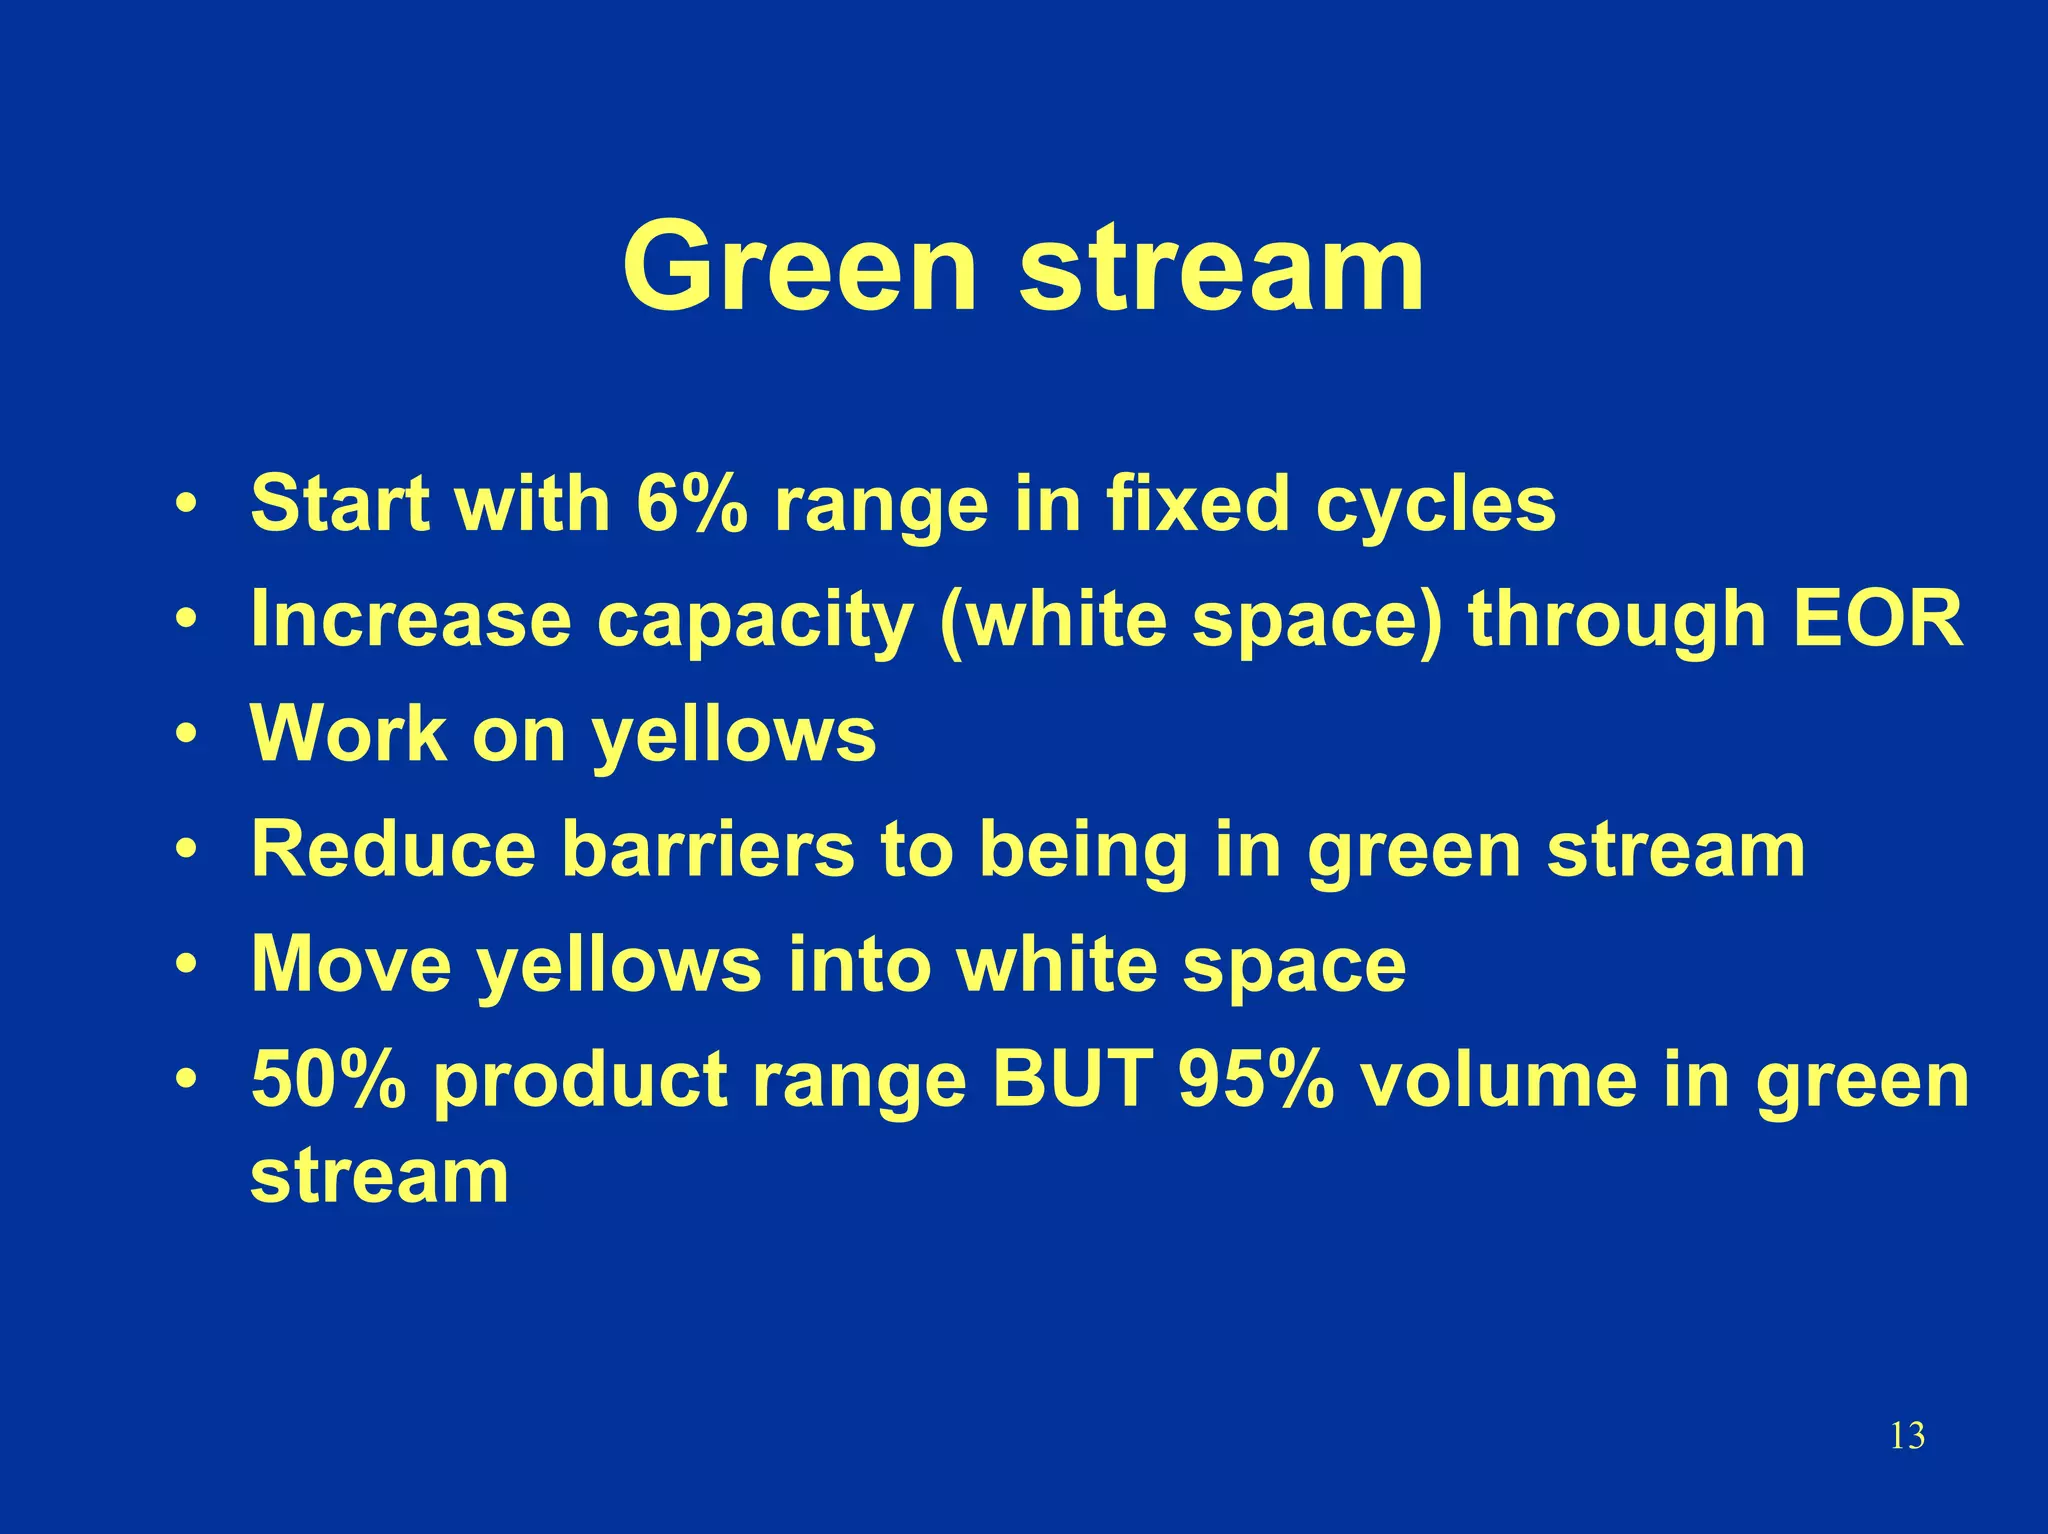
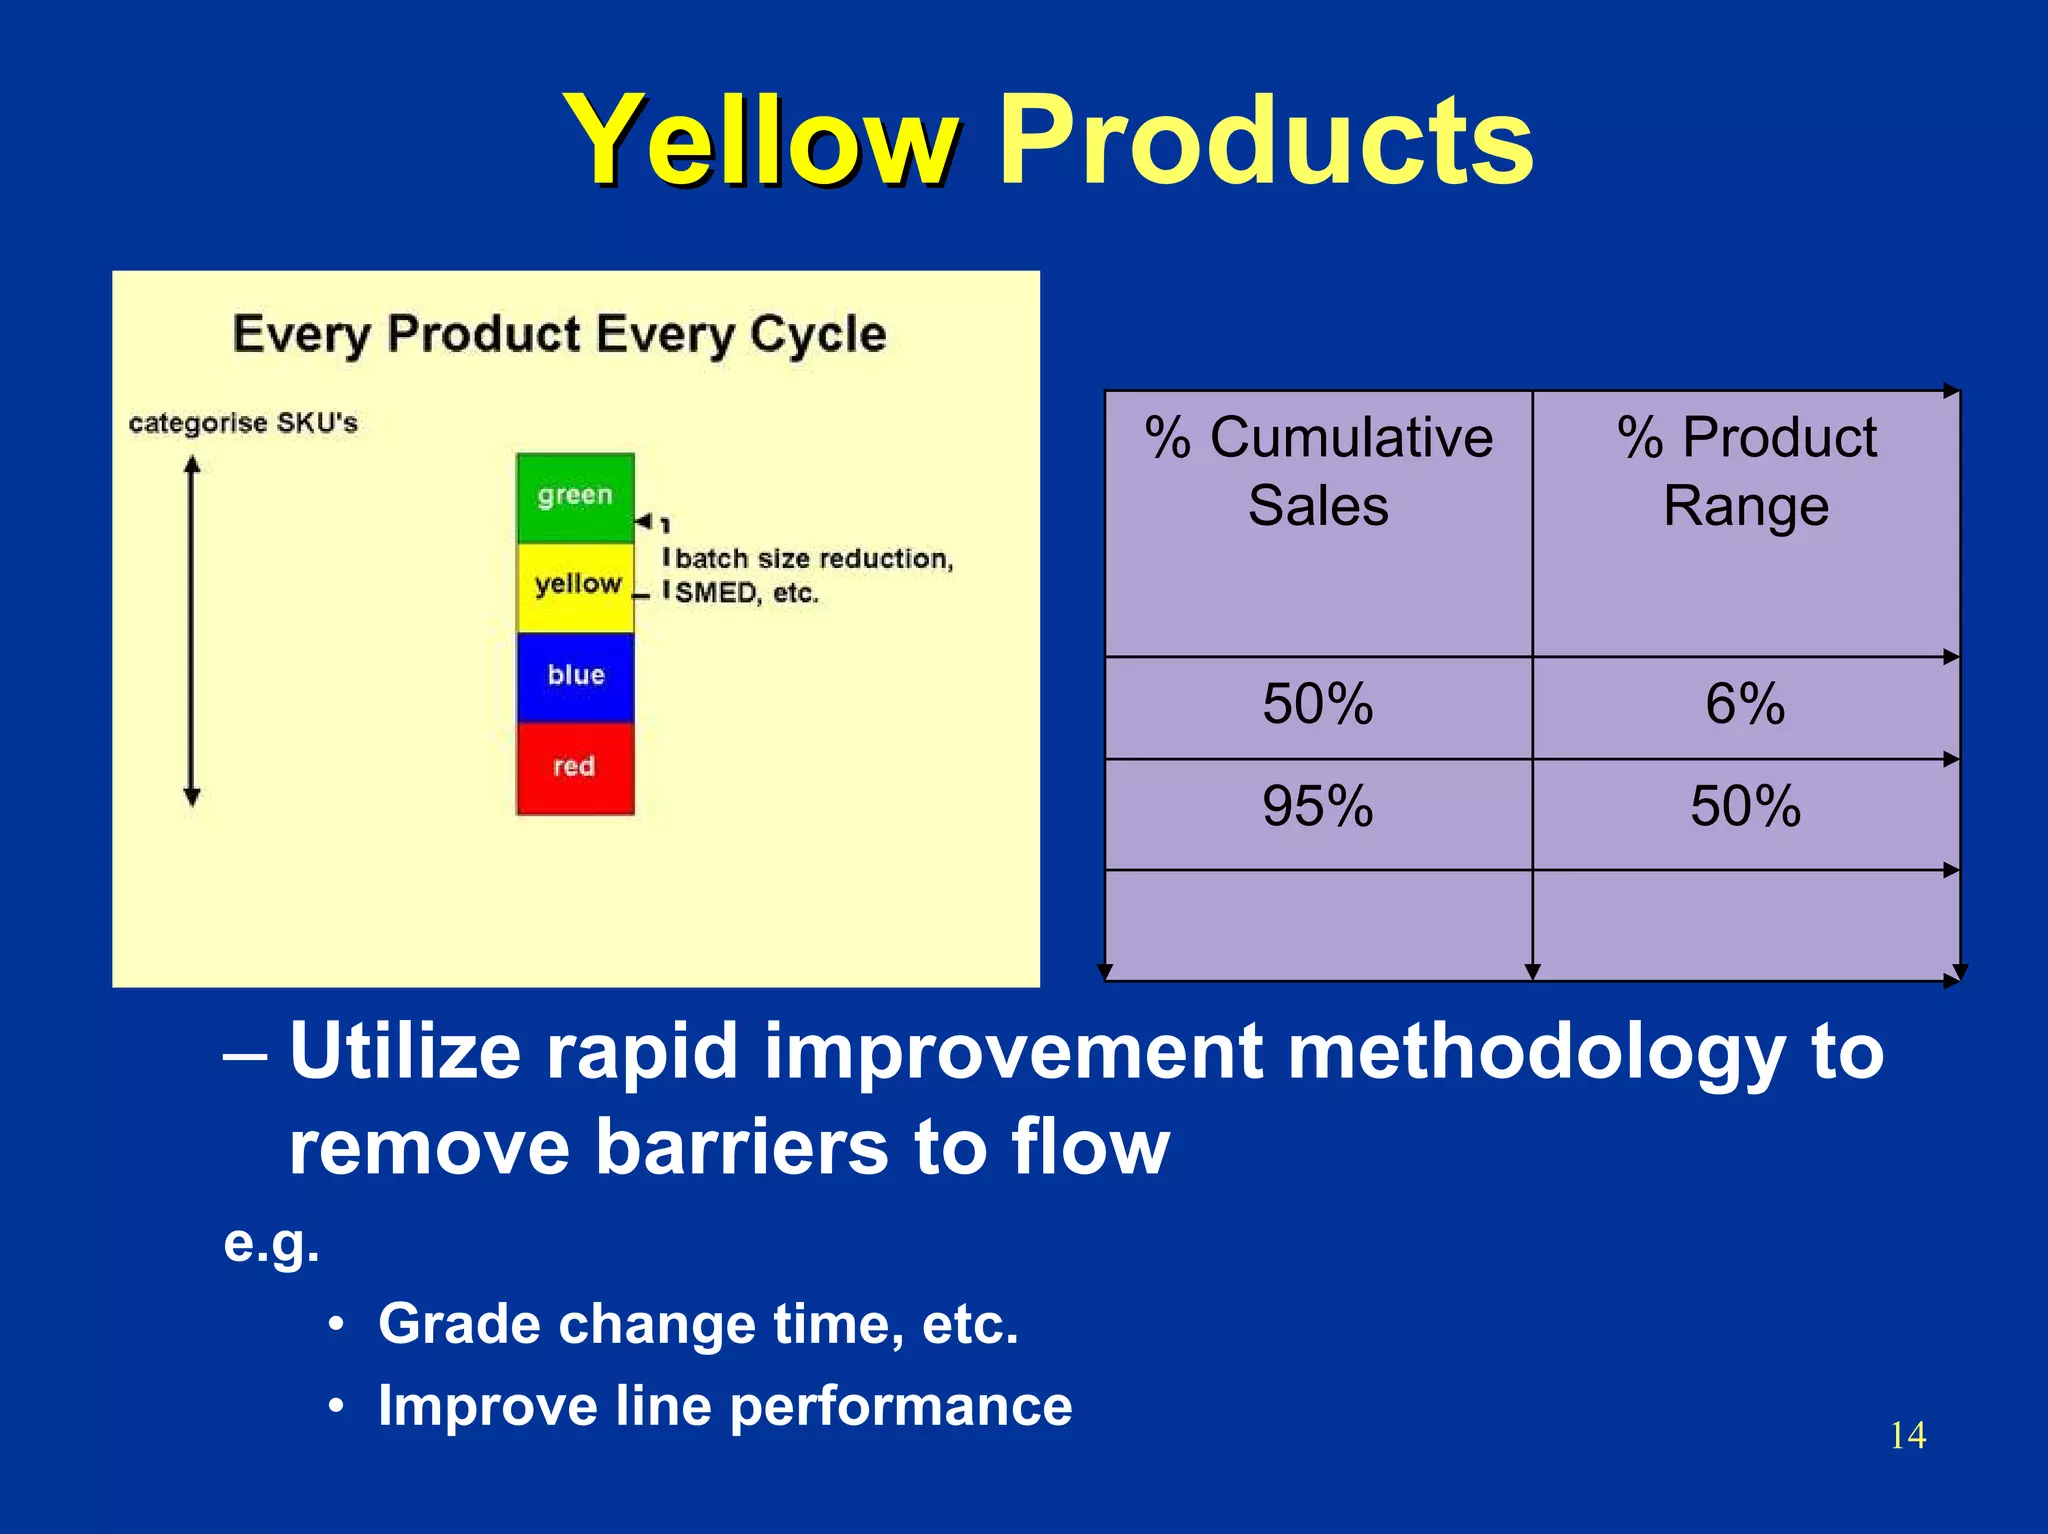
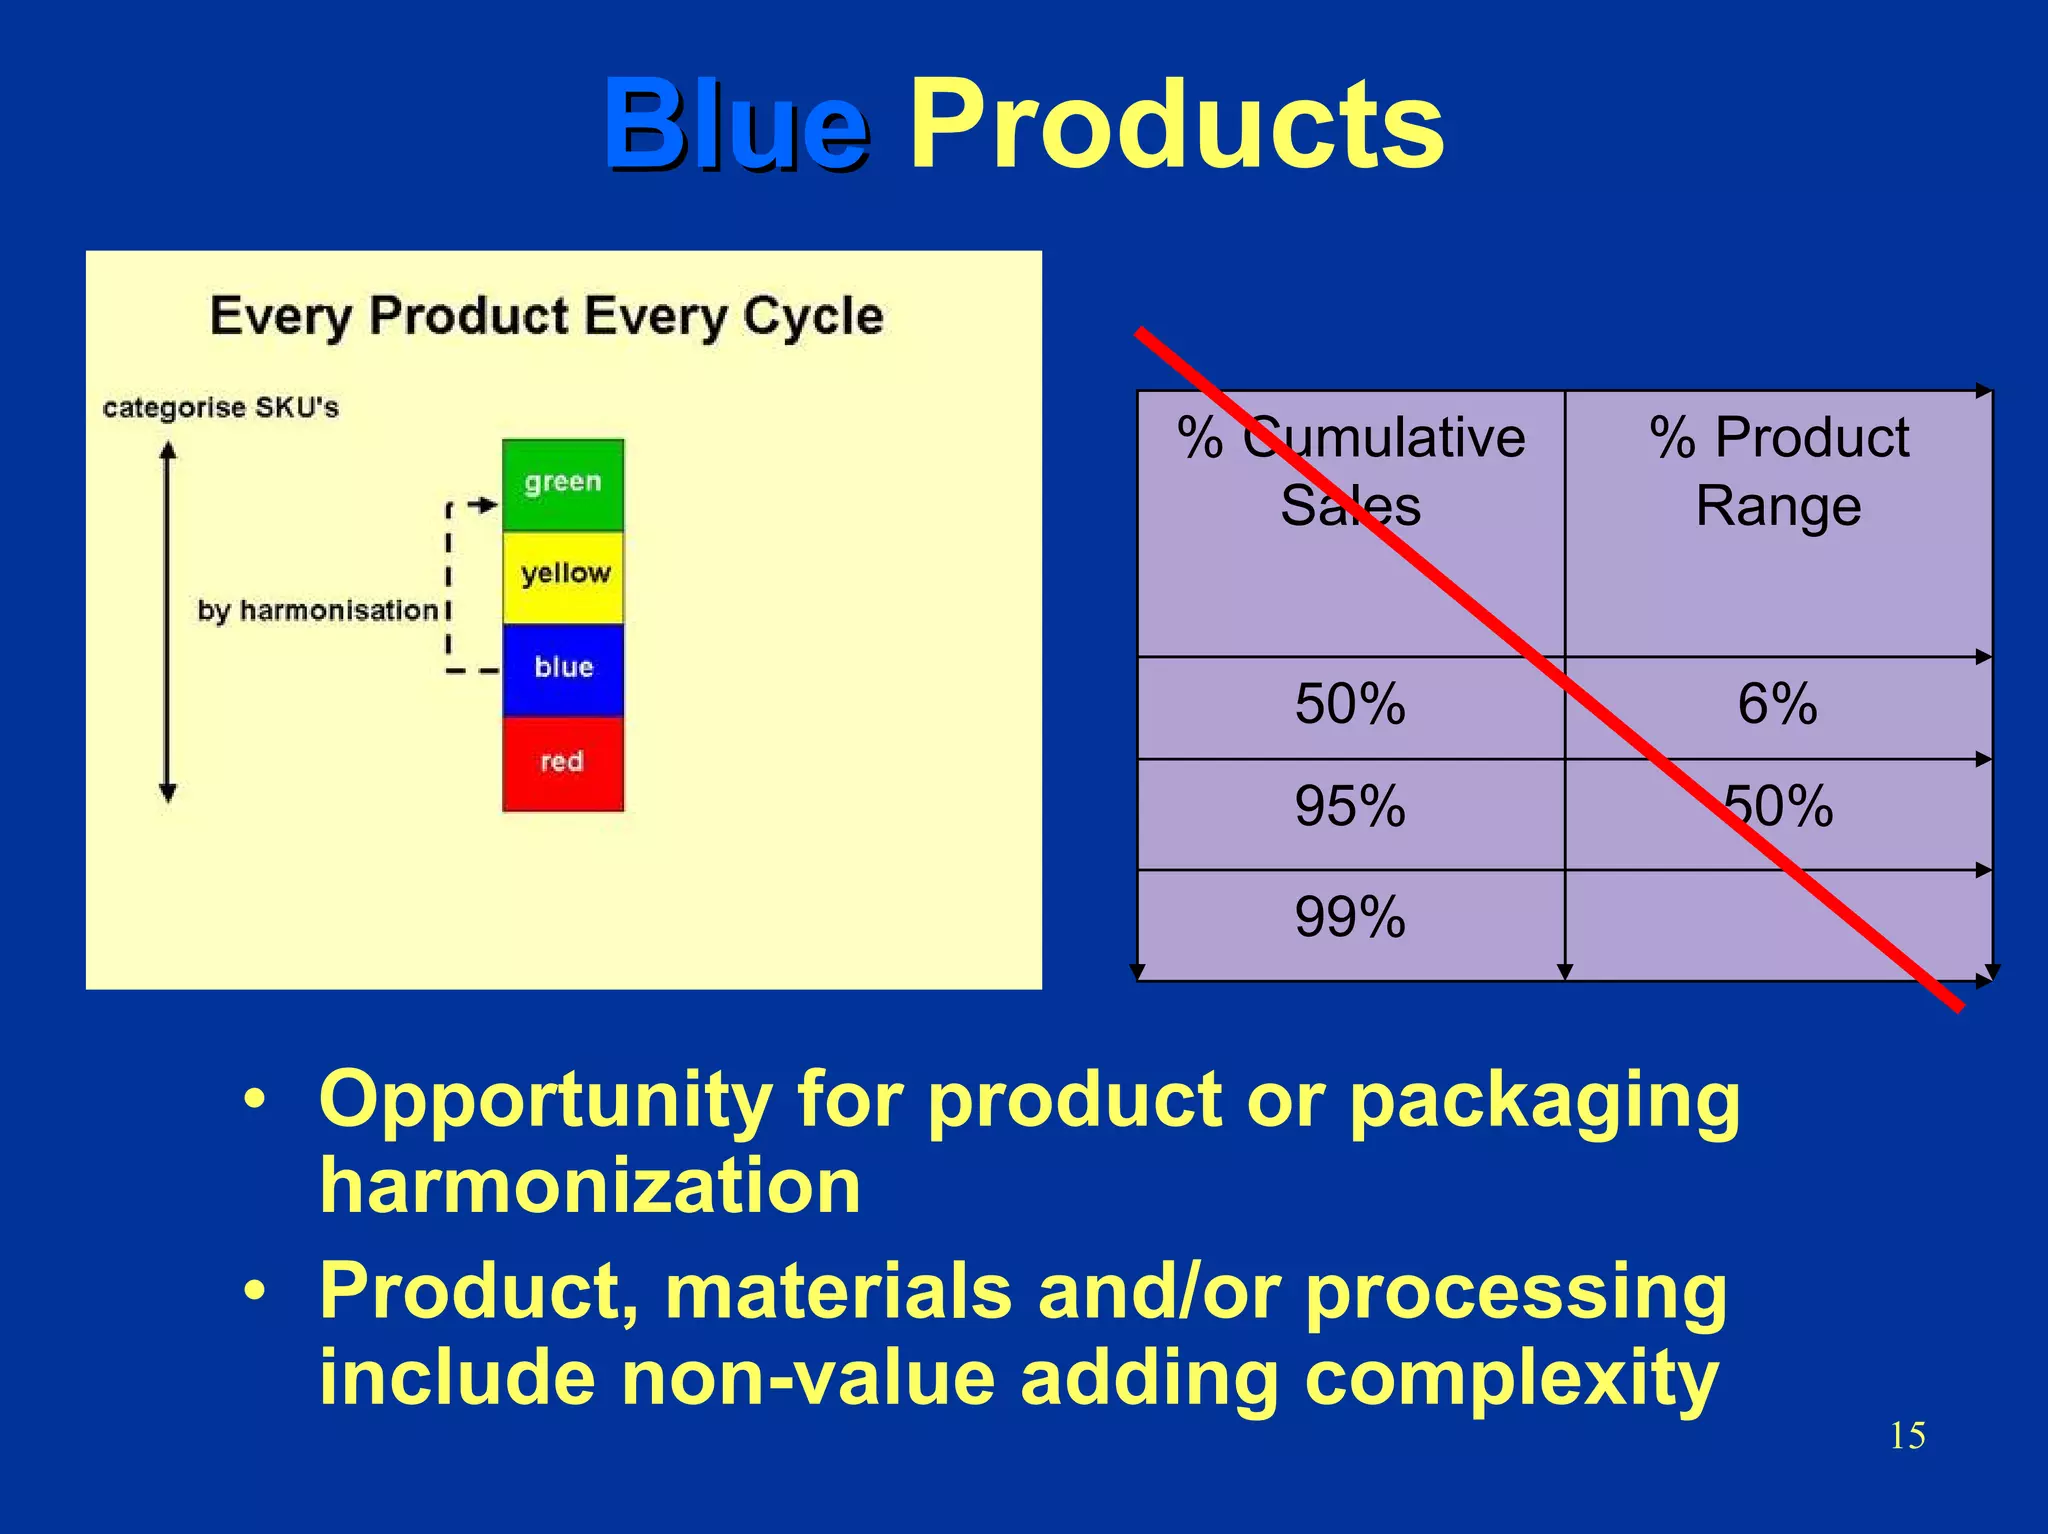
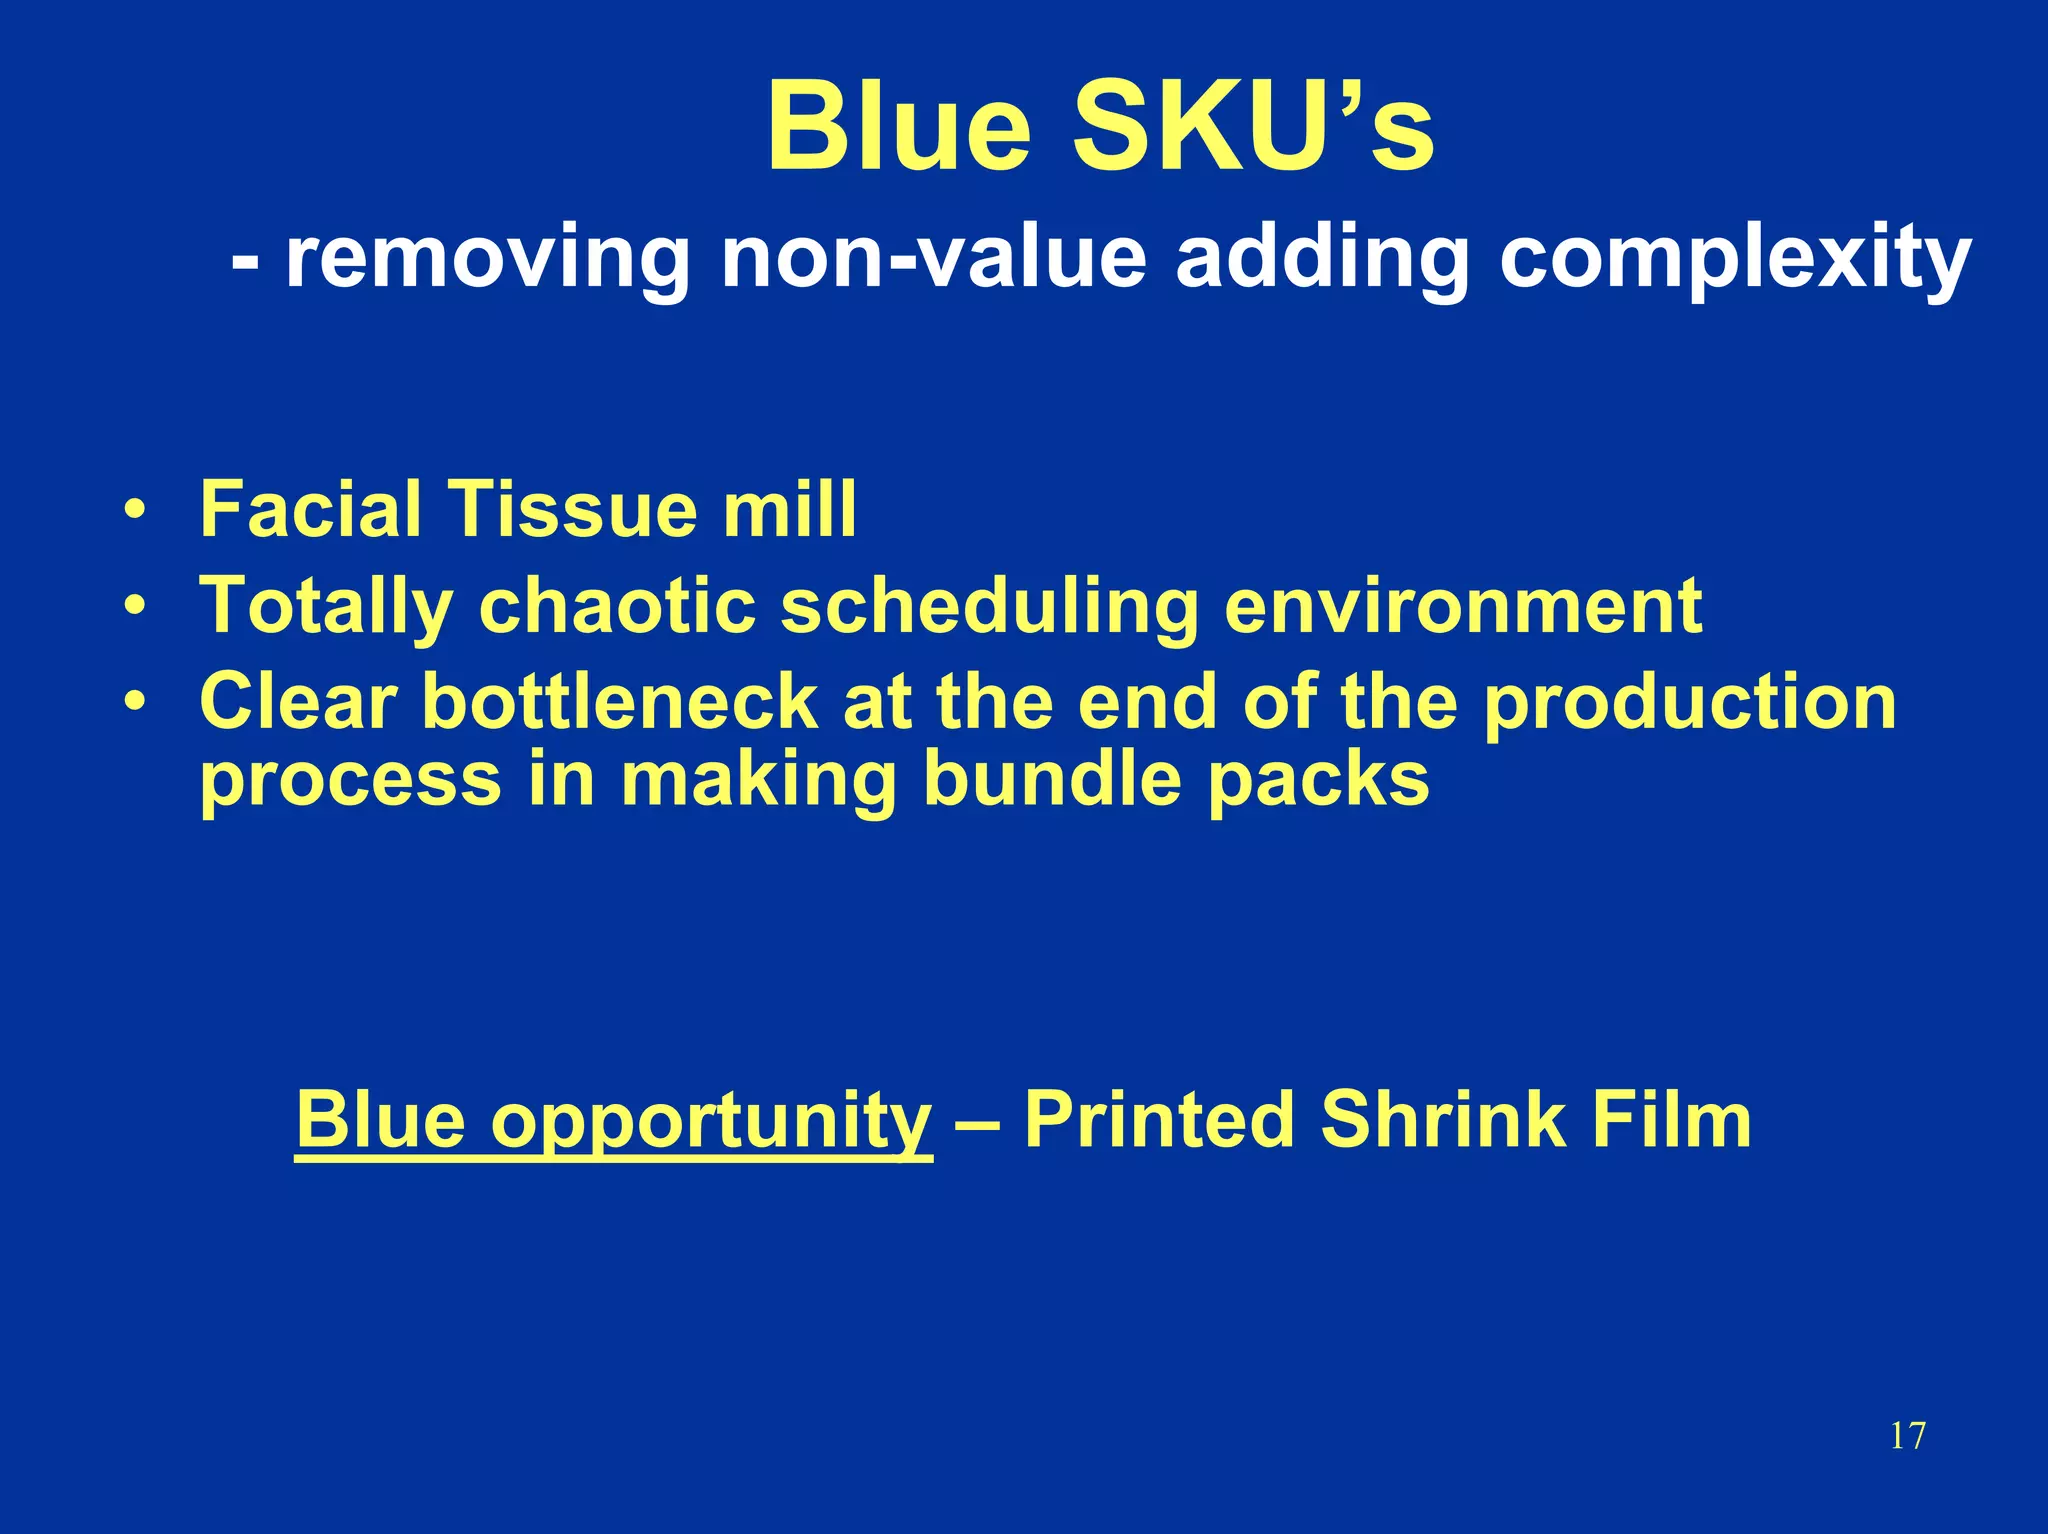
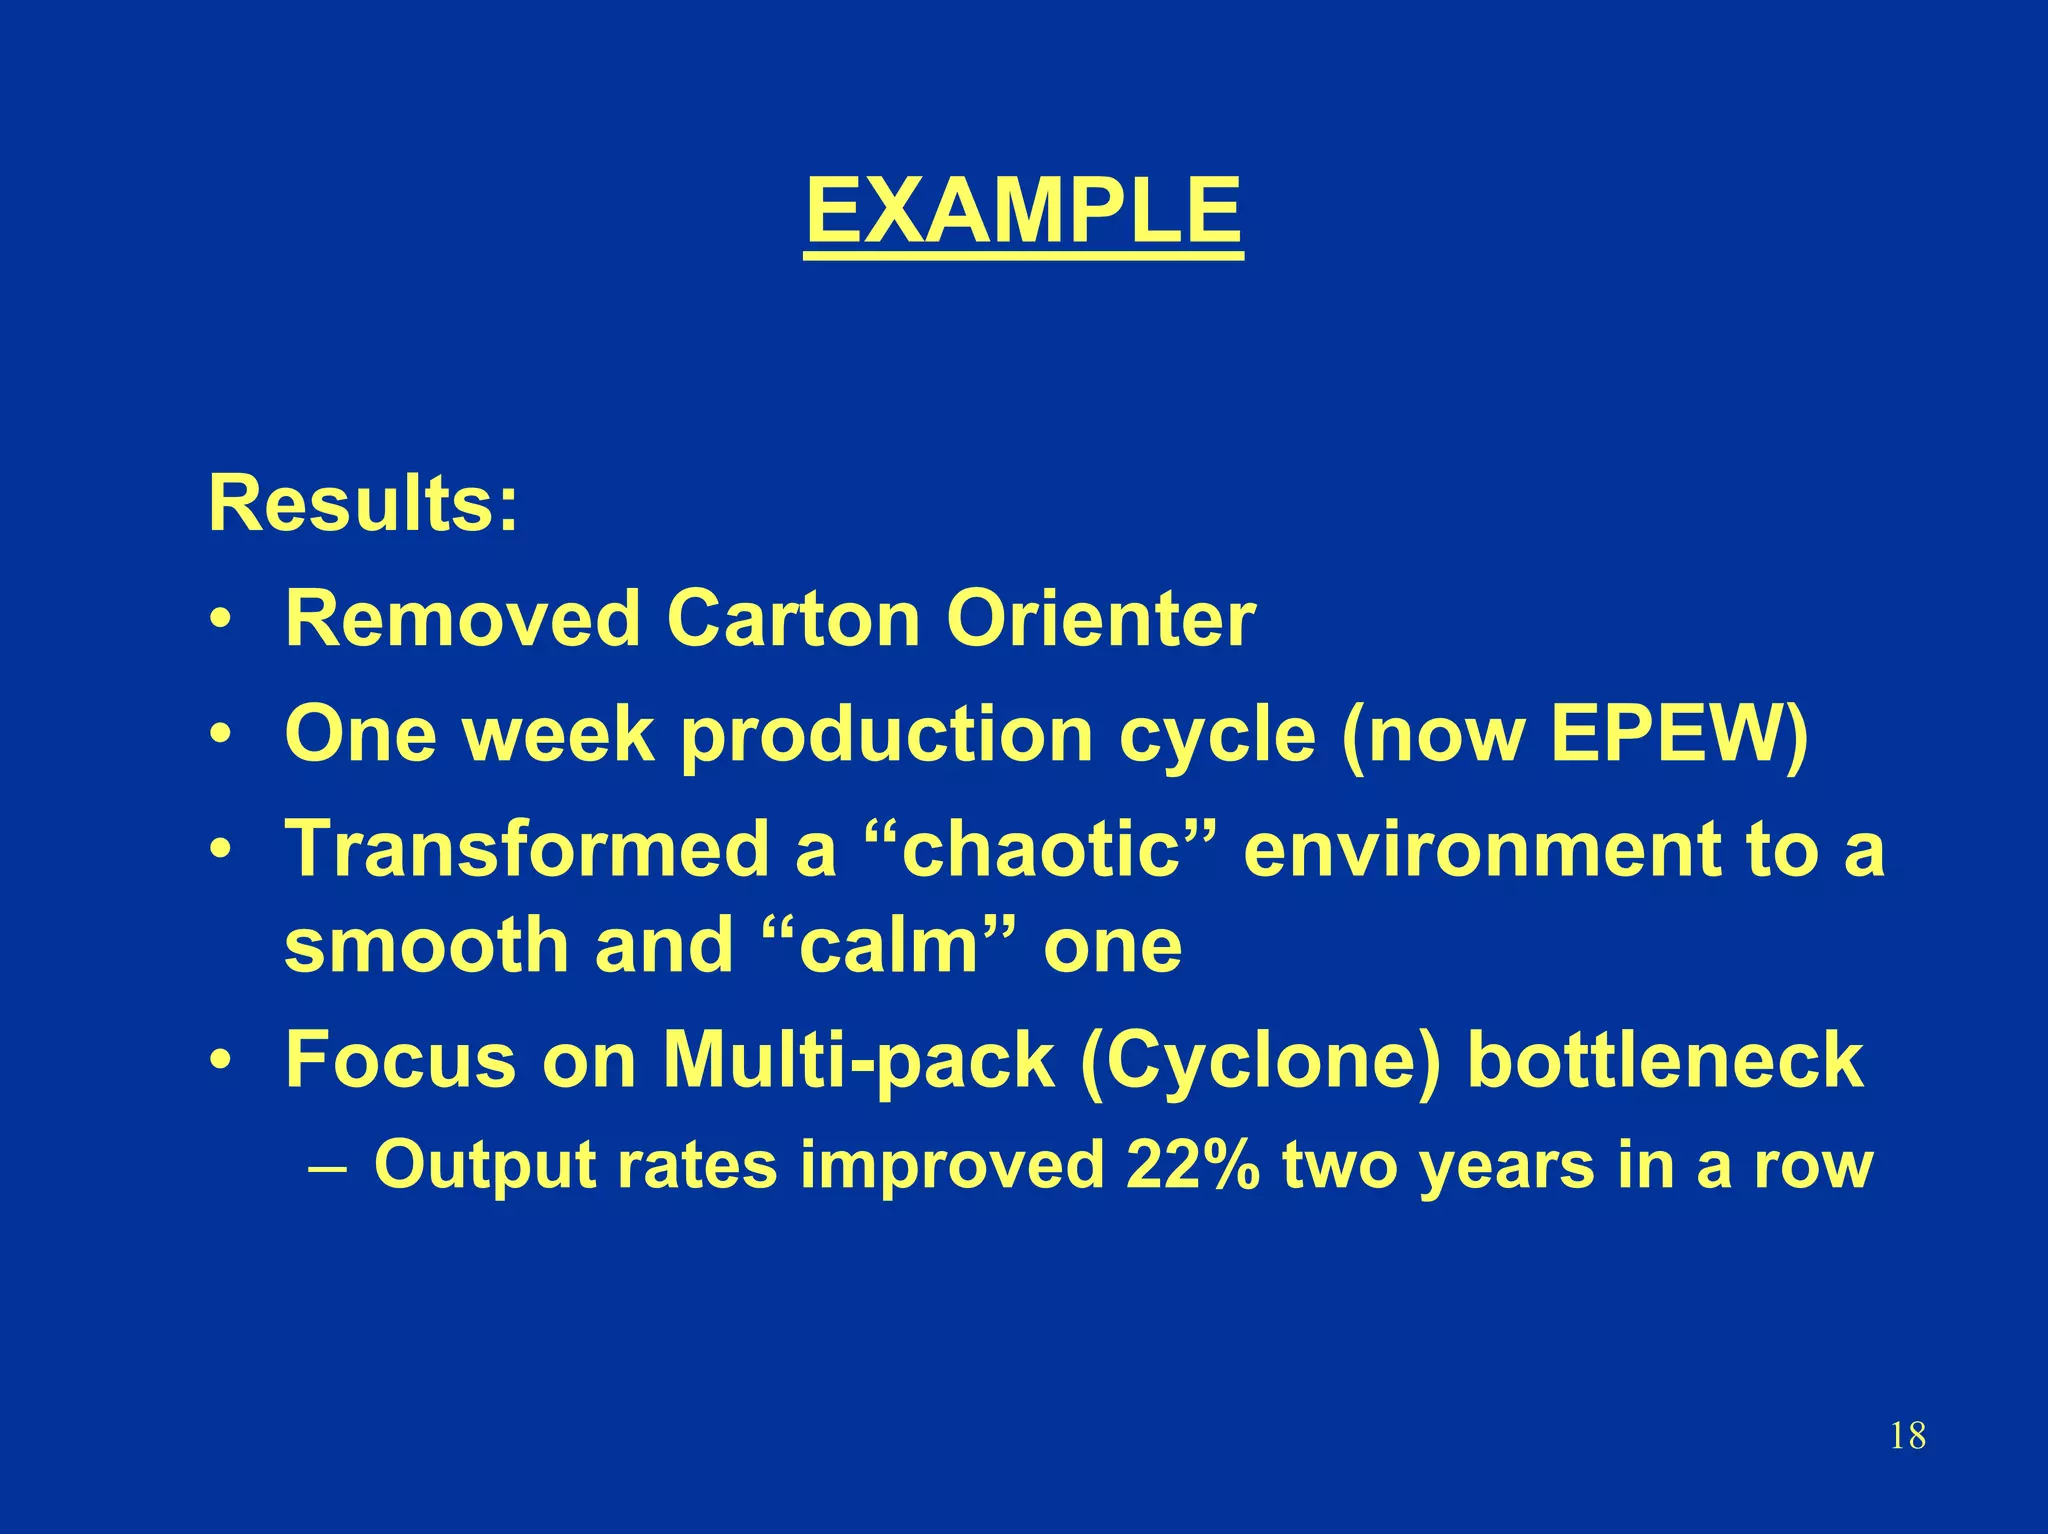
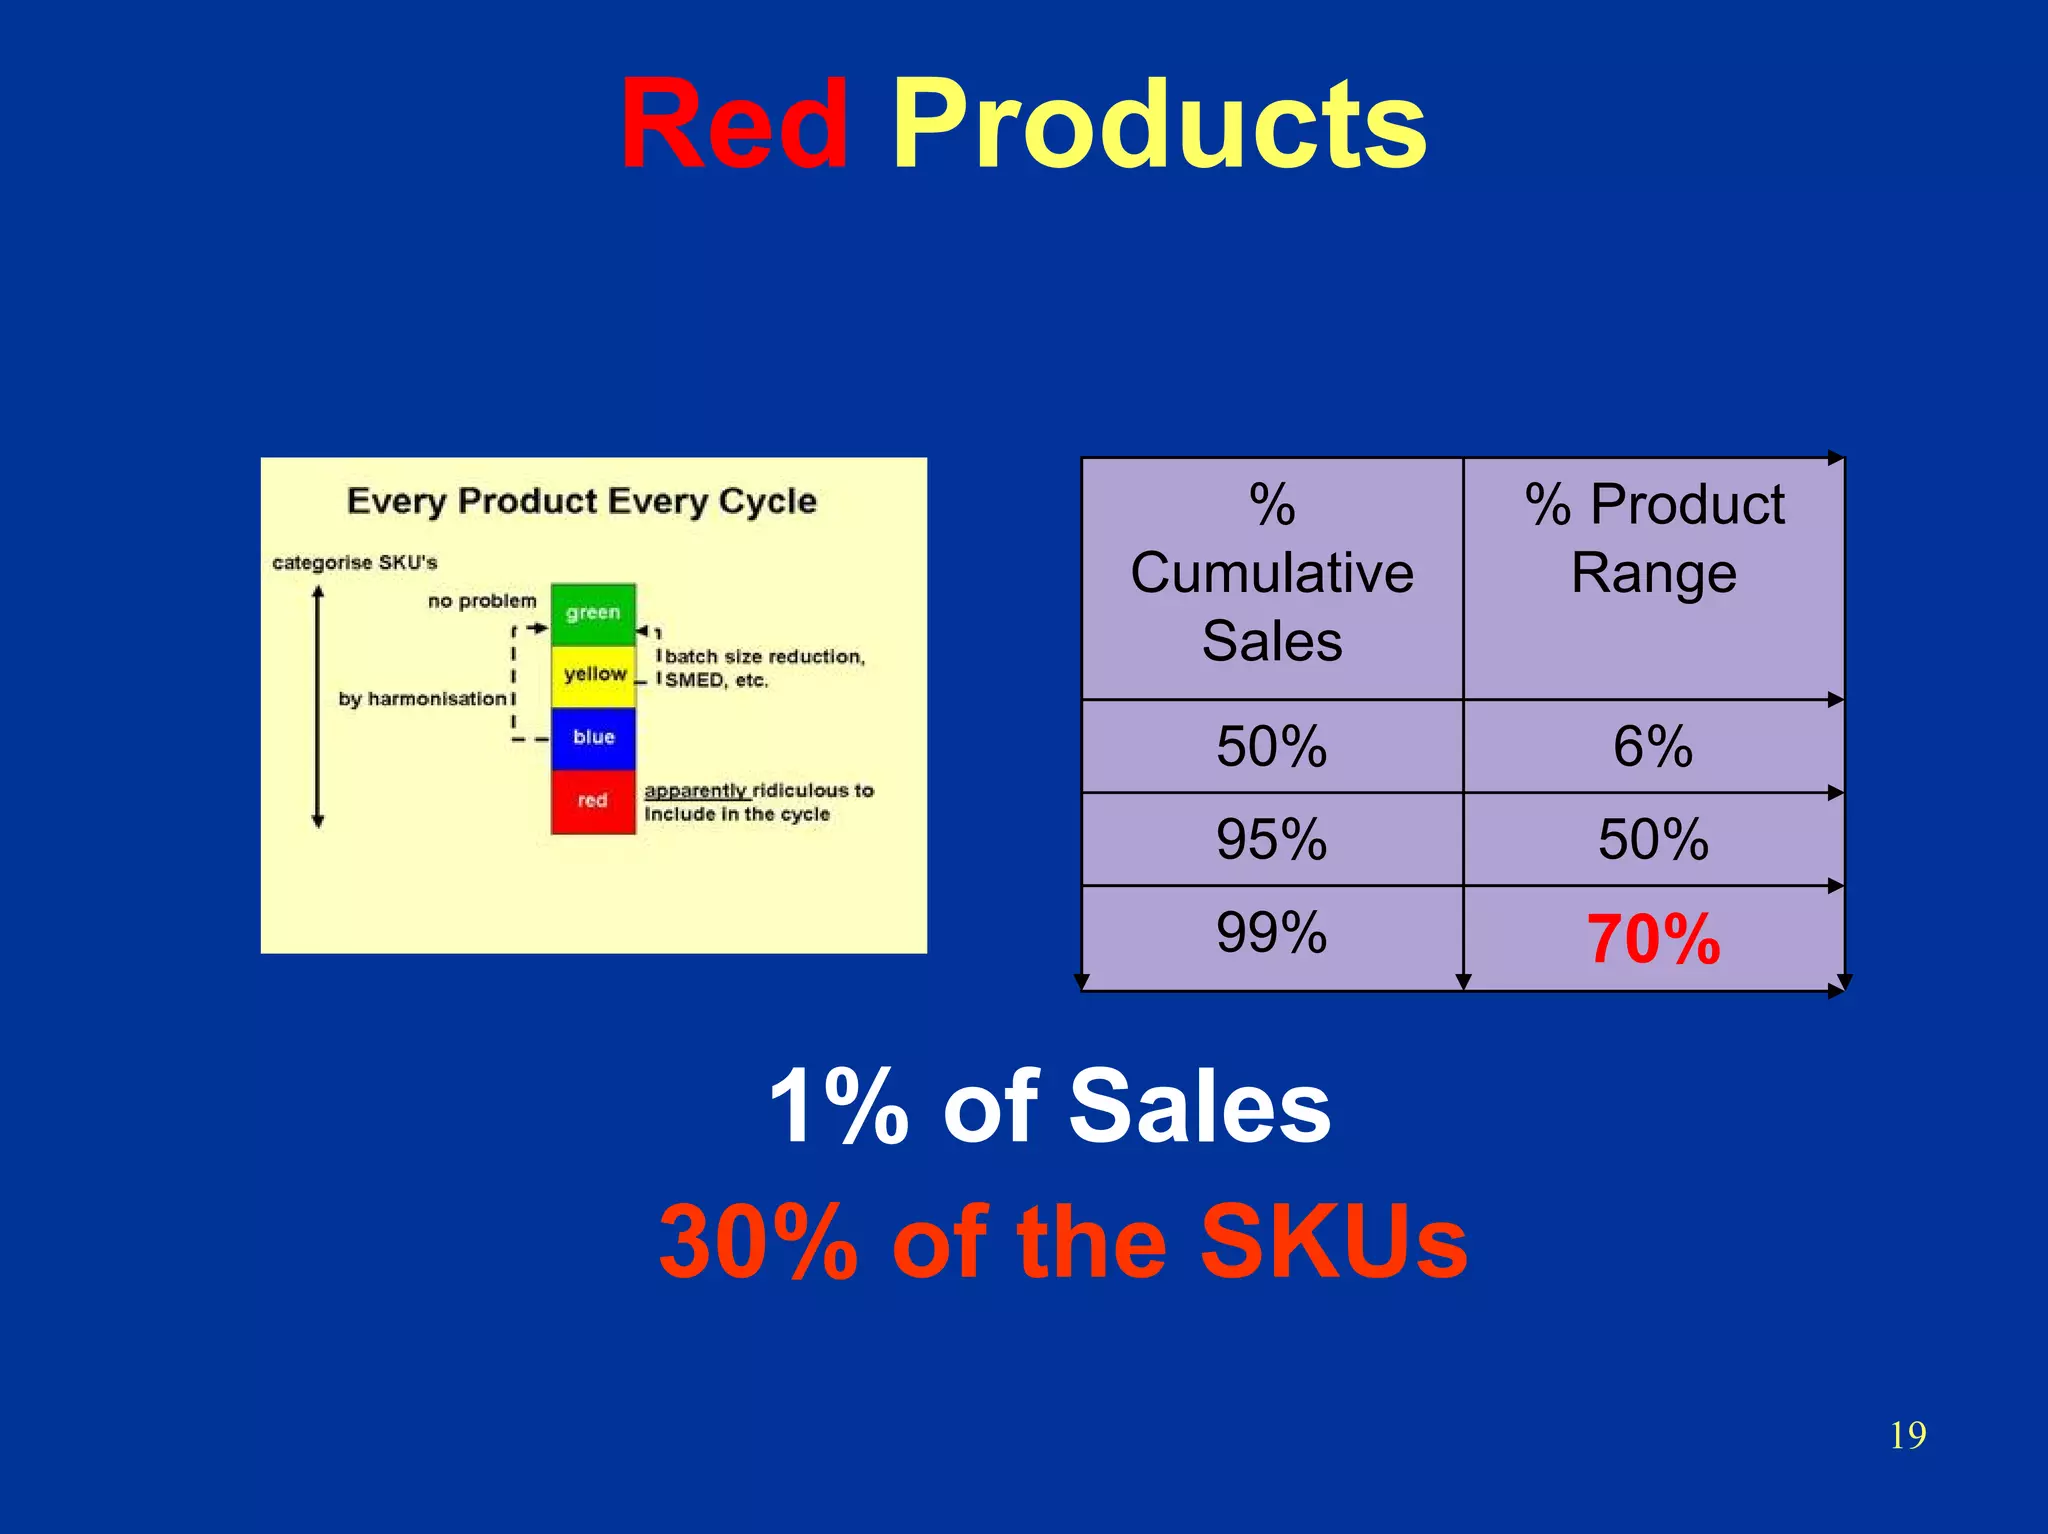
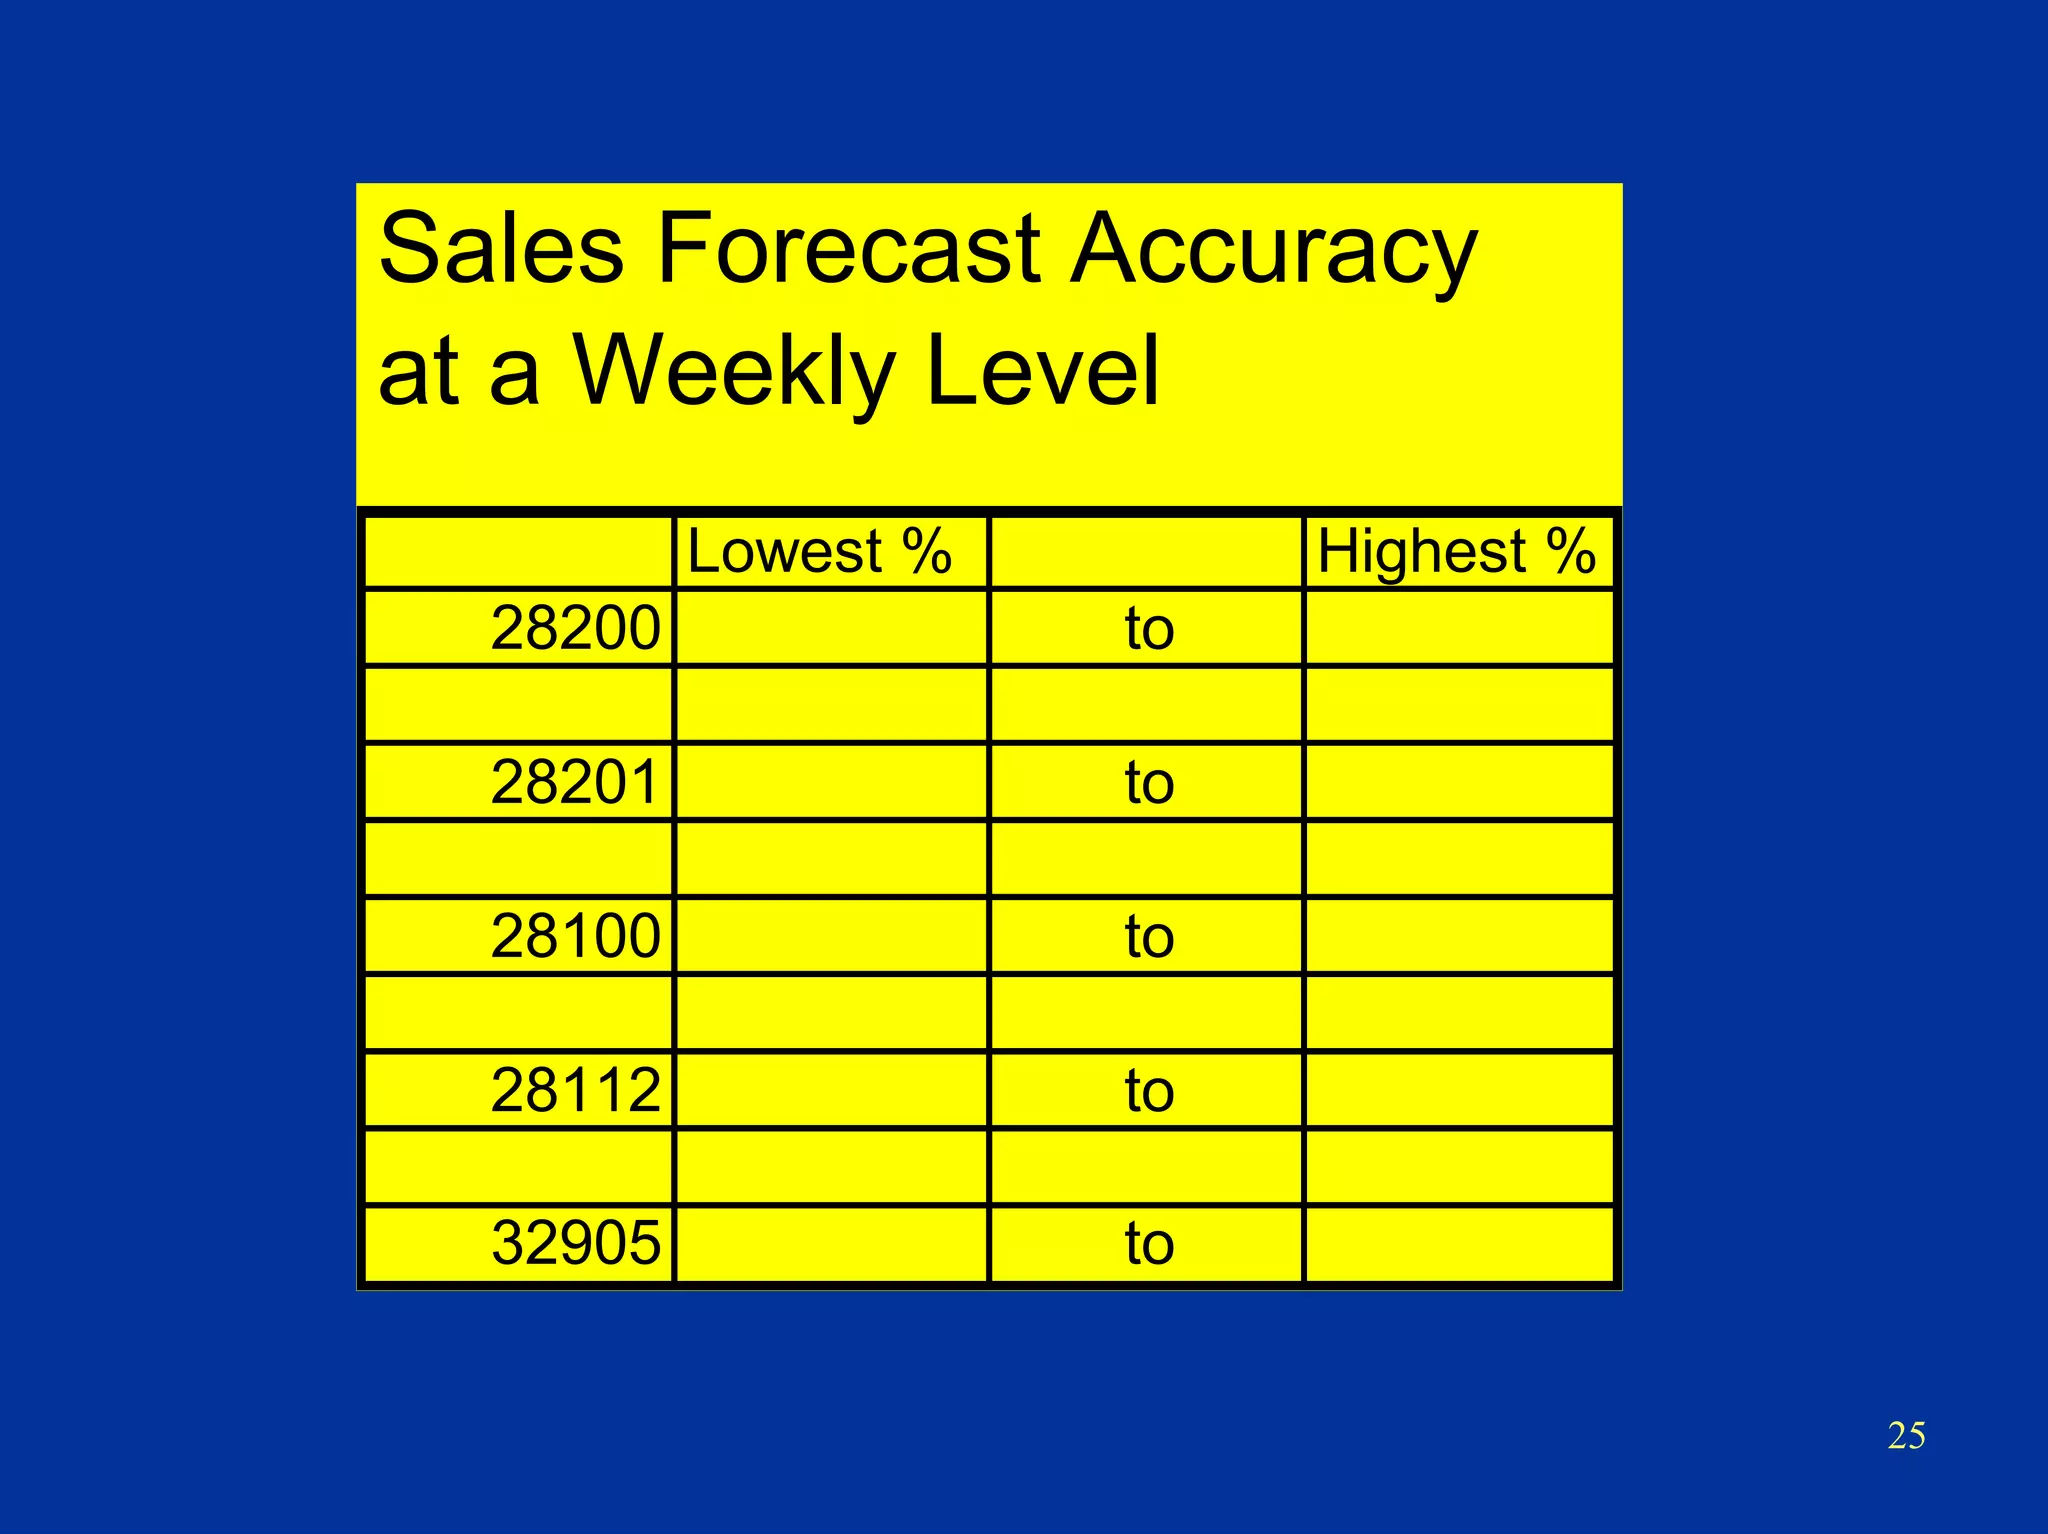
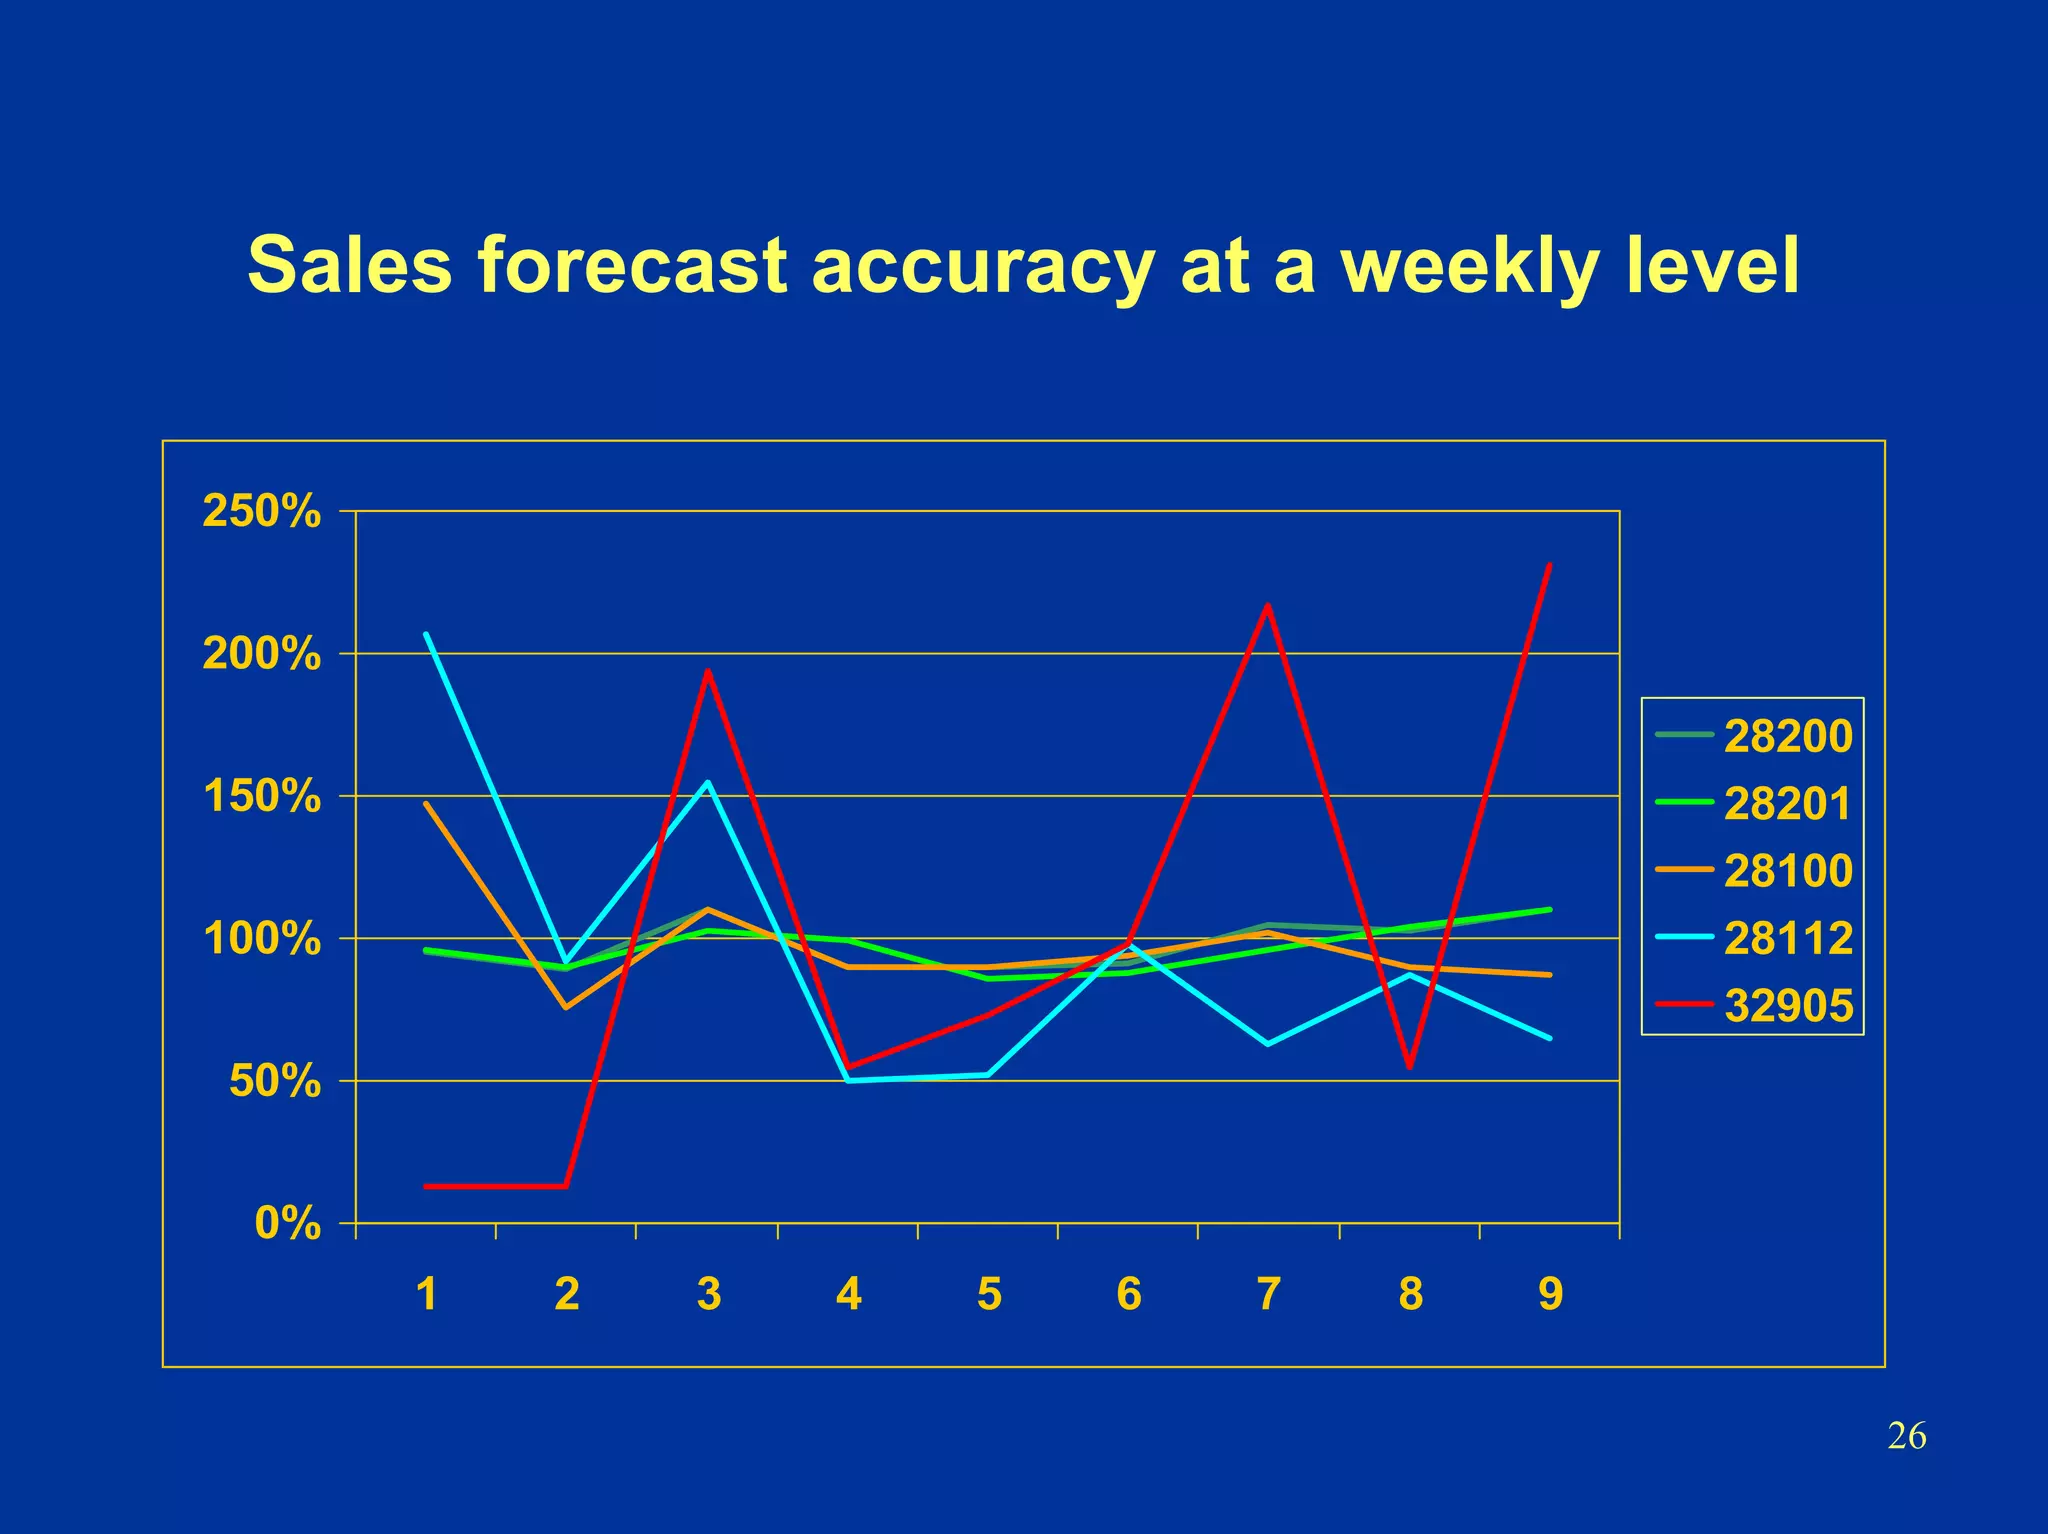

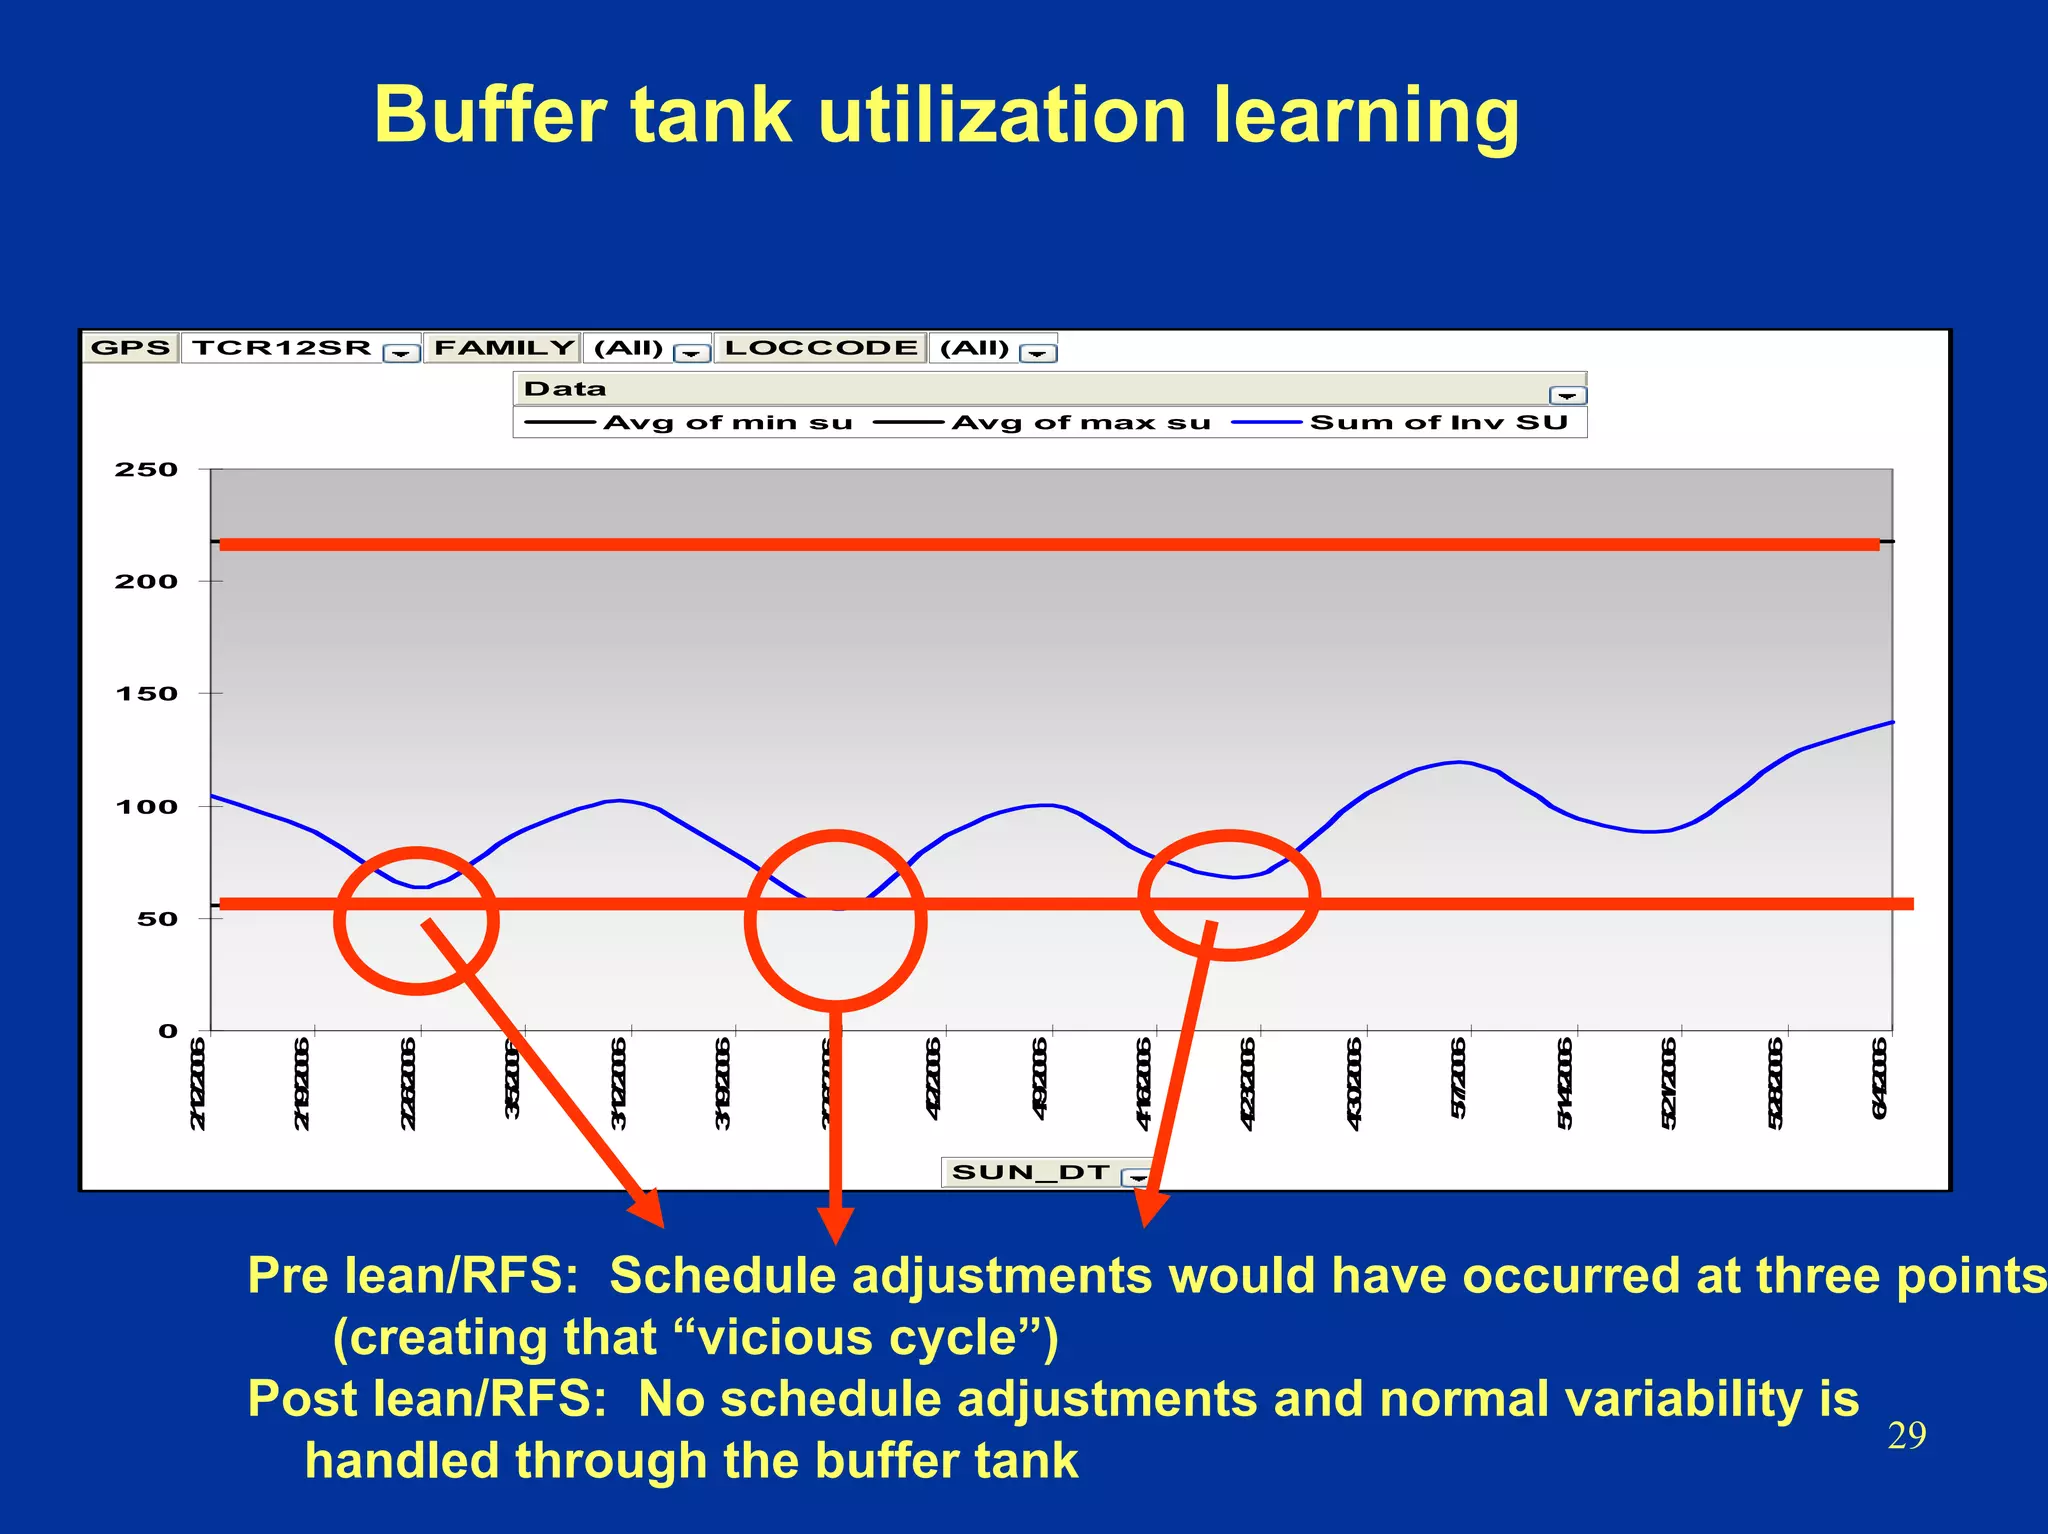


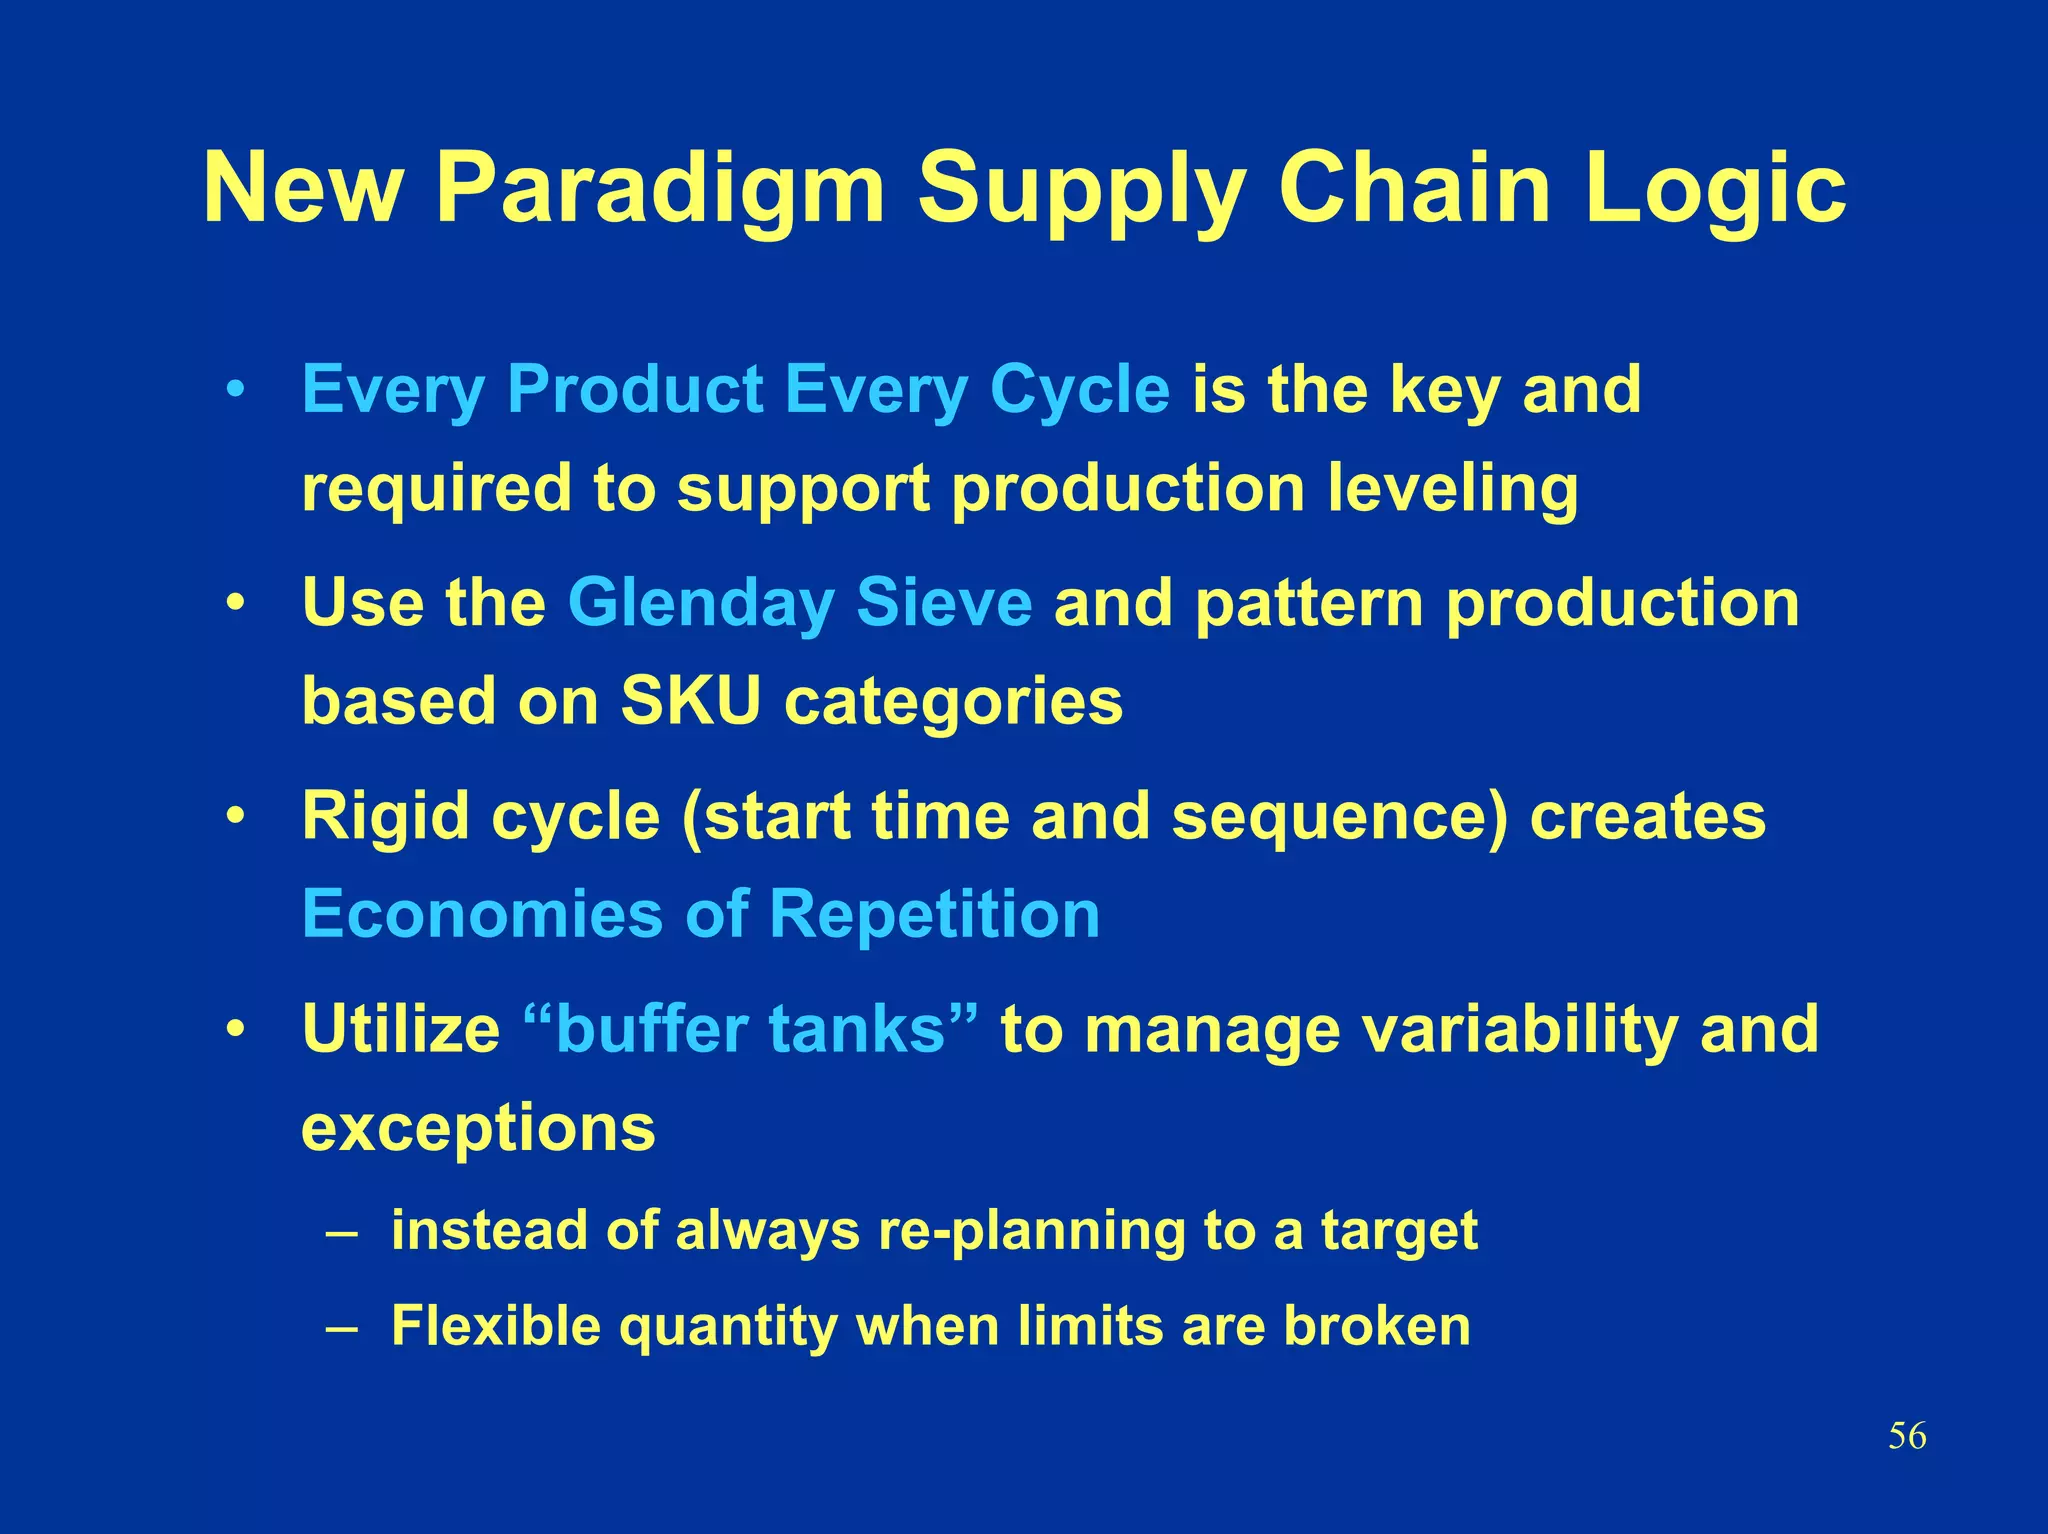
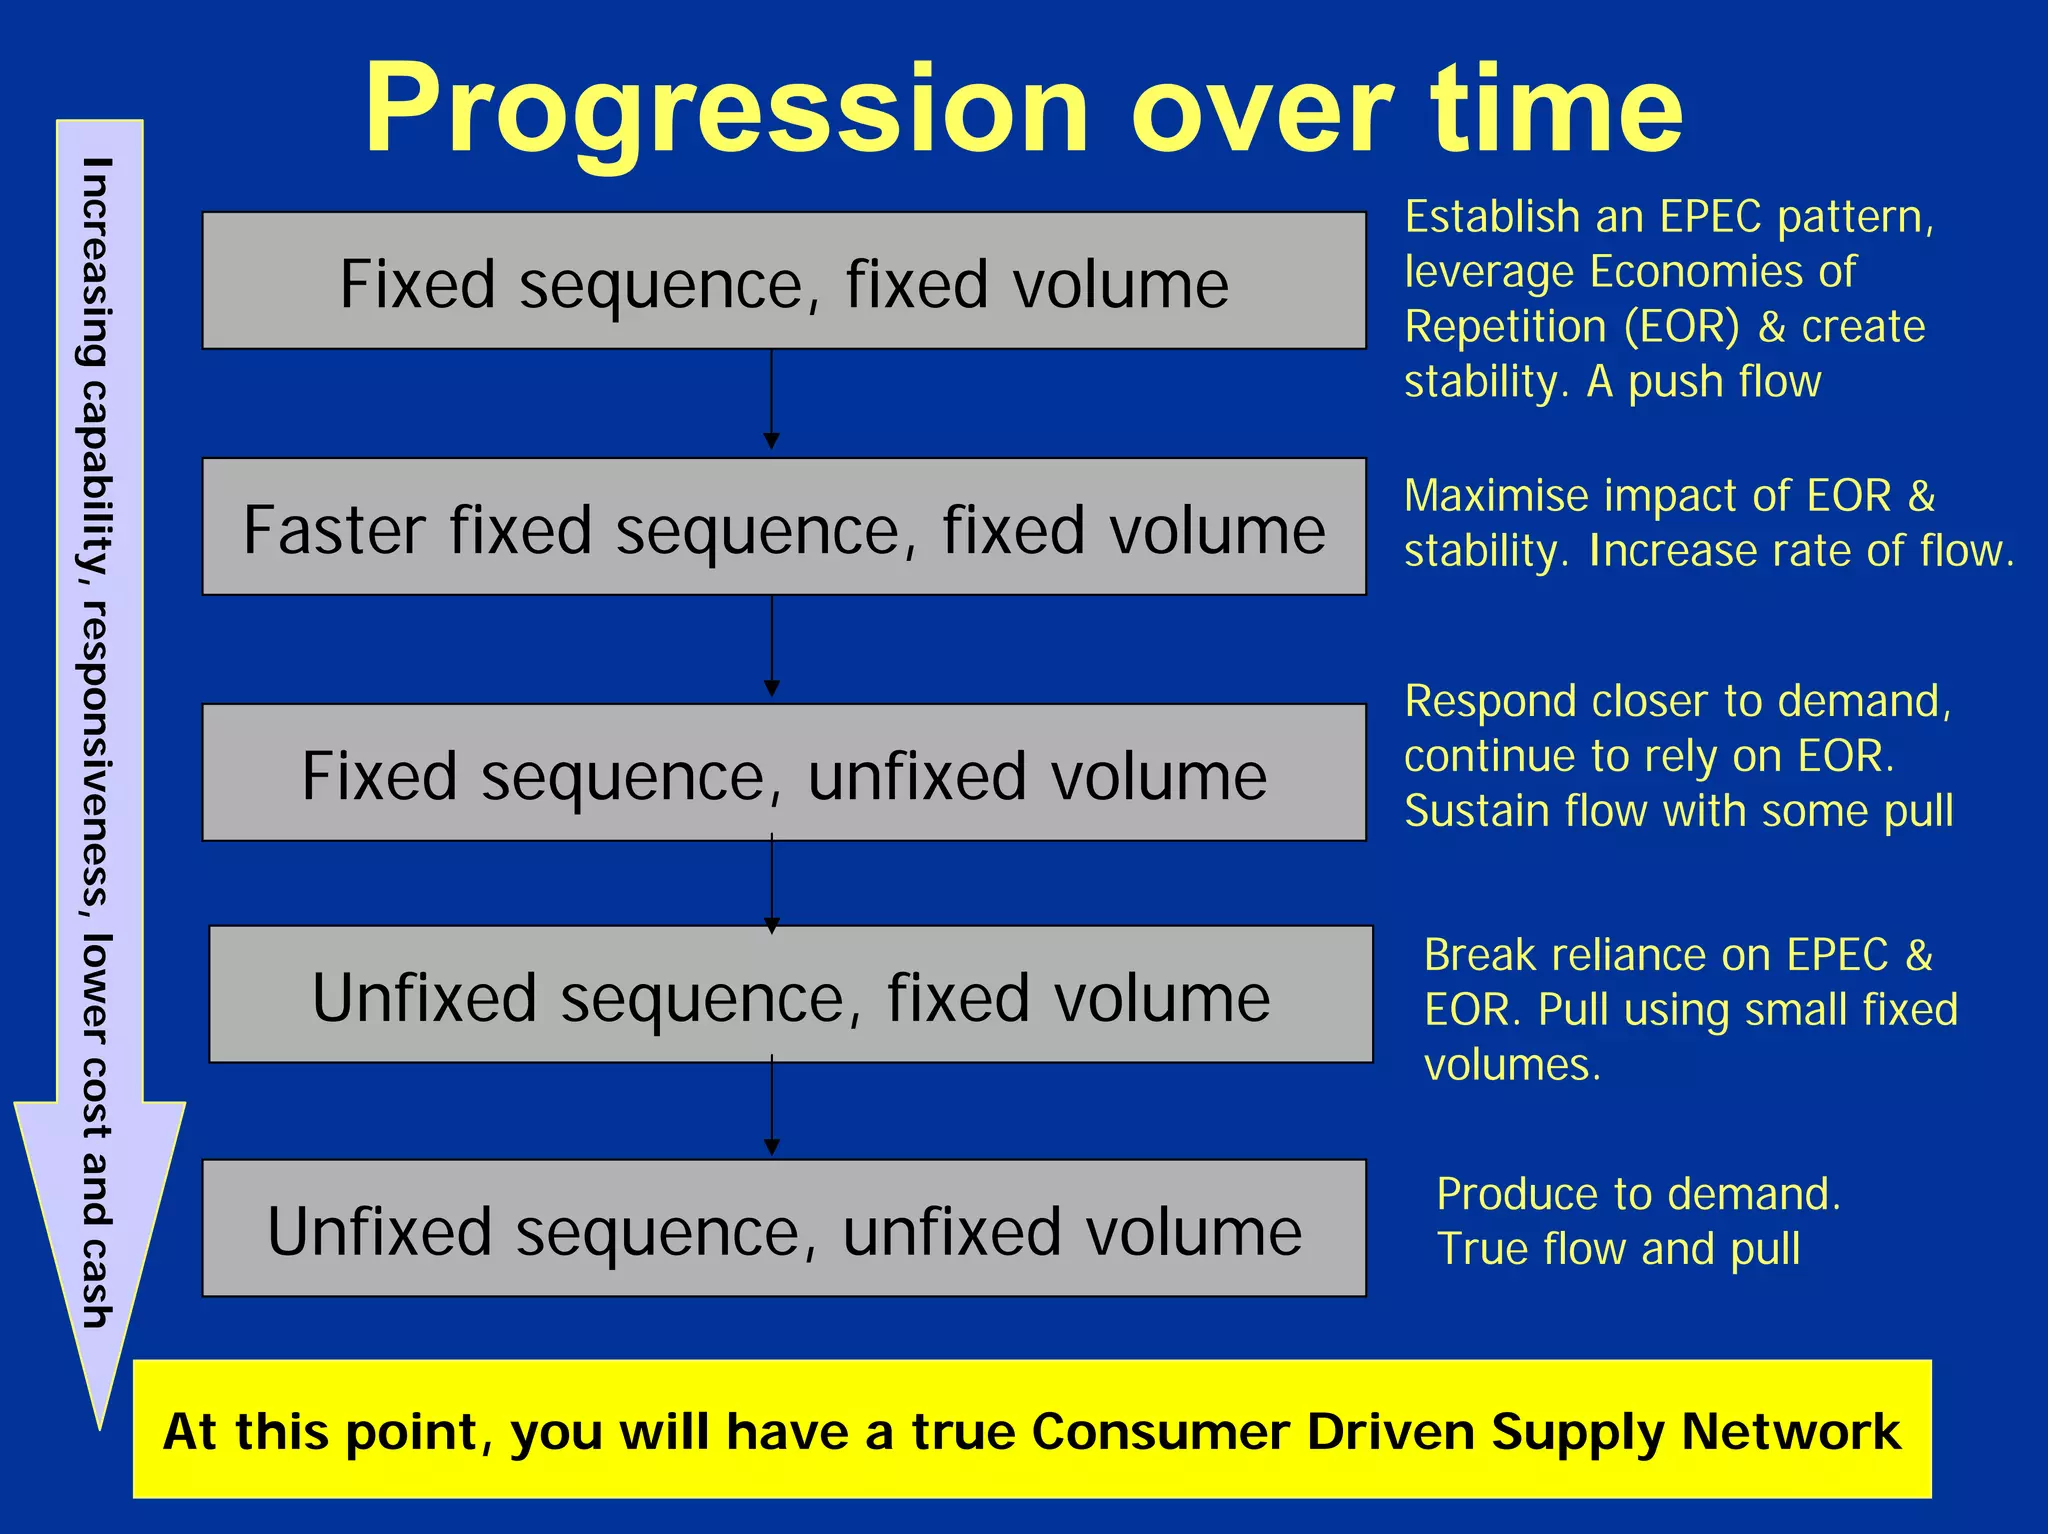

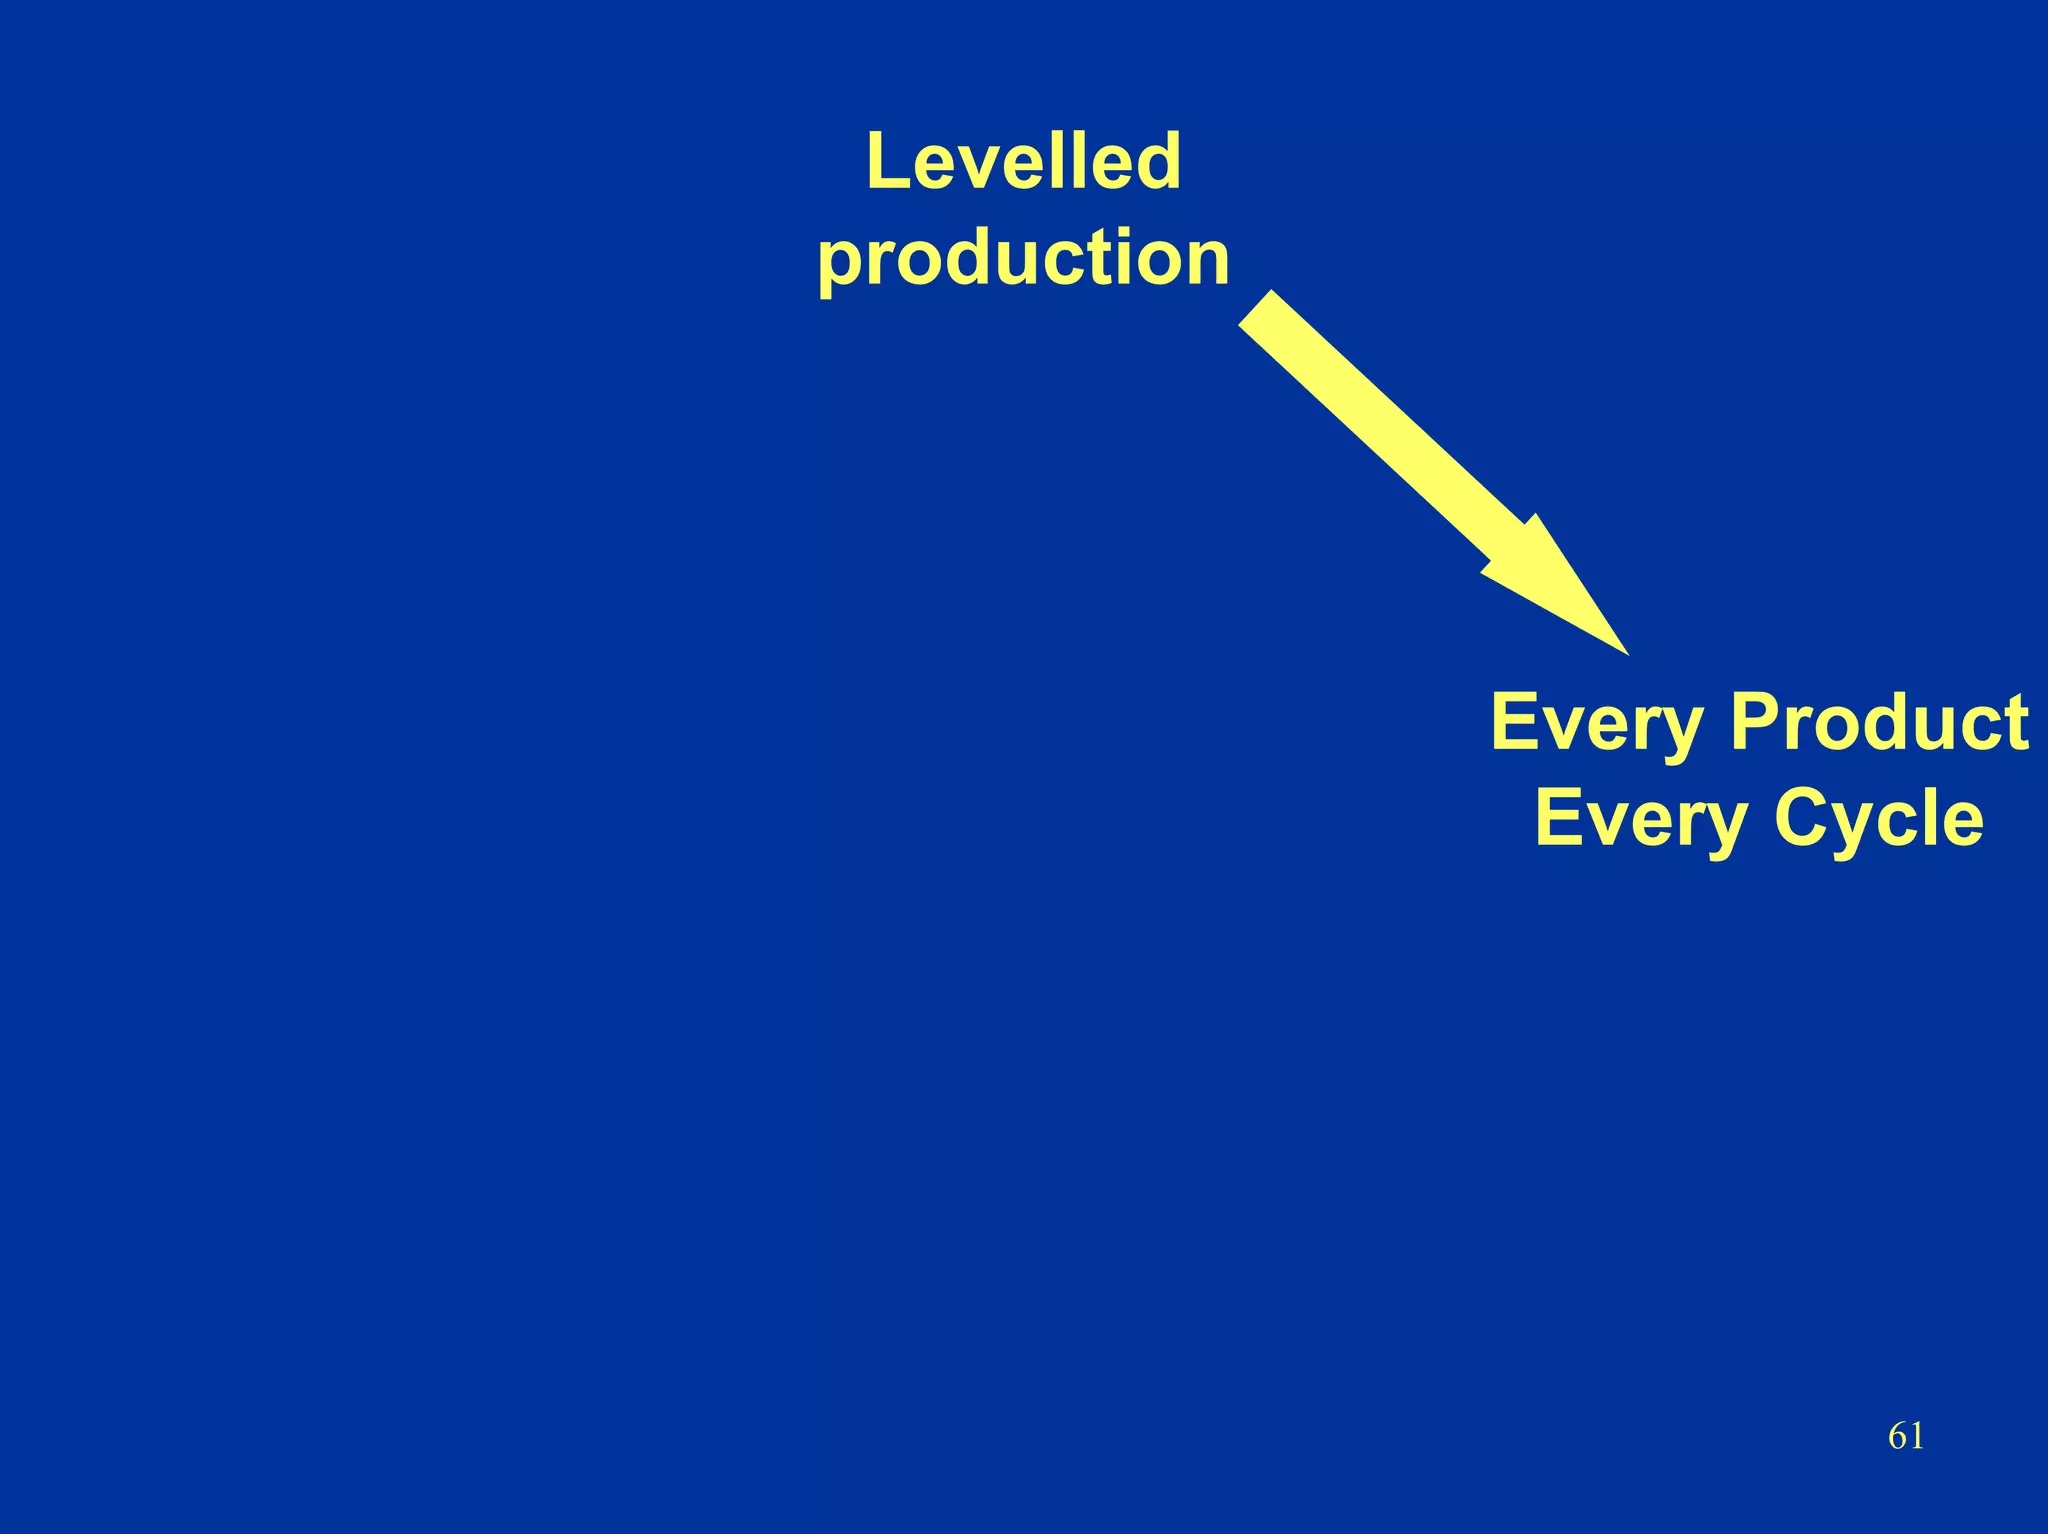
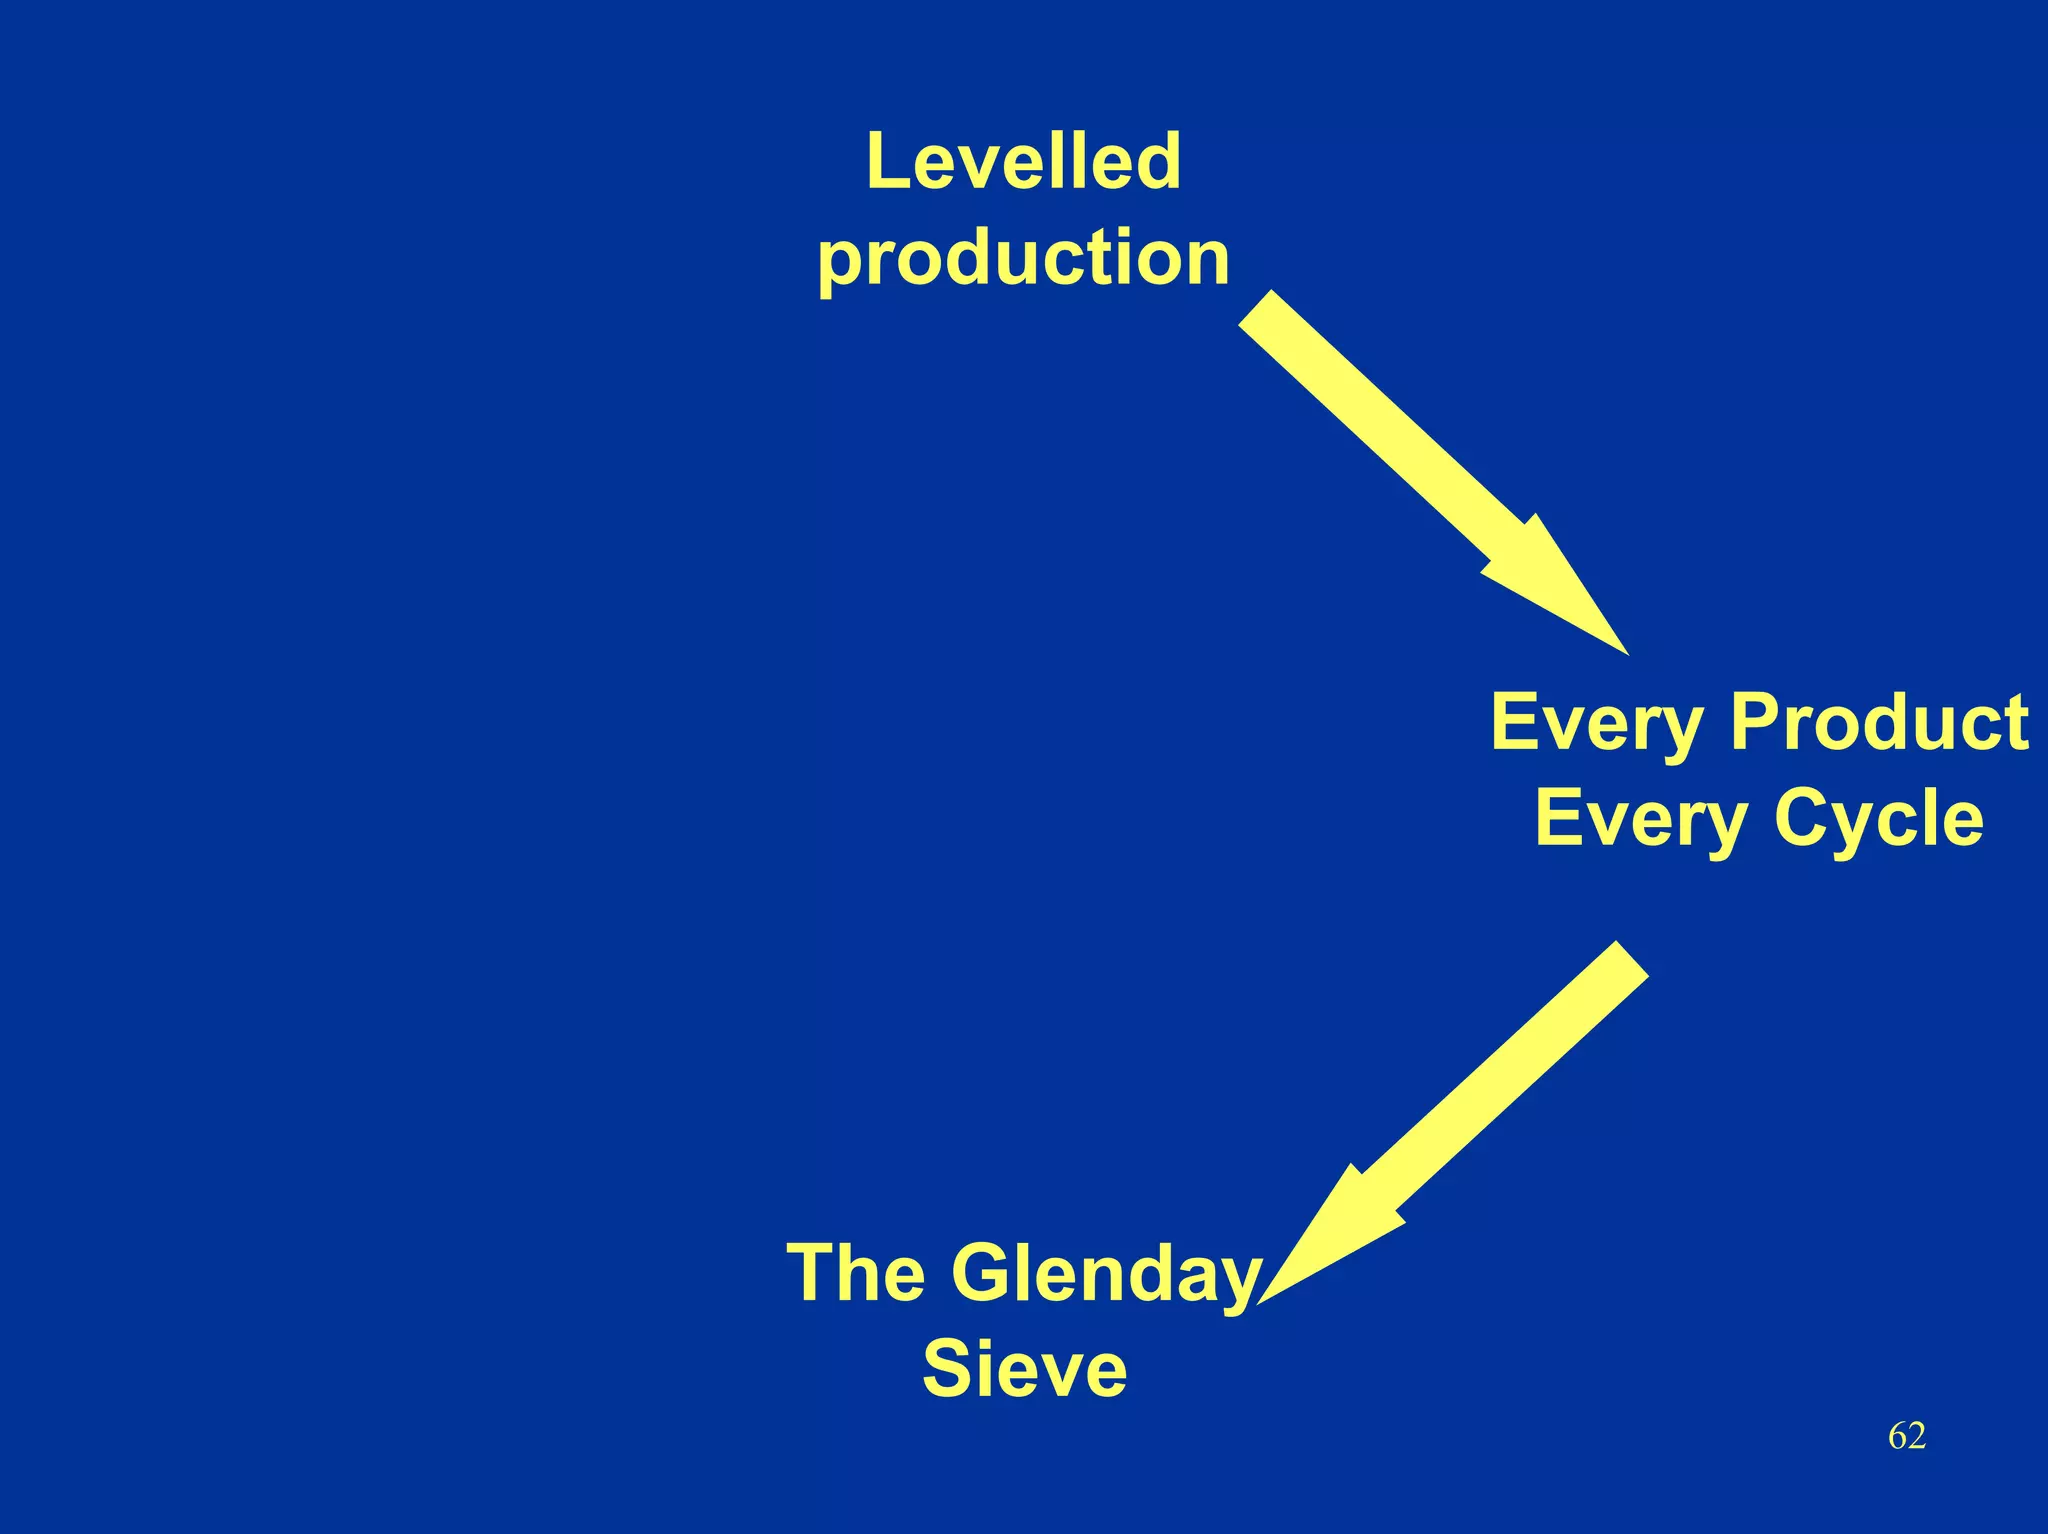
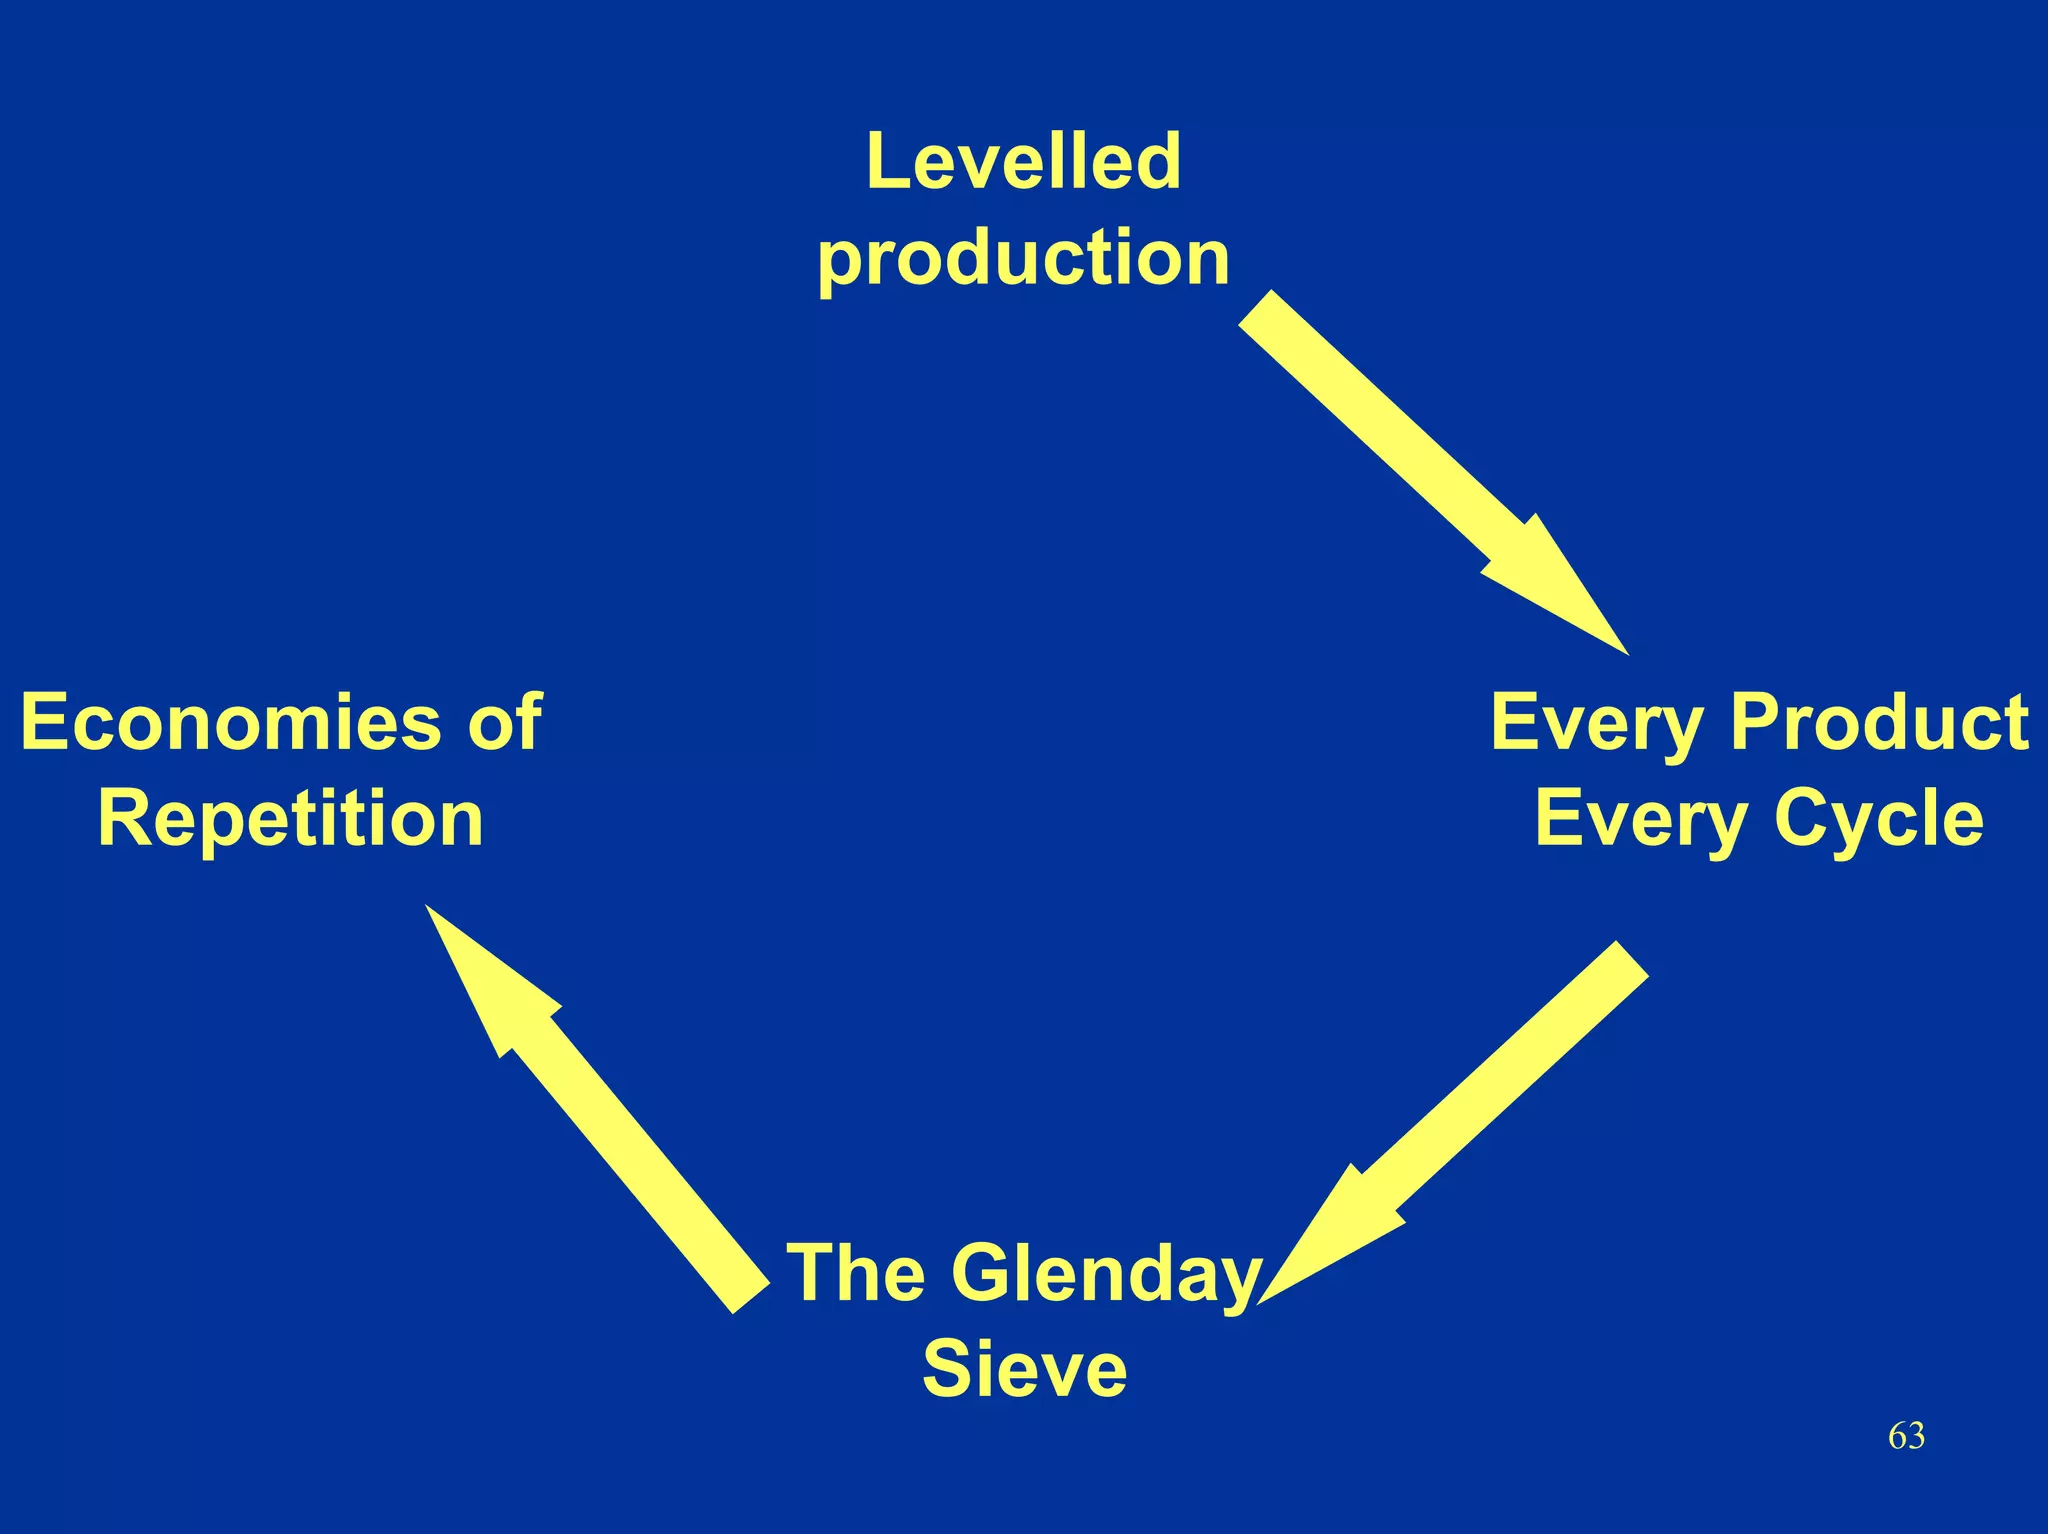
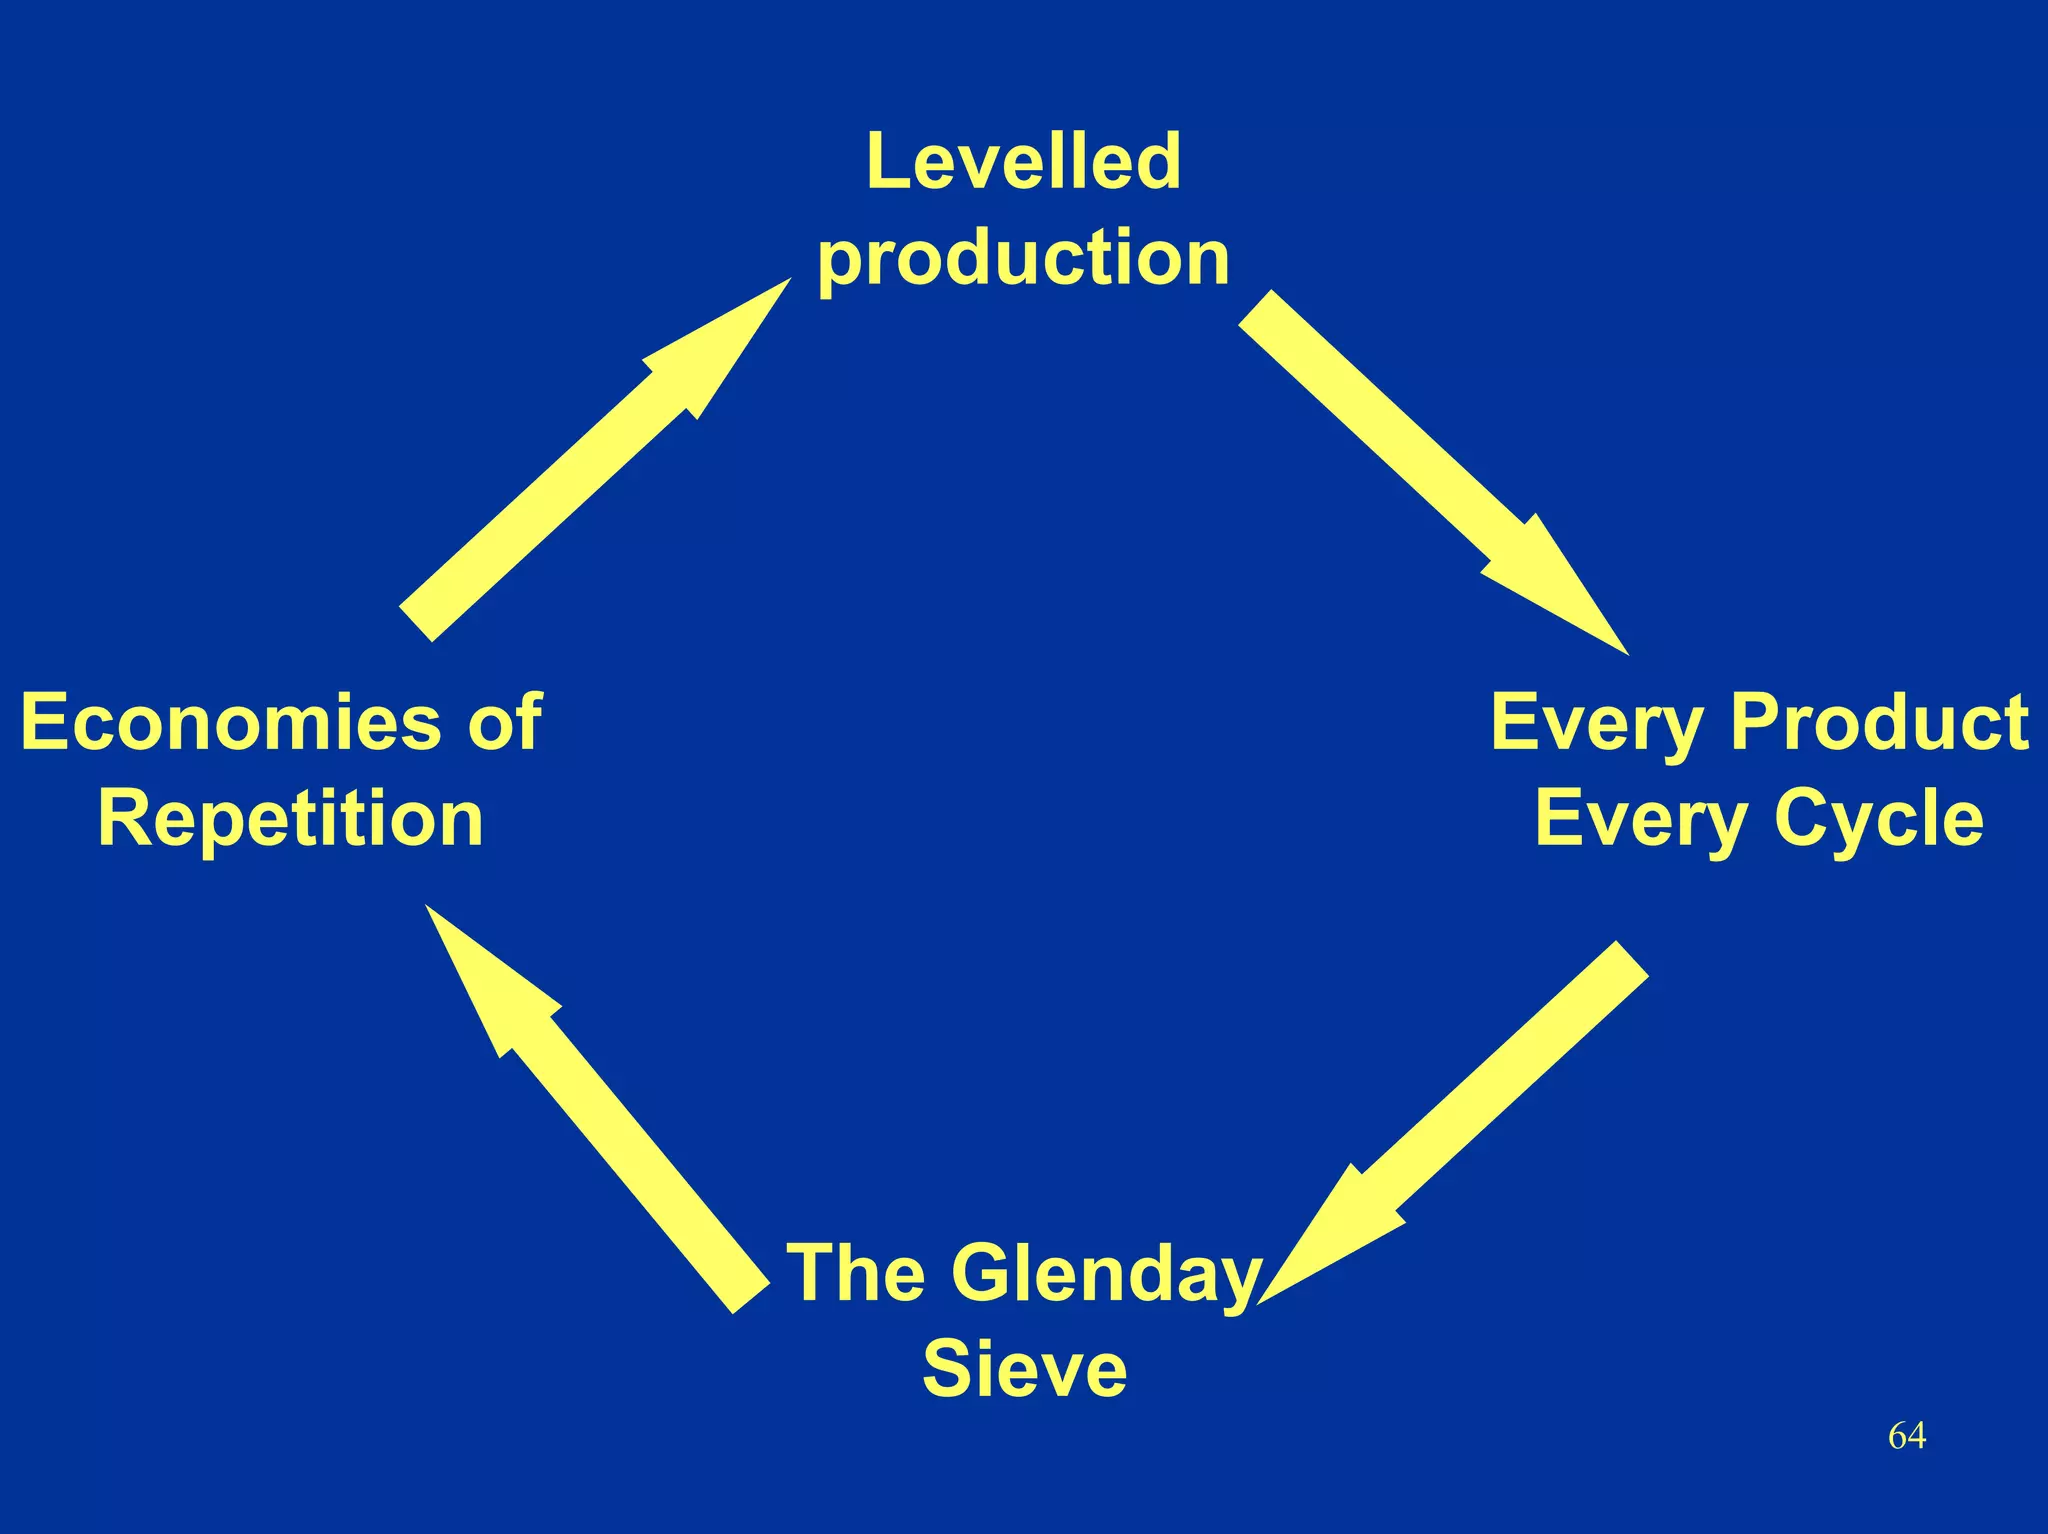
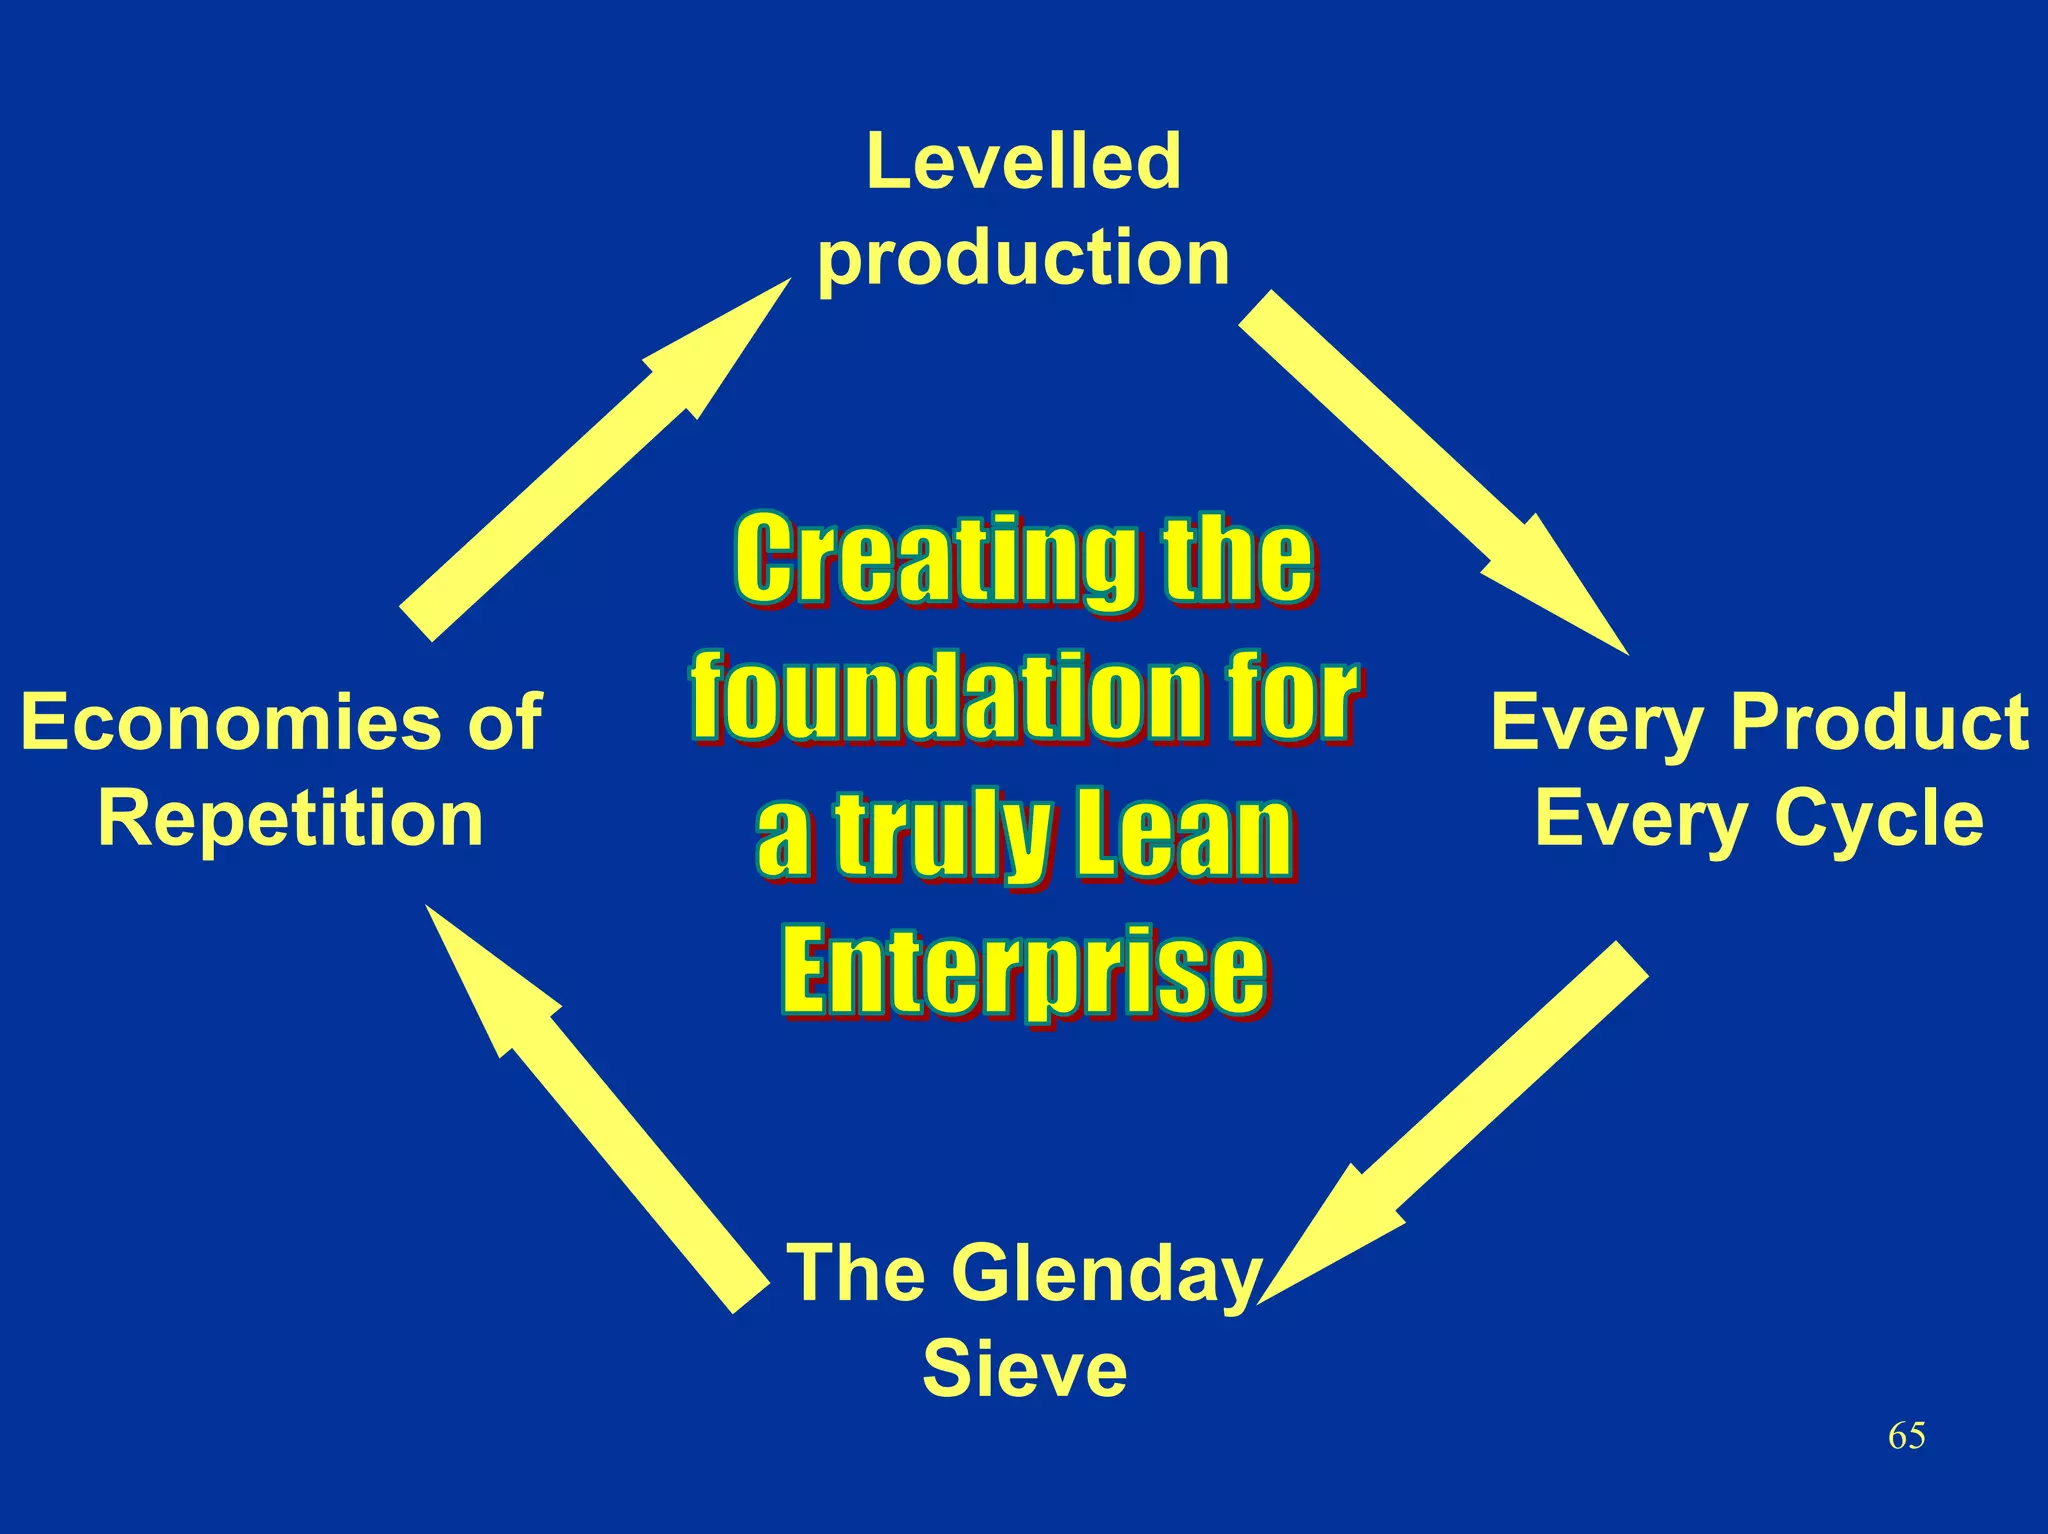

The document outlines a strategic methodology for improving production efficiency through the Glenday Sieve and value stream mapping, focusing on categorizing products by sales and their flow in the production cycle. It emphasizes the need for reducing non-value-added waste, increasing the capacity of green products, and harmonizing packaging to improve overall performance while addressing barriers to flow. Additionally, it highlights the importance of accurate sales forecasting and stable production scheduling to enhance predictability and operational success.