![Growth Indicators
GDP Growth Rates Q1 Q2 Q3 Q4 FY
2011-12 7.7* 7.7*
2010-11 8.8* 8.9 8.3 7.8 8.5
GDP[at Constant(2004-05) prices] Q1 Rs.Crore YoY Growth Q1 Rs.Crore YoY Growth
2010-11* (Share in 2011-12* (Share in
GDP) GDP)
(%) (%)
1 Agriculture, Forestry &
Fishing 160,771 2.4 167,091 3.9
2 Mining & Quarrying 26,354 7.4 26,832 1.8
3 Manufacturing
183,488 10.6 196,699 7.2
4 Electricity, Gas & Water
Supply. 23,204 5.5 25,042 7.9
5 Construction
93,514 7.7 94,639 1.2
6 Trade, Hotels, Transport
and Communication 299,600 12.1 337,872 12.8
7 Financing, Insurance,
Real Estate & Business
Services. 205,870 9.8 224,574 9.1
8 Community, Social &
Personal Services. 145,485 8.2 153,589 5.6
9 GDP at factor cost
(1 to 8) 1,138,286 8.8 1,226,339 7.7
10 Private final consumption
expenditure
748,395 9.5 (61.7) 795,683 6.3 (60.5)
11 Government final
consumption expenditure
134,161 6.7 (11.1) 136,935 2.1 (10.4)
12 Gross fixed capital
formation 380,544 11.1 (31.4) 410,533 7.9 (31.2)
13 Changes in stocks 43,788 (3.6) 45,852 (3.5)
14 Valuables 29,240 (2.4) 40,723 (3.1)
15 Exports
257,587 9.8 (21.2) 320,247 24.3 (24.3)
16 Less Imports 351,037 15.2 (28.9) 433,824 23.6 (33.0)
17 Discrepancies -30,058 (-2.5) -755 (-0.1)
18 GDP at market price
(10 to 17) 1,212,620 9.1 (100) 1,315,395 8.5 (100)
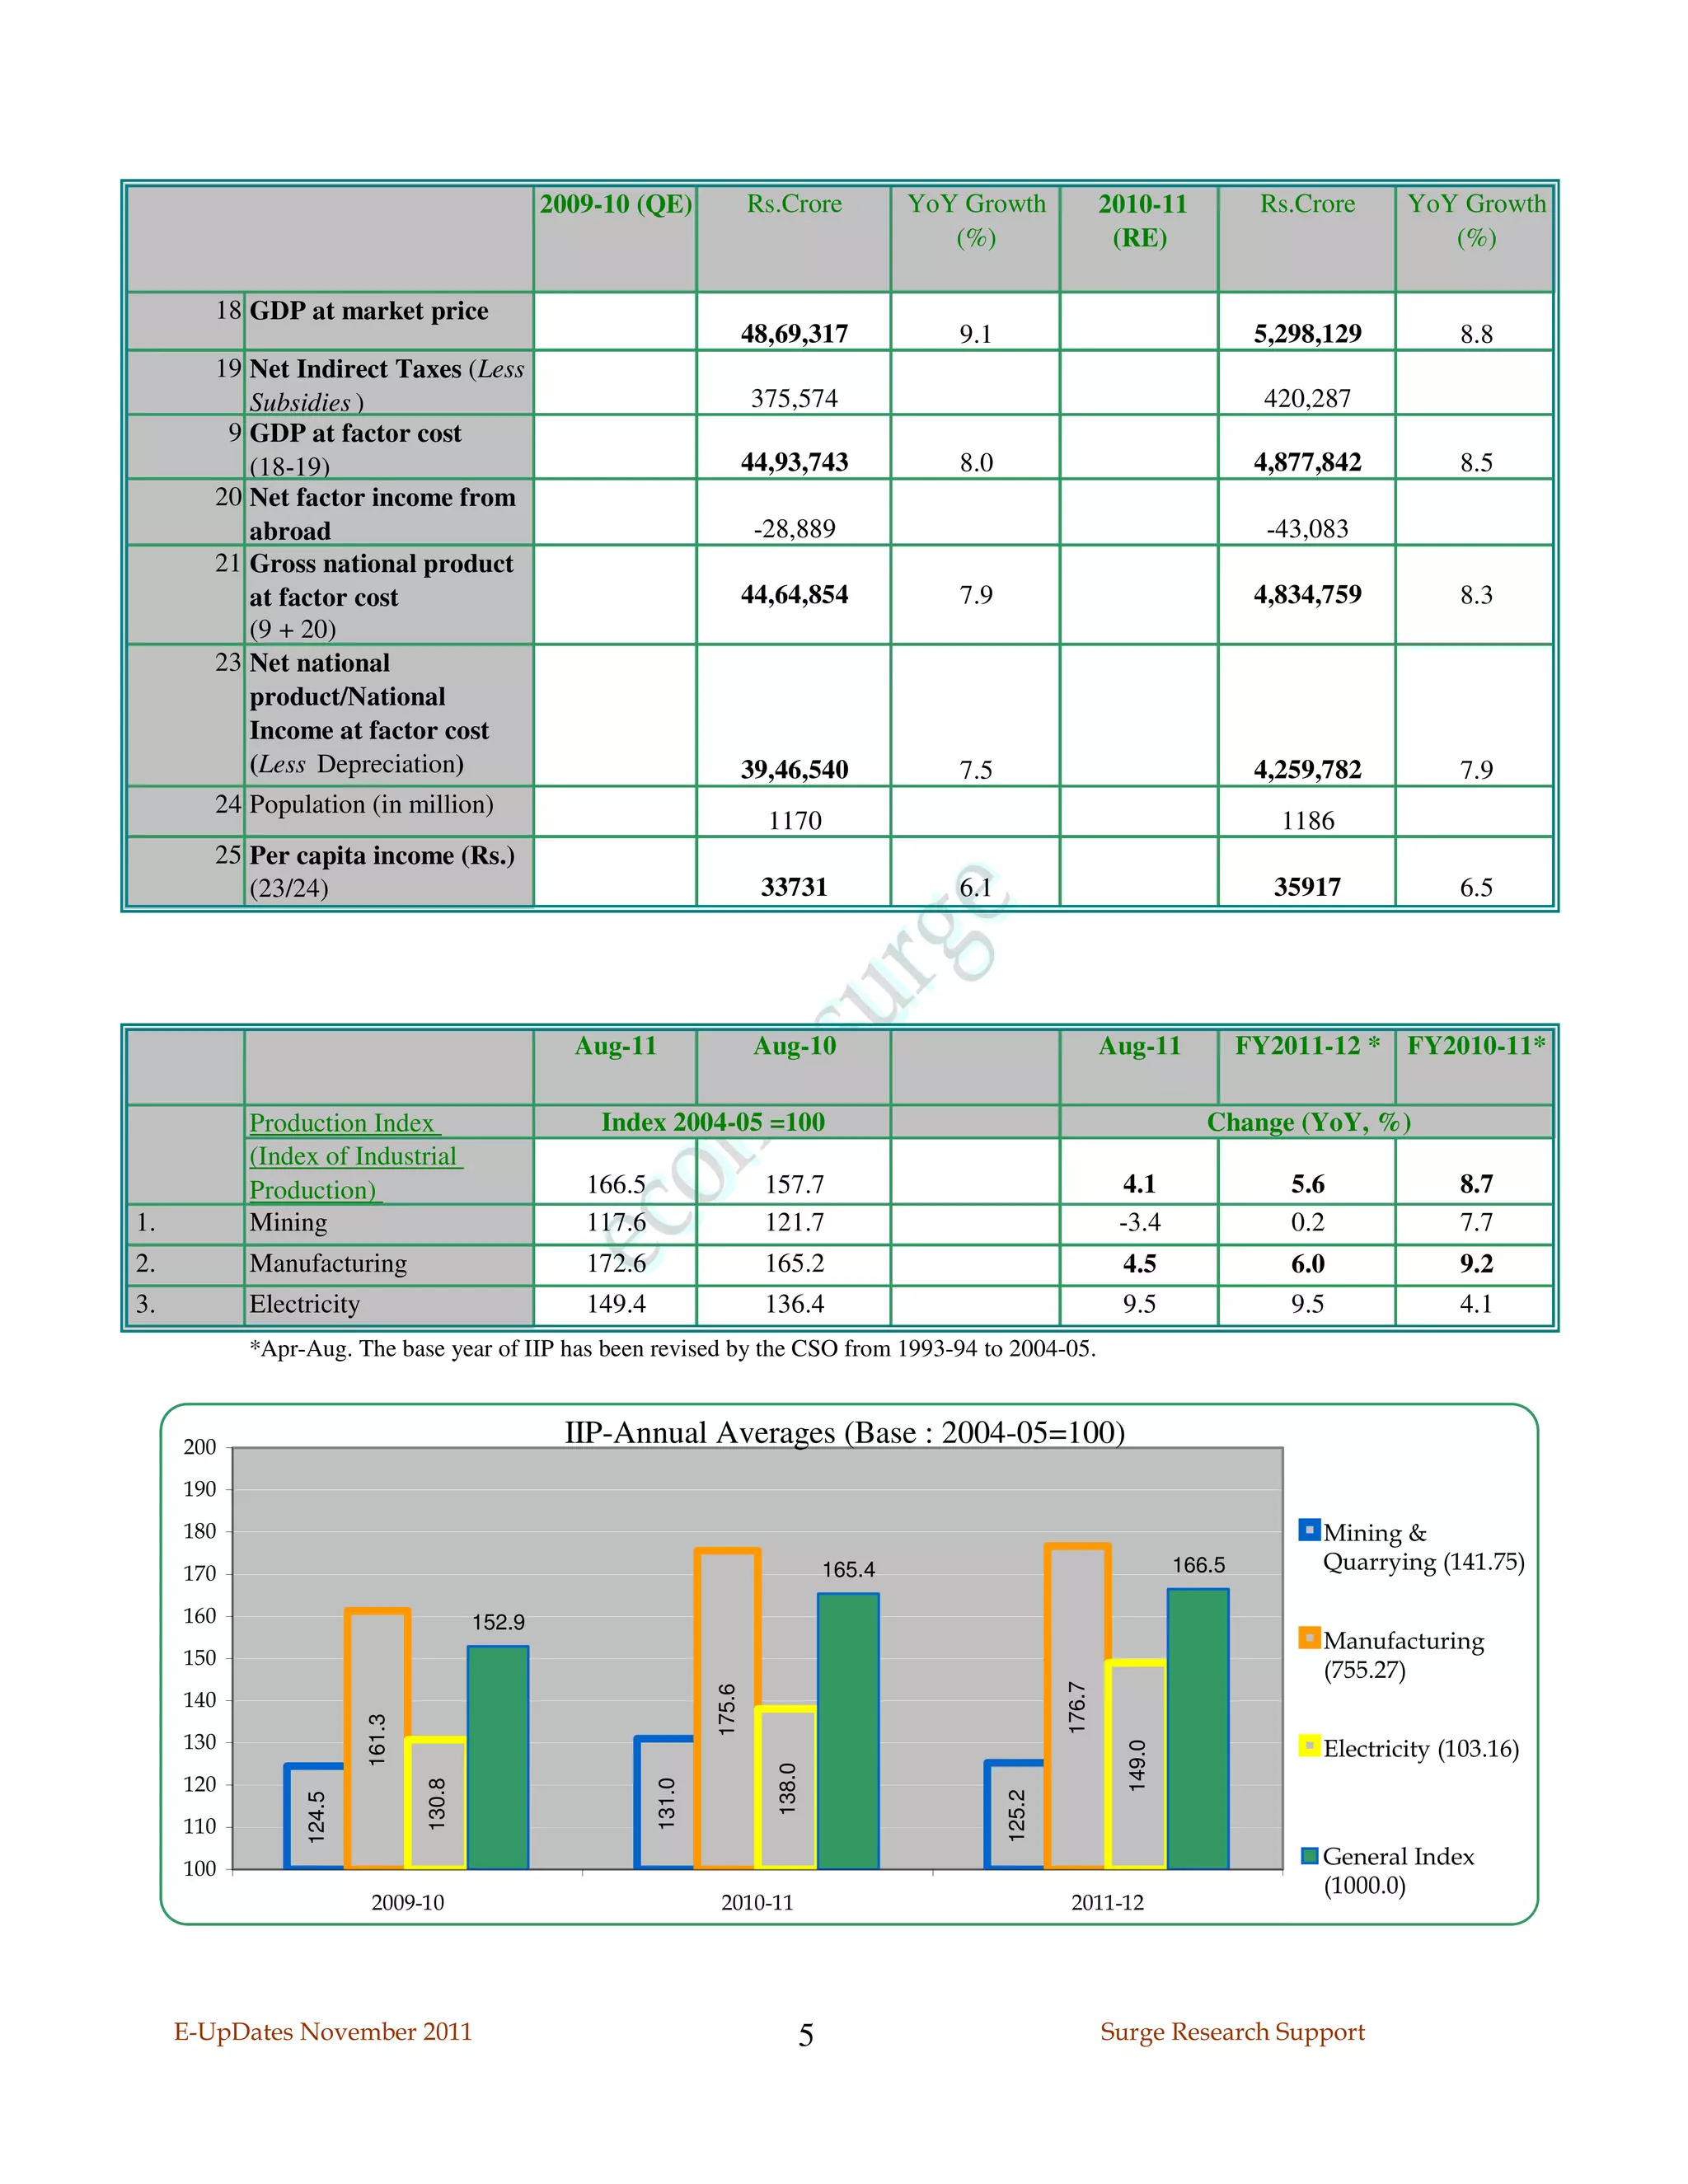
*Estimates based on the New series of IIP.
E-UpDates November 2011 4 Surge Research Support](https://image.slidesharecdn.com/eupdtsnov11-111110030106-phpapp01/75/E-UpDates-November11-Global-and-Indian-Economic-Indicators-4-2048.jpg)
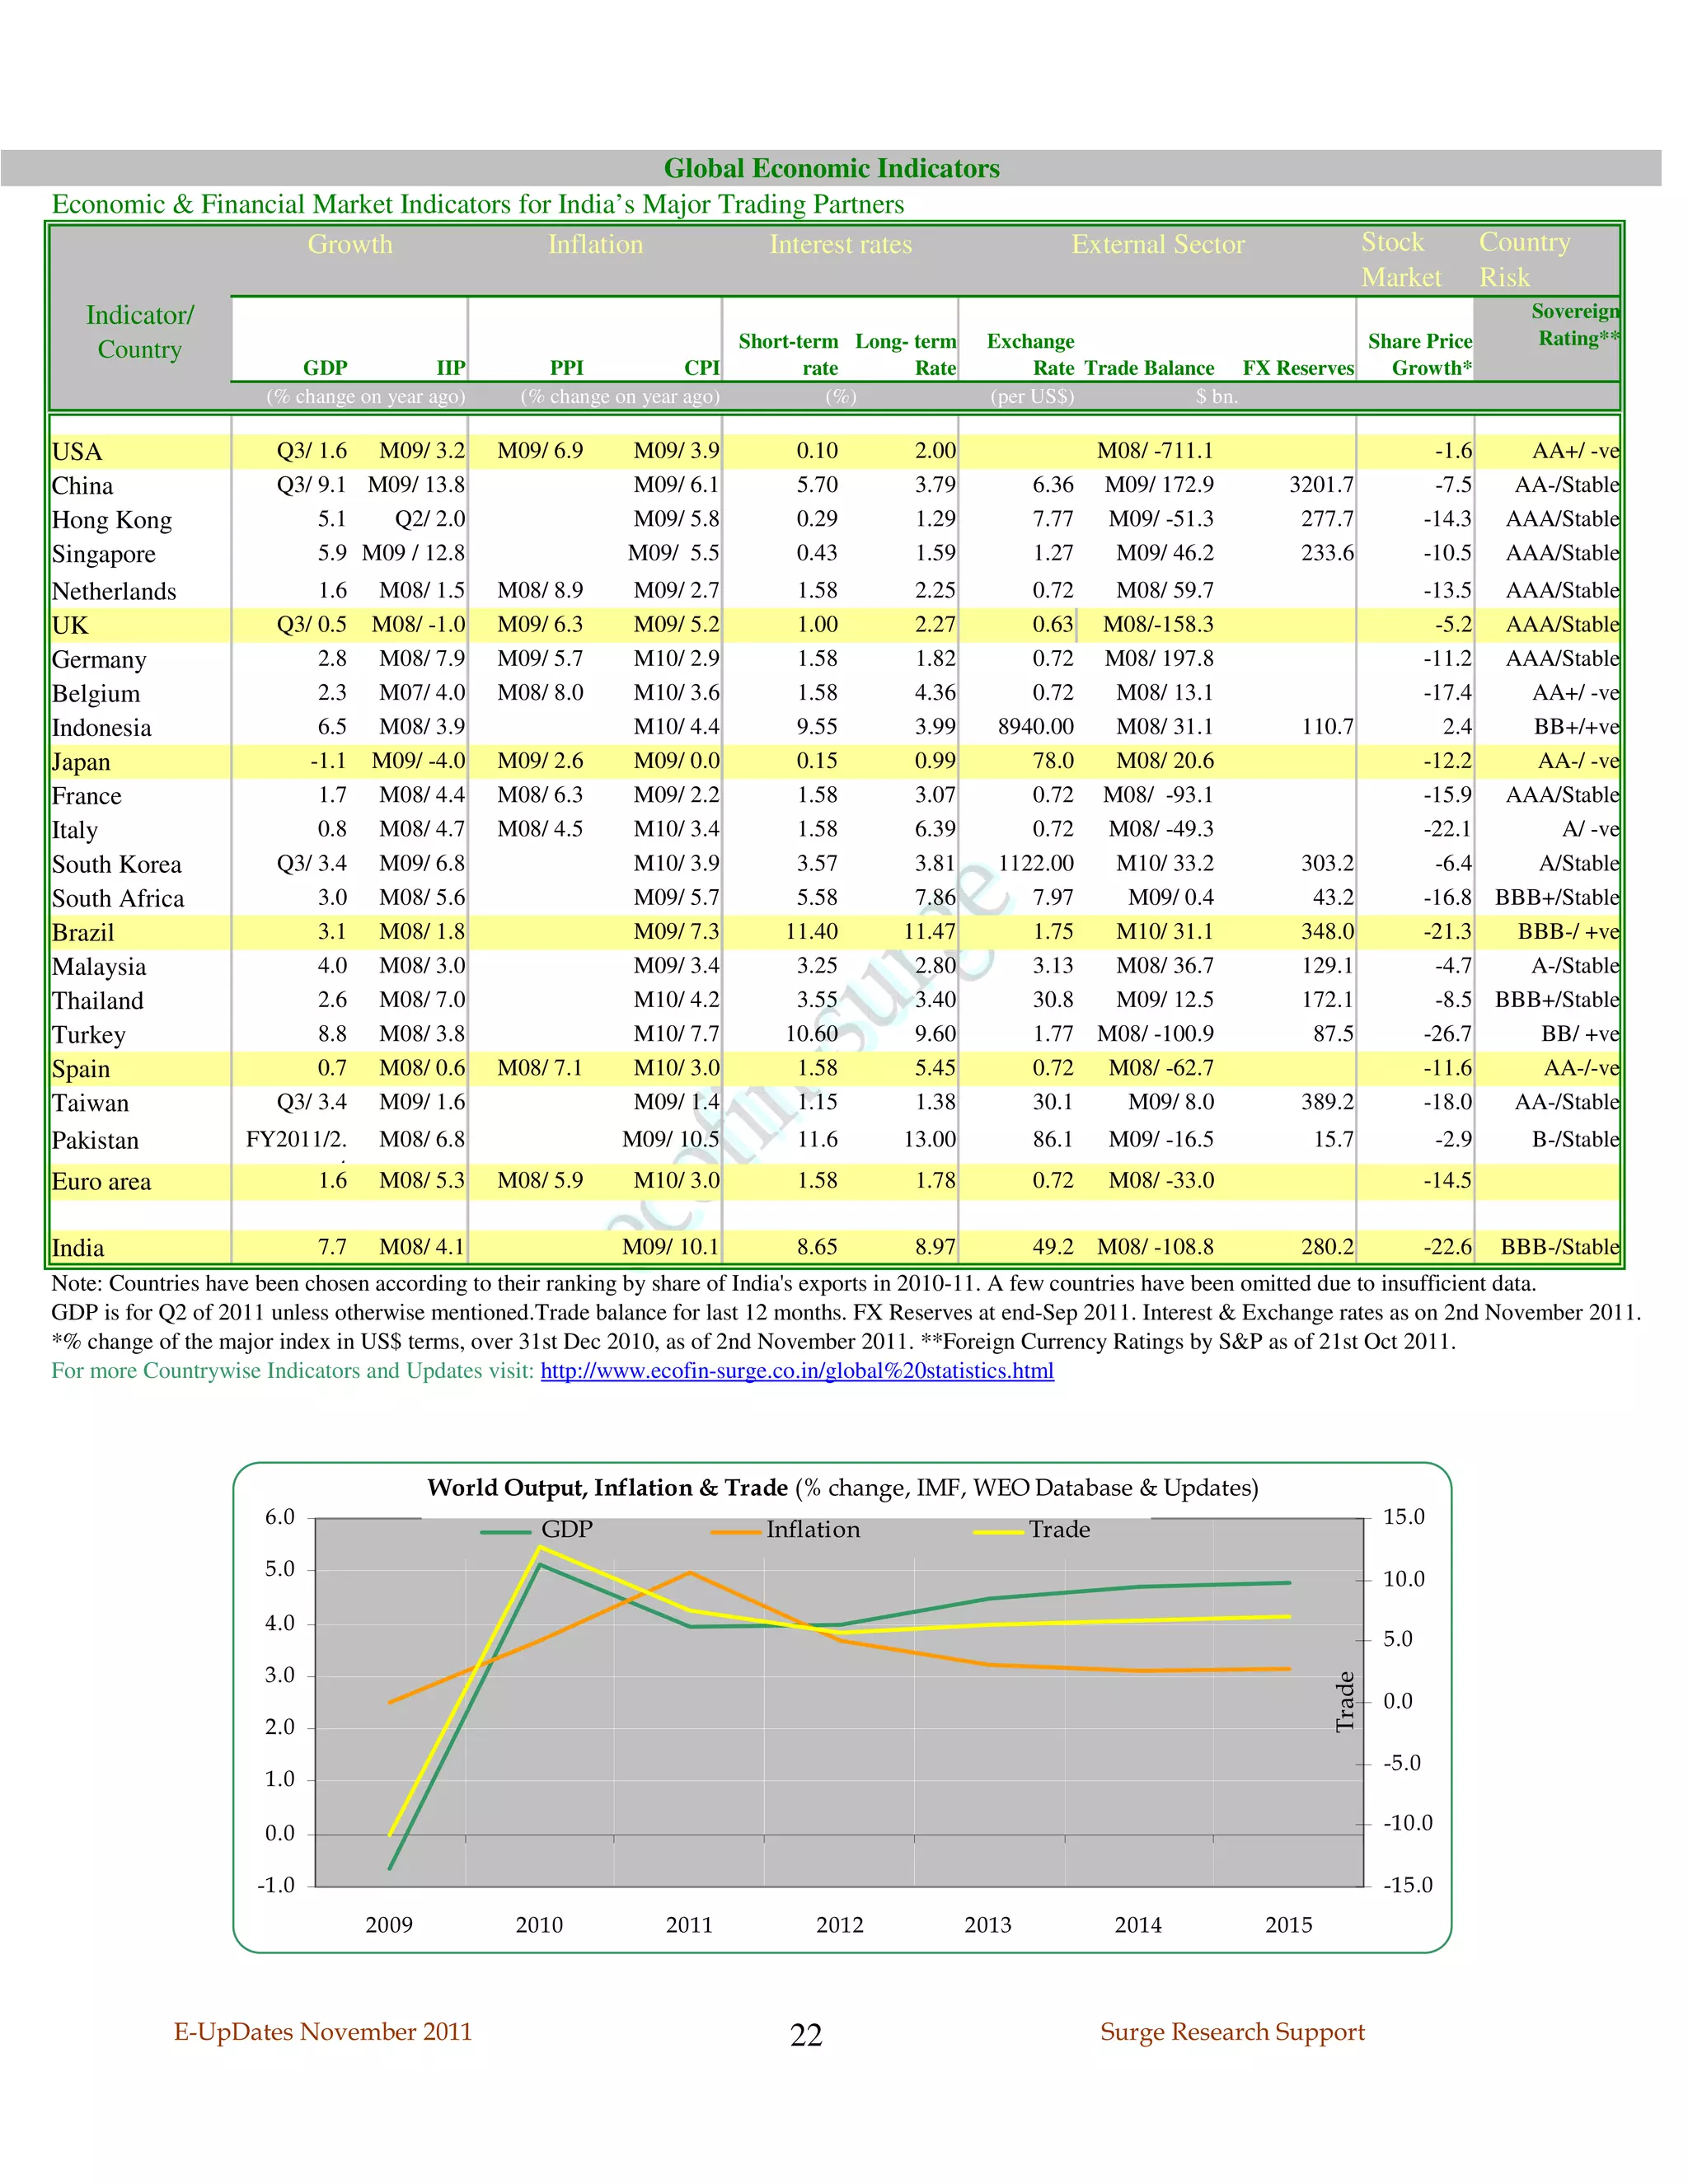

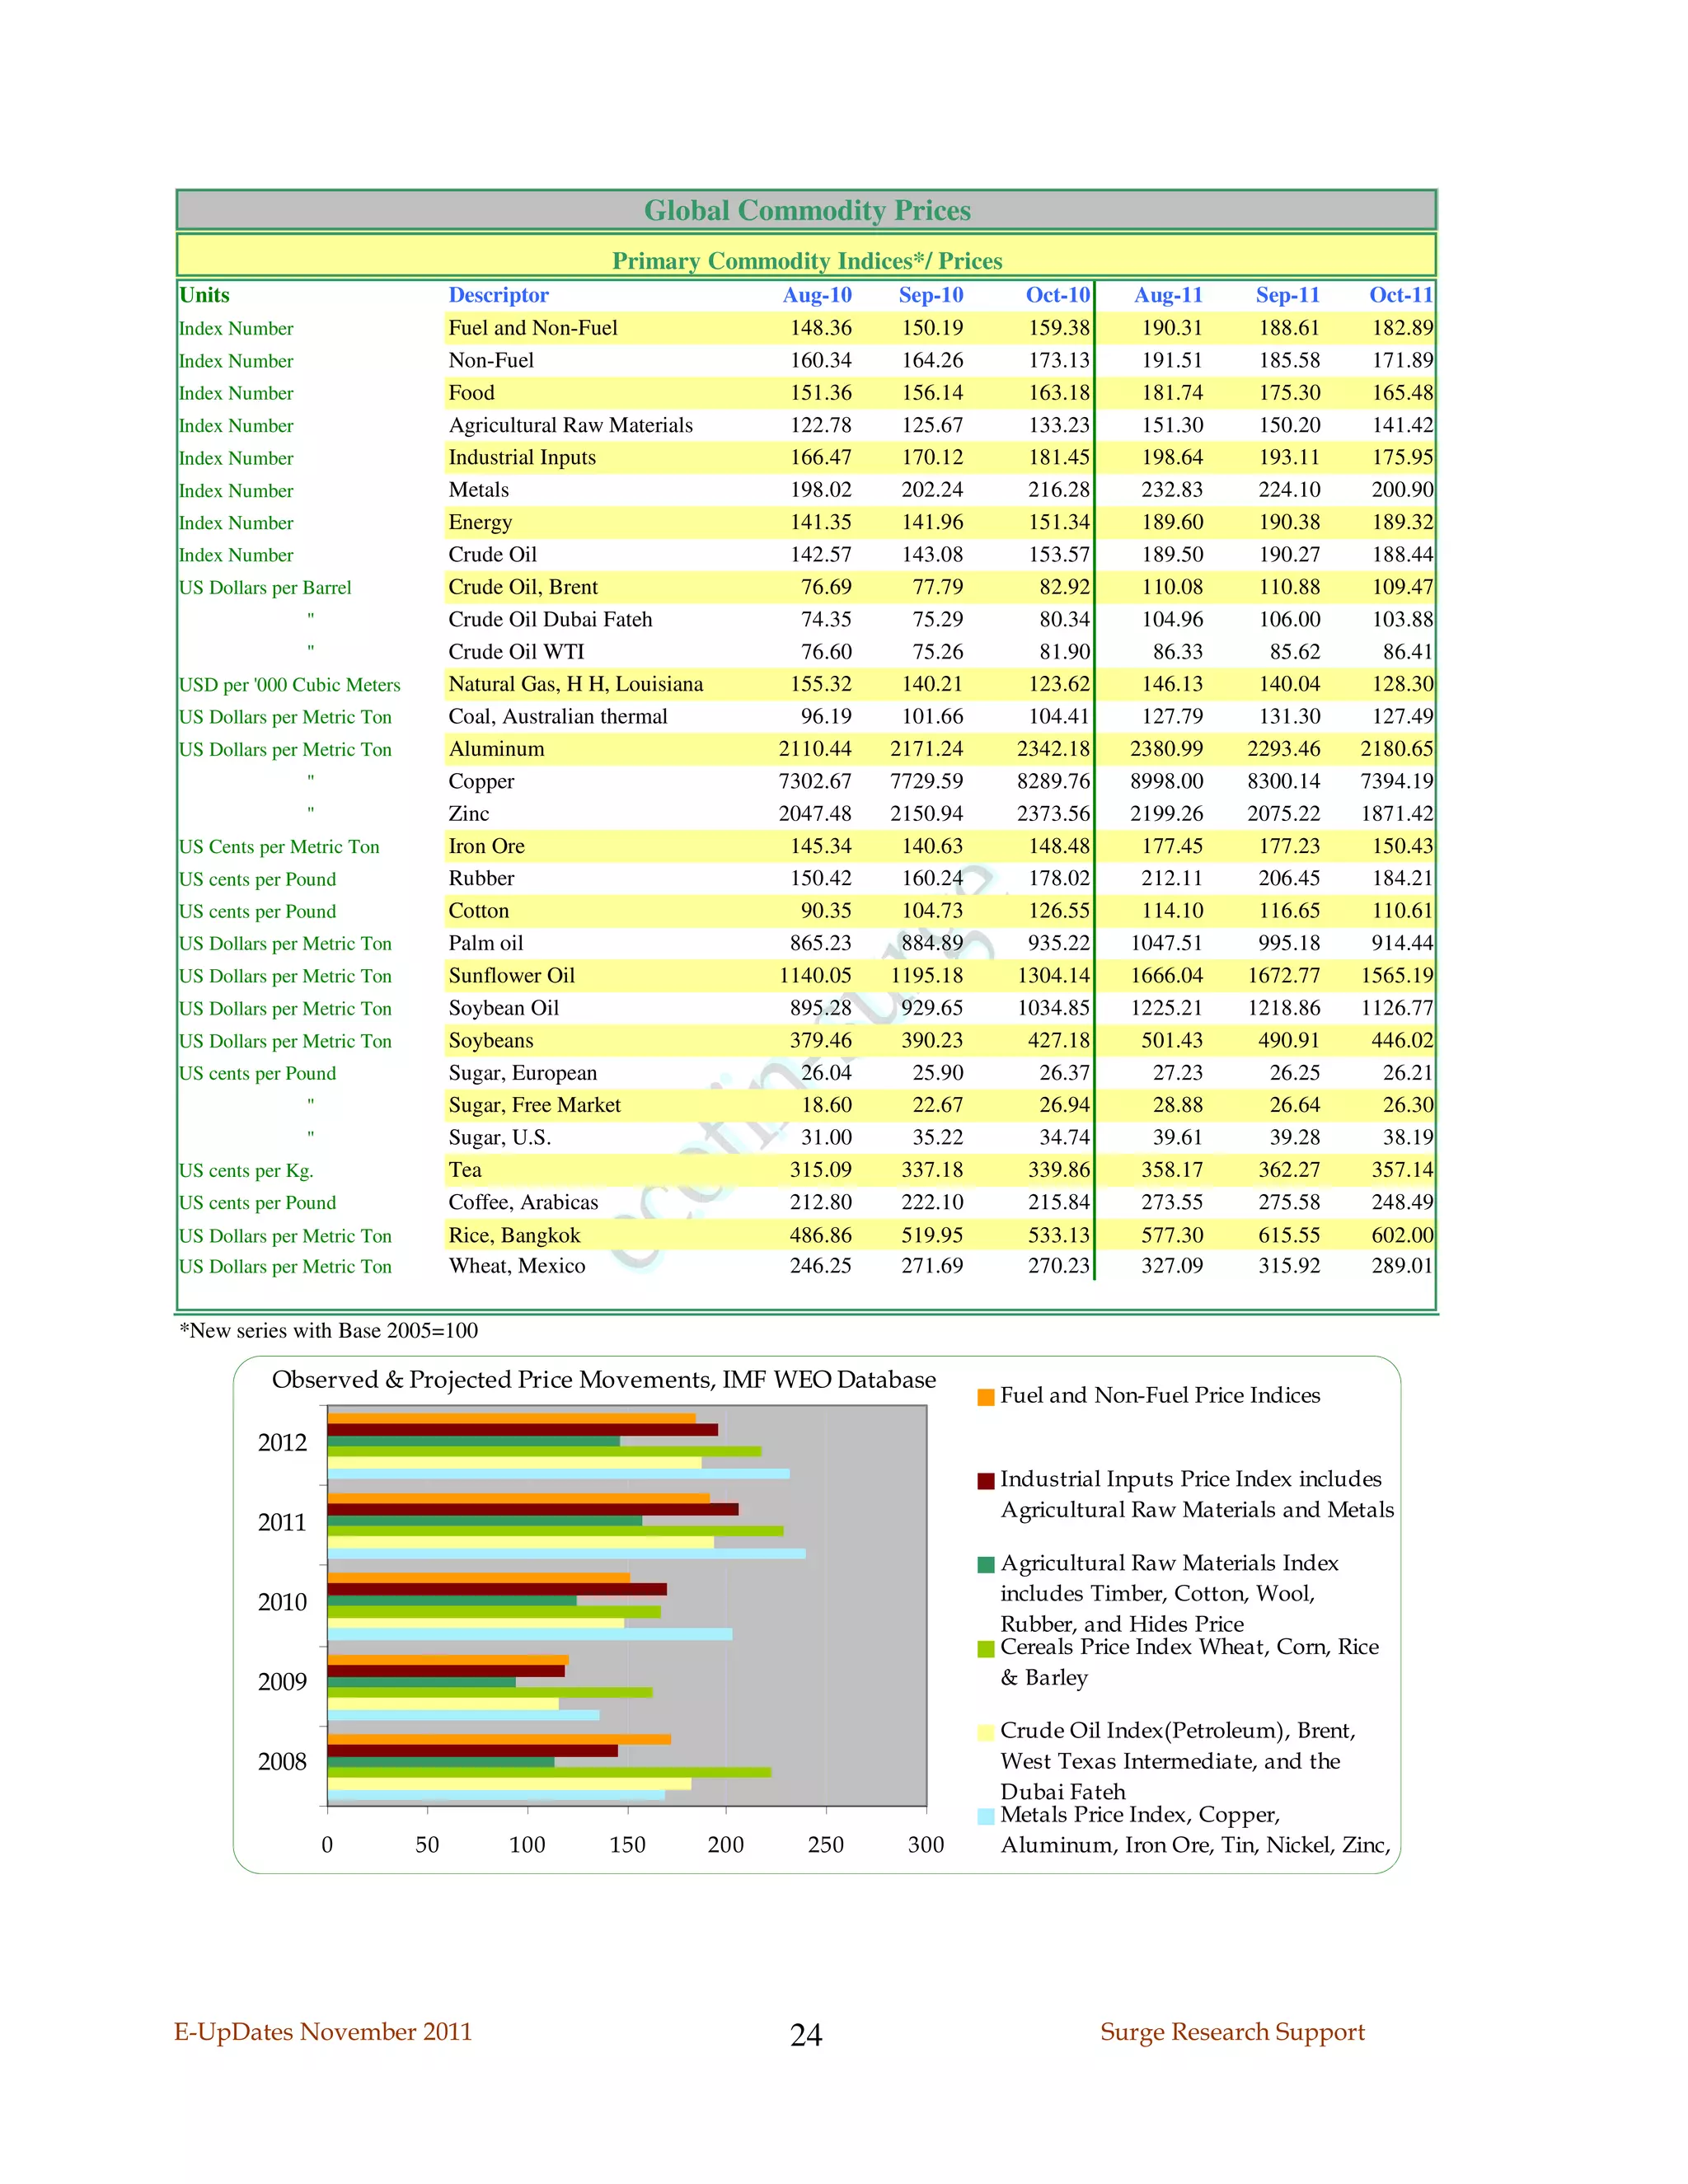


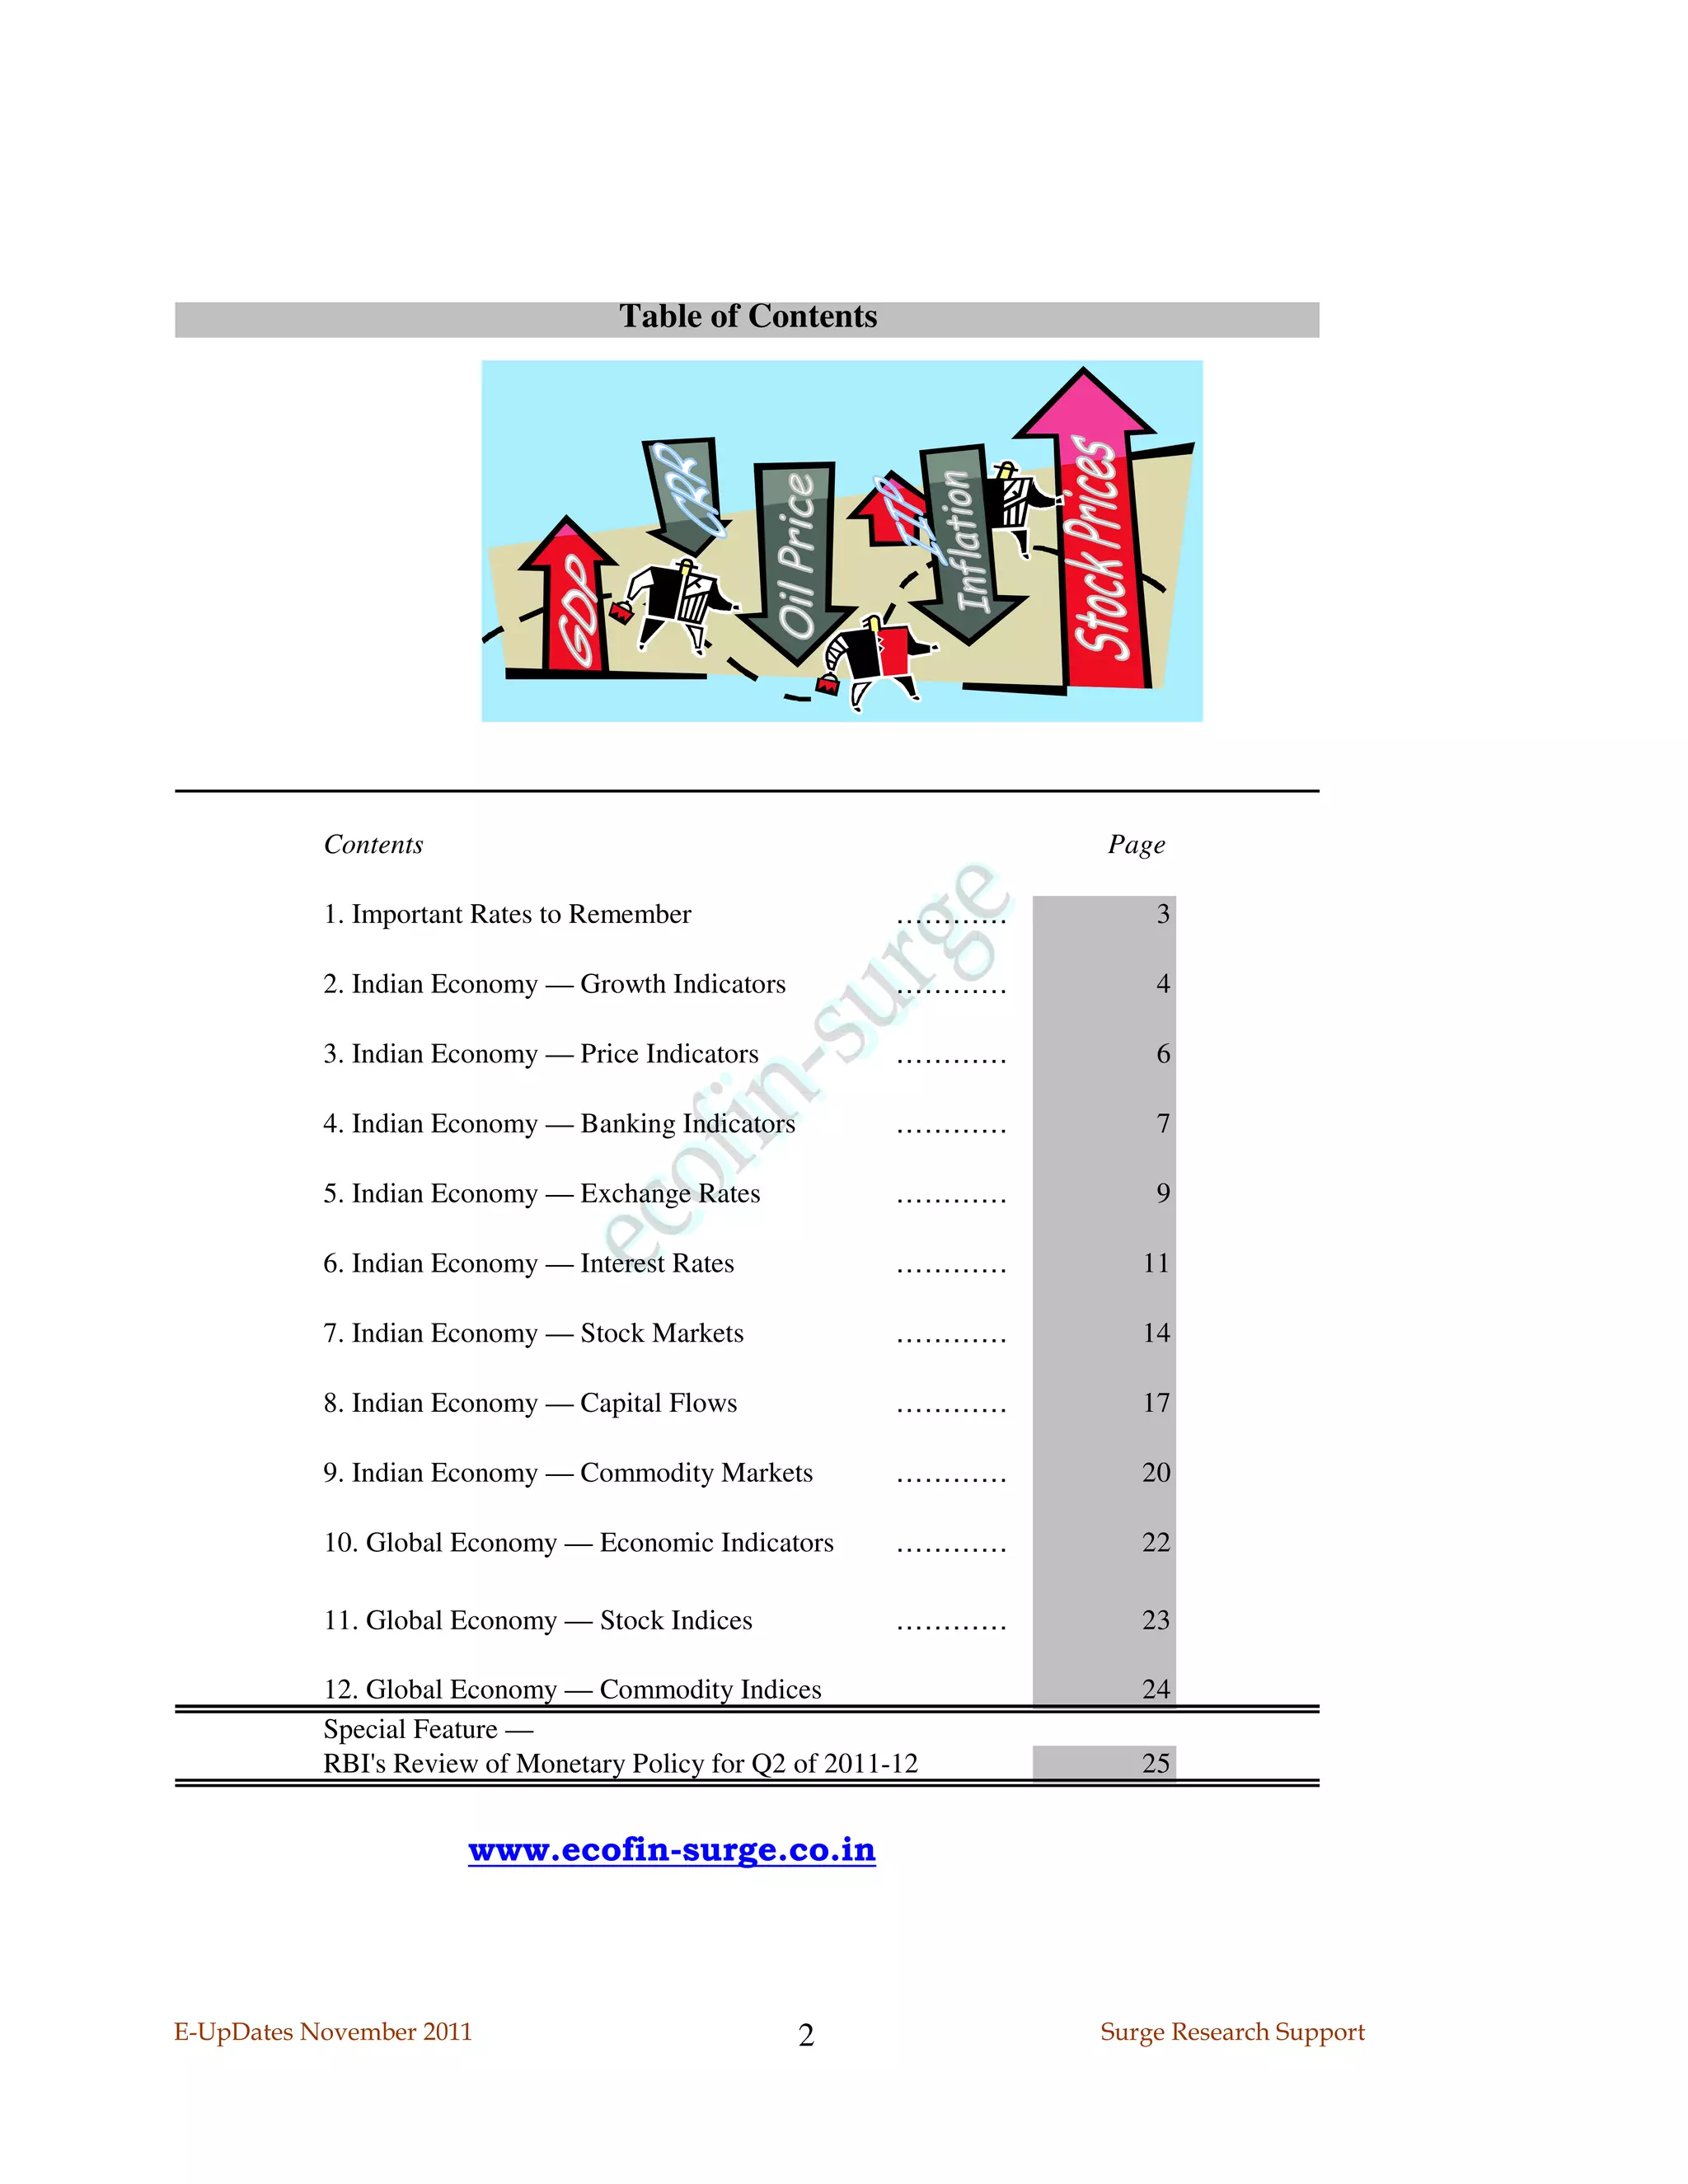
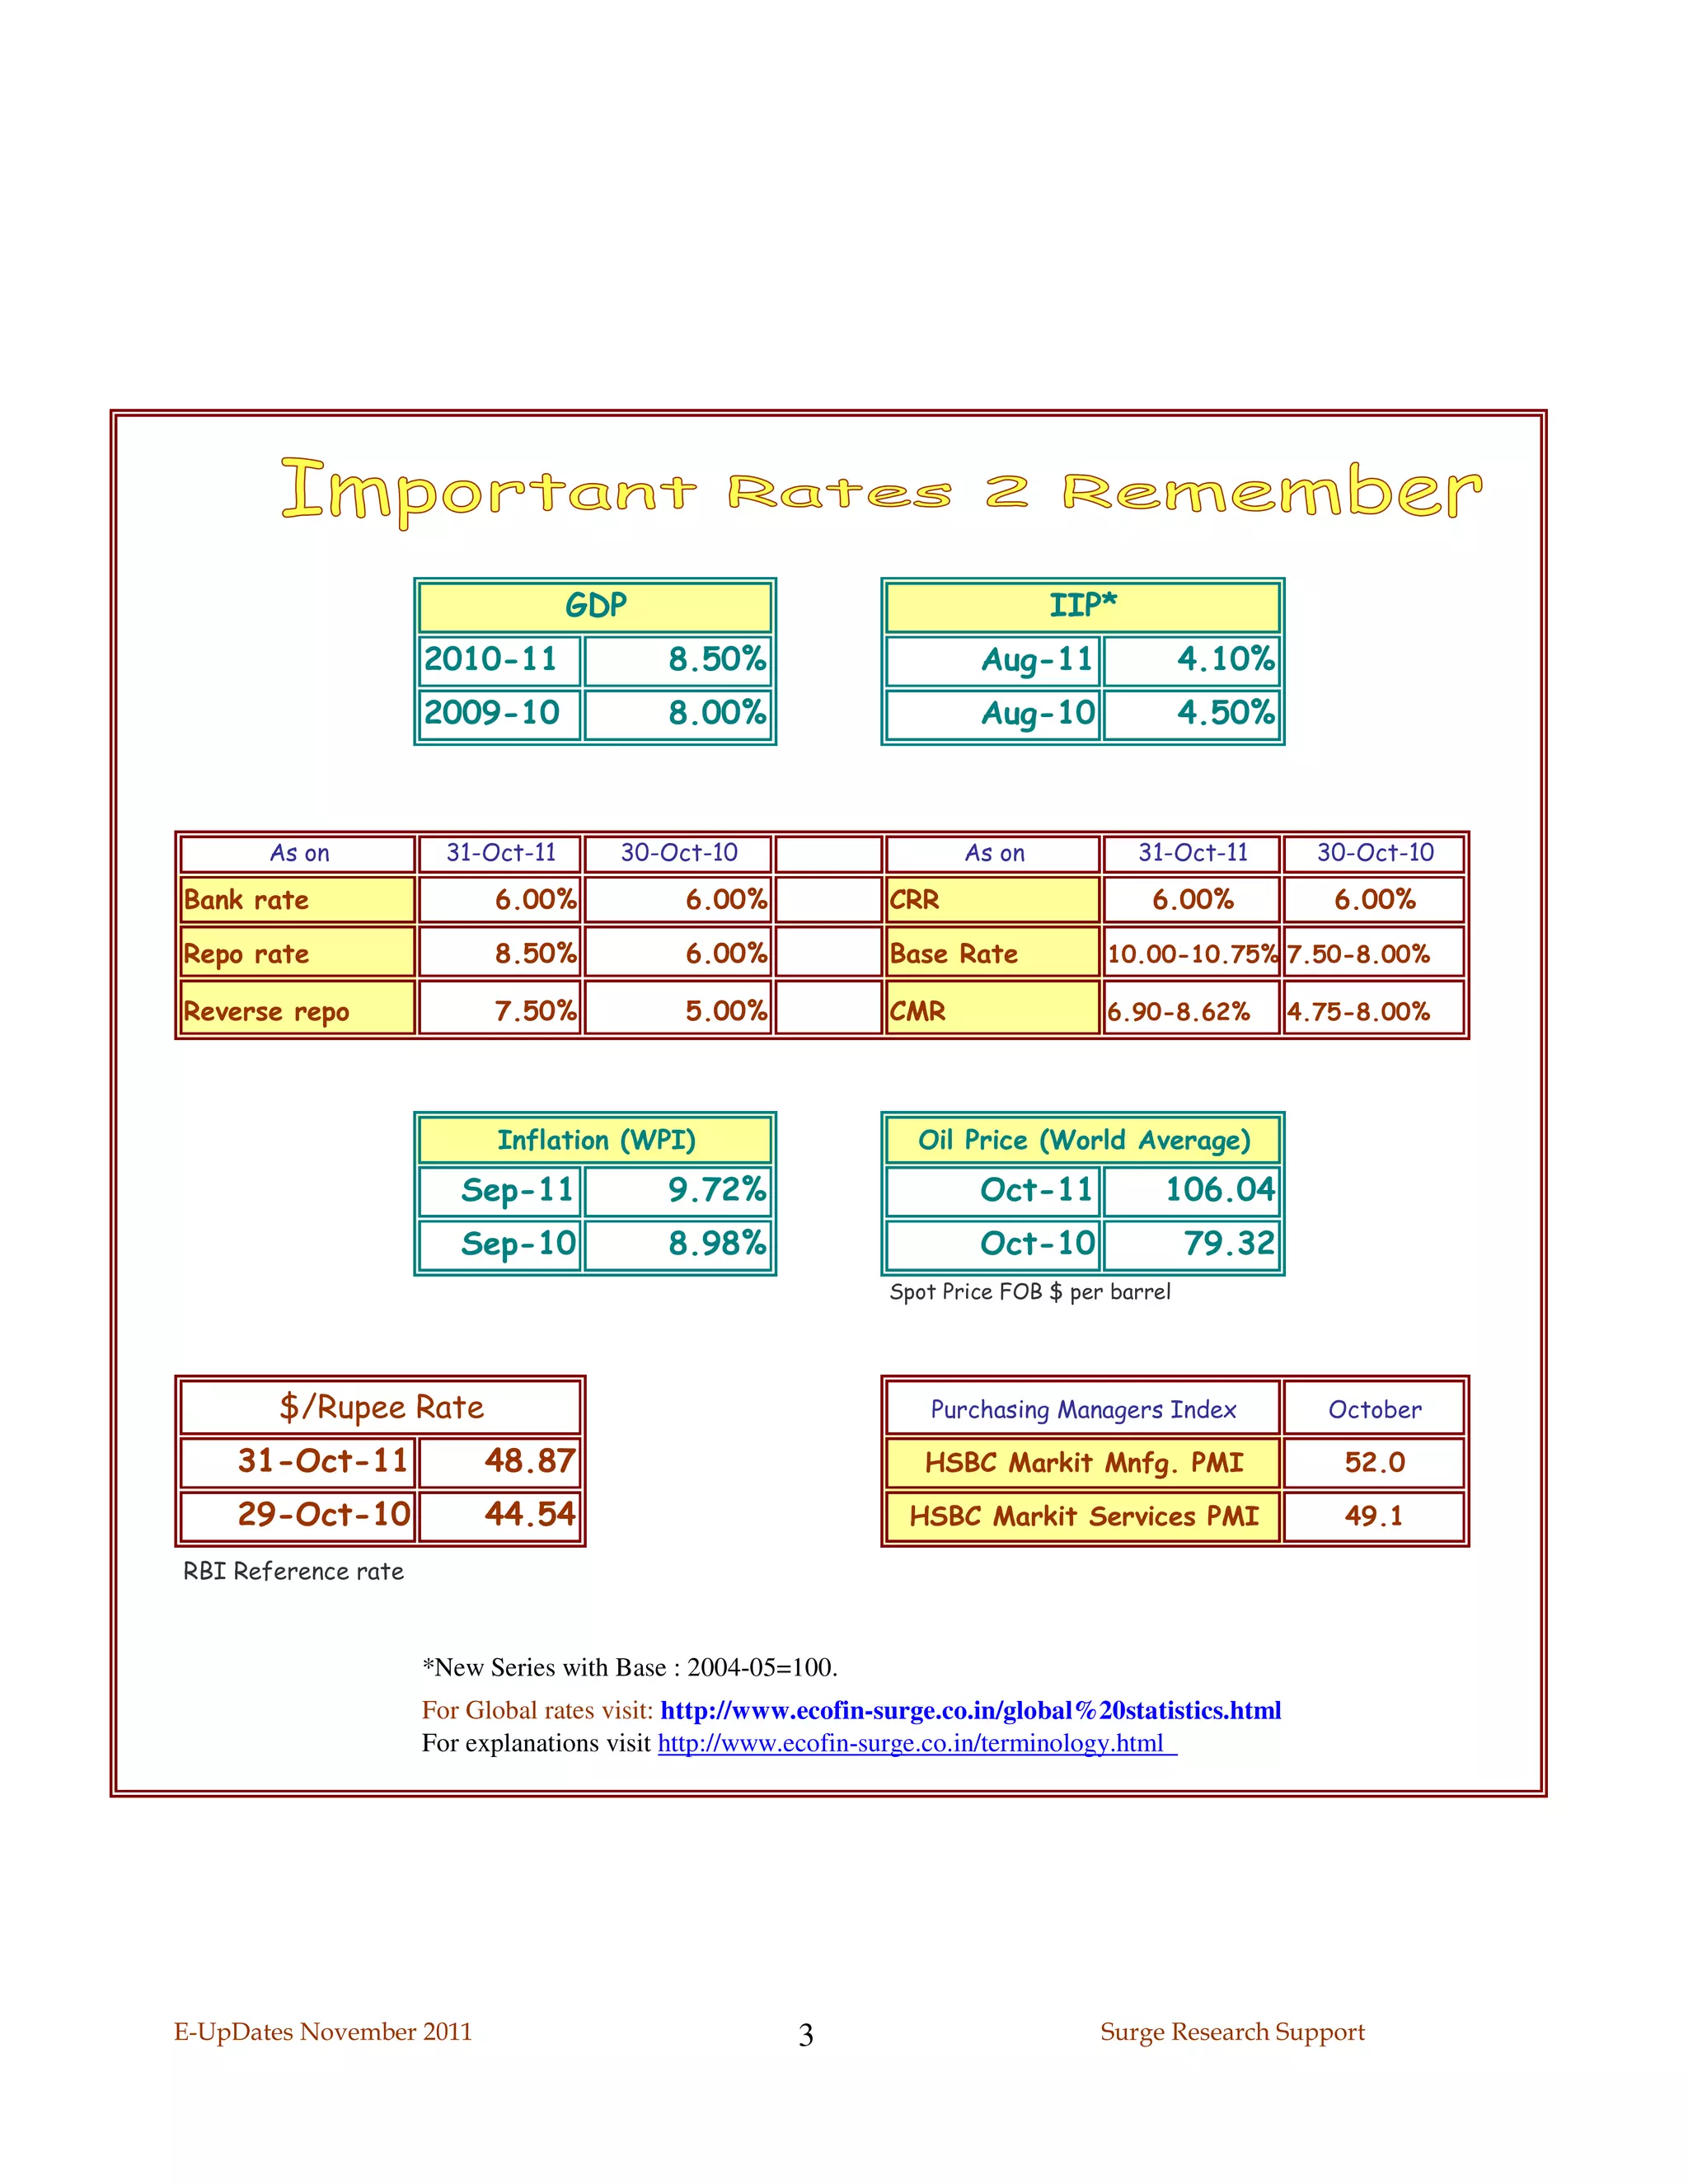
The document provides a comprehensive overview of economic indicators for the Indian and global economies as of November 2011, including GDP growth rates, inflation, banking indicators, and stock market performance. Key data points such as interest and exchange rates, capital flows, and commodity market insights are also detailed. Additionally, a special feature on the Reserve Bank of India's monetary policy review for Q2 of 2011-12 is included.


