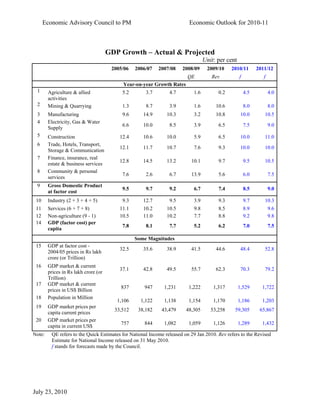
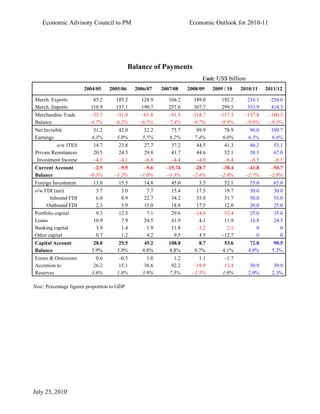
Economic Advisory Council to PM                         Economic Outlook for 2010-11

                                          Highlights
•       Economy to grow at 8.5 per cent in 2010-11 and 9.0 % in 2011-12

          o Agriculture grew at 0.2% in 2009-10. Projected to grow at 4.5% in 2010-11 and 4.0%
            in 2011-12.
          o Industry grew at 9.3% in 2009-10. Projected to grow at 9.7% in 2010-11 and 10.3 %
            in 2011-12.
          o Services grew at 8.5% in 2009-10. Projected to grow at 8.9% in 2010-11 and 9.8% in
            2011-12.

•        Slow recovery in global economic and financial situation

•       Rising domestic Savings and Investment chief engines of growth

          o Investment rate is expected to be 37% in 2010-11 and 38.4% in 2011-12.

          o Domestic savings rate is expected to be over 34% in 2010-11 and close to 36% in
            2011-12.

•       Current Account deficit estimated at 2.7% of GDP in 2010-11 and 2.9% of GDP in
        2011-12
         o Merchandise trade deficit projected to be $ 137.8 billion or 9% of the GDP in 2010-
             11 and $160 billion or 9.3% of GDP in 2011-12.

          o Invisibles trade surplus projected to be $ 96 billion or 6.3% of the GDP in 2010-11
            and $109.7 billion or 6.4% in 2011-12.

•        Capital Flows can be readily absorbed by financing needs of the high growth of the
         Indian Economy.

          o Against the level of $53.6 billion in 2009-10, the capital inflows projected to be $ 73
            billion for 2010-11 and $91 billion for 2011-12.

          o Accretion to reserves was $13.4 billion in 2009-10. Projected to be $30.9 billion in
            2010-11 and $39.8 billion in 2011-12.

•       Inflation rate projected at 6.5 % by March 2011 due to expected normal monsoon
        combined with the base effect.

          o The provisional headline inflation was above 10% in June 2010.

          o Controlling high inflation rate essential for sustainable growth in medium term.

          o Available food stocks must be released to have a dampening effect on prices.


July 23, 2010
Economic Advisory Council to PM                          Economic Outlook for 2010-11


•        Monetary Policy to complete the process of exit and operate with bias toward
         tightening.

          o Credit off take picked up. Strong growth rate in the 1st quarter of 2010-11.

          o Fund flow from capital market to commercial sector quite strong. Bond issuance
            growth relatively higher than issuance of equity.

          o Liquidity conditions are taut enough for monetary policy signals to be appropriately
            transmitted to the financial sector. A bias toward tightening is necessary.

          o Exchange rate variations will remain within acceptable range.

•      Exit from the expansionary fiscal policy not only feasible but also necessary

          o High buoyancy in direct and indirect tax collections. Telecom auctions and decontrol
            of the petroleum products prices to provide additional cushion.

          o Fiscal deficit outturn may be lower than the budgeted consolidated fiscal deficit of
            8.4% of GDP for 2010-11.

          o Revenue Deficit as a ratio of GDP expected to decline from 6.3% in 2009-10 to 4.6%
            in 2010-11.

          o Operationalization of Goods and Services Tax (GST) should be a priority.

          o Budgeted level of Fiscal Deficit and Revenue Deficit still beyond comfort zone.

          o Need to rationalize the food and fertilizer subsidies.

•       To sustain a growth rate of 9.0 per cent, focus is required on:

          o Containing inflation

          o Improving farm productivity

          o Closing the large physical infrastructure deficit, especially in the power sector


July 23, 2010
Economic Advisory Council to PM                                    Economic Outlook for 2010-11


                                      GDP Growth – Actual & Projected
                                                                                 Unit: per cent
                                       2005/06   2006/07   2007/08    2008/09     2009/10    2010/11        2011/12
                                                                        QE          Rev           f            f
                                           Year-on-year Growth Rates
 1      Agriculture & allied               5.2       3.7        4.7        1.6         0.2            4.5          4.0
        activities
 2      Mining & Quarrying                 1.3       8.7        3.9        1.6        10.6            8.0          8.0
 3      Manufacturing                      9.6      14.9       10.3        3.2        10.8         10.0        10.5
 4      Electricity, Gas & Water
                                           6.6      10.0        8.5        3.9         6.5            7.5          9.0
        Supply
 5      Construction                      12.4      10.6       10.0        5.9         6.5         10.0        11.0
 6      Trade, Hotels, Transport,
                                          12.1      11.7       10.7        7.6         9.3         10.0        10.0
        Storage & Communication
 7      Finance, insurance, real
                                          12.8      14.5       13.2       10.1         9.7            9.5      10.5
        estate & business services
 8      Community & personal
                                           7.6       2.6        6.7       13.9         5.6            6.0          7.5
        services
 9      Gross Domestic Product
                                           9.5       9.7        9.2        6.7         7.4            8.5          9.0
        at factor cost
 10     Industry (2 + 3 + 4 + 5)           9.3      12.7        9.5        3.9         9.3            9.7      10.3
 11     Services (6 + 7 + 8)              11.1      10.2       10.5        9.8         8.5            8.9          9.6
 12     Non-agriculture (9 - 1)           10.5      11.0       10.2        7.7         8.8            9.2          9.8
 14     GDP (factor cost) per
                                           7.8       8.1        7.7        5.2         6.2            7.0          7.5
        capita
                                                 Some Magnitudes
 15     GDP at factor cost -
                                          32.5      35.6       38.9       41.5        44.6         48.4        52.8
        2004/05 prices in Rs lakh
        crore (or Trillion)
 16     GDP market & current
                                          37.1      42.8       49.5       55.7        62.3         70.3        79.2
        prices in Rs lakh crore (or
        Trillion)
 17     GDP market & current
                                          837       947      1,231       1,222       1,317        1,529       1,722
        prices in US$ Billion
 18     Population in Million
                                         1,106     1,122     1,138       1,154       1,170        1,186       1,203
 19     GDP market prices per
                                        33,512    38,182    43,479      48,305      53,258     59,305        65,867
        capita current prices
 20     GDP market prices per
                                          757       844      1,082       1,059       1,126        1,289       1,432
        capita in current US$
Note:    QE refers to the Quick Estimates for National Income released on 29 Jan 2010. Rev refers to the Revised
         Estimate for National Income released on 31 May 2010.
         f stands for forecasts made by the Council.


July 23, 2010
Economic Advisory Council to PM                                  Economic Outlook for 2010-11


                                             Balance of Payments
                                                                           Unit: US$ billion
                       2004/05    2005/06      2006/07    2007/08    2008/09    2009 / 10   2010/11     2011/12

Merch. Exports             85.2       105.2       128.9      166.2     189.0        182.2     216.1       254.0
Merch. Imports            118.9       157.1       190.7      257.6     307.7        299.5     353.9       414.3
Merchandise Trade         –33.7       –51.9       –61.8      –91.5    –118.7       –117.3    –137.8      –160.3
Balance                  –4.7%       –6.2%       –6.5%      –7.4%     –9.7%        –8.9%     –9.0%       –9.3%
Net Invisible              31.2        42.0        52.2       75.7      89.9         78.9      96.0       109.7
Earnings                  4.3%        5.0%        5.5%       6.2%      7.4%         6.0%      6.3%        6.4%
          o/w ITES         14.7        23.8       27.7        37.2      44.5         41.3       46.2       53.1
Private Remittances        20.5        24.5       29.8        41.7      44.6         52.1       58.3       67.0
 Investment Income         –4.1        –4.1       –6.8        –4.4      –4.0         –6.4       –6.5       –6.5
Current Account            –2.5        –9.9        –9.6     –15.74     –28.7        –38.4       –41.8     –50.7
Balance                  –0.3%       –1.2%       –1.0%      –1.3%     –2.4%        –2.9%       –2.7%     –2.9%
Foreign Investment         13.0        15.5       14.8        45.0       3.5         52.1       55.0       65.0
o/w FDI (net)               3.7         3.0        7.7        15.4      17.5         19.7       30.0       30.0
       Inbound FDI          6.0         8.9       22.7        34.2      35.0         31.7       50.0       55.0
     Outbound FDI           2.3         5.9       15.0        18.8      17.5         12.0       20.0       25.0
Portfolio capital           9.3        12.5        7.1        29.6     –14.0         32.4       25.0       35.0
Loans                      10.9         7.9       24.5        41.9       4.1         11.9       16.8       24.5
Banking capital             3.9         1.4        1.9        11.8      –3.2          2.1          0          0
Other capital               0.7         1.2        4.2         9.5       4.5        –12.7          0          0
Capital Account            28.0        25.5        45.2      108.0        8.7        53.6        72.8      90.5
Balance                   3.9%        3.0%        4.8%       8.8%       0.7%        4.1%        4.8%      5.3%
Errors & Omissions          0.6        –0.5         1.0        1.2       1.1         –1.7
Accretion to               26.2        15.1        36.6       92.2     –18.9         13.4        30.9      39.8
Reserves                  3.6%        1.8%        3.9%       7.5%     –1.5%         1.0%        2.0%      2.3%

Note: Percentage figures proportion to GDP


July 23, 2010

Highlights 2010 11 Economic Outlook

  • 1.
    Economic Advisory Councilto PM Economic Outlook for 2010-11 Highlights • Economy to grow at 8.5 per cent in 2010-11 and 9.0 % in 2011-12 o Agriculture grew at 0.2% in 2009-10. Projected to grow at 4.5% in 2010-11 and 4.0% in 2011-12. o Industry grew at 9.3% in 2009-10. Projected to grow at 9.7% in 2010-11 and 10.3 % in 2011-12. o Services grew at 8.5% in 2009-10. Projected to grow at 8.9% in 2010-11 and 9.8% in 2011-12. • Slow recovery in global economic and financial situation • Rising domestic Savings and Investment chief engines of growth o Investment rate is expected to be 37% in 2010-11 and 38.4% in 2011-12. o Domestic savings rate is expected to be over 34% in 2010-11 and close to 36% in 2011-12. • Current Account deficit estimated at 2.7% of GDP in 2010-11 and 2.9% of GDP in 2011-12 o Merchandise trade deficit projected to be $ 137.8 billion or 9% of the GDP in 2010- 11 and $160 billion or 9.3% of GDP in 2011-12. o Invisibles trade surplus projected to be $ 96 billion or 6.3% of the GDP in 2010-11 and $109.7 billion or 6.4% in 2011-12. • Capital Flows can be readily absorbed by financing needs of the high growth of the Indian Economy. o Against the level of $53.6 billion in 2009-10, the capital inflows projected to be $ 73 billion for 2010-11 and $91 billion for 2011-12. o Accretion to reserves was $13.4 billion in 2009-10. Projected to be $30.9 billion in 2010-11 and $39.8 billion in 2011-12. • Inflation rate projected at 6.5 % by March 2011 due to expected normal monsoon combined with the base effect. o The provisional headline inflation was above 10% in June 2010. o Controlling high inflation rate essential for sustainable growth in medium term. o Available food stocks must be released to have a dampening effect on prices. July 23, 2010
  • 2.
    Economic Advisory Councilto PM Economic Outlook for 2010-11 • Monetary Policy to complete the process of exit and operate with bias toward tightening. o Credit off take picked up. Strong growth rate in the 1st quarter of 2010-11. o Fund flow from capital market to commercial sector quite strong. Bond issuance growth relatively higher than issuance of equity. o Liquidity conditions are taut enough for monetary policy signals to be appropriately transmitted to the financial sector. A bias toward tightening is necessary. o Exchange rate variations will remain within acceptable range. • Exit from the expansionary fiscal policy not only feasible but also necessary o High buoyancy in direct and indirect tax collections. Telecom auctions and decontrol of the petroleum products prices to provide additional cushion. o Fiscal deficit outturn may be lower than the budgeted consolidated fiscal deficit of 8.4% of GDP for 2010-11. o Revenue Deficit as a ratio of GDP expected to decline from 6.3% in 2009-10 to 4.6% in 2010-11. o Operationalization of Goods and Services Tax (GST) should be a priority. o Budgeted level of Fiscal Deficit and Revenue Deficit still beyond comfort zone. o Need to rationalize the food and fertilizer subsidies. • To sustain a growth rate of 9.0 per cent, focus is required on: o Containing inflation o Improving farm productivity o Closing the large physical infrastructure deficit, especially in the power sector July 23, 2010
  • 3.
    Economic Advisory Councilto PM Economic Outlook for 2010-11 GDP Growth – Actual & Projected Unit: per cent 2005/06 2006/07 2007/08 2008/09 2009/10 2010/11 2011/12 QE Rev f f Year-on-year Growth Rates 1 Agriculture & allied 5.2 3.7 4.7 1.6 0.2 4.5 4.0 activities 2 Mining & Quarrying 1.3 8.7 3.9 1.6 10.6 8.0 8.0 3 Manufacturing 9.6 14.9 10.3 3.2 10.8 10.0 10.5 4 Electricity, Gas & Water 6.6 10.0 8.5 3.9 6.5 7.5 9.0 Supply 5 Construction 12.4 10.6 10.0 5.9 6.5 10.0 11.0 6 Trade, Hotels, Transport, 12.1 11.7 10.7 7.6 9.3 10.0 10.0 Storage & Communication 7 Finance, insurance, real 12.8 14.5 13.2 10.1 9.7 9.5 10.5 estate & business services 8 Community & personal 7.6 2.6 6.7 13.9 5.6 6.0 7.5 services 9 Gross Domestic Product 9.5 9.7 9.2 6.7 7.4 8.5 9.0 at factor cost 10 Industry (2 + 3 + 4 + 5) 9.3 12.7 9.5 3.9 9.3 9.7 10.3 11 Services (6 + 7 + 8) 11.1 10.2 10.5 9.8 8.5 8.9 9.6 12 Non-agriculture (9 - 1) 10.5 11.0 10.2 7.7 8.8 9.2 9.8 14 GDP (factor cost) per 7.8 8.1 7.7 5.2 6.2 7.0 7.5 capita Some Magnitudes 15 GDP at factor cost - 32.5 35.6 38.9 41.5 44.6 48.4 52.8 2004/05 prices in Rs lakh crore (or Trillion) 16 GDP market & current 37.1 42.8 49.5 55.7 62.3 70.3 79.2 prices in Rs lakh crore (or Trillion) 17 GDP market & current 837 947 1,231 1,222 1,317 1,529 1,722 prices in US$ Billion 18 Population in Million 1,106 1,122 1,138 1,154 1,170 1,186 1,203 19 GDP market prices per 33,512 38,182 43,479 48,305 53,258 59,305 65,867 capita current prices 20 GDP market prices per 757 844 1,082 1,059 1,126 1,289 1,432 capita in current US$ Note: QE refers to the Quick Estimates for National Income released on 29 Jan 2010. Rev refers to the Revised Estimate for National Income released on 31 May 2010. f stands for forecasts made by the Council. July 23, 2010
  • 4.
    Economic Advisory Councilto PM Economic Outlook for 2010-11 Balance of Payments Unit: US$ billion 2004/05 2005/06 2006/07 2007/08 2008/09 2009 / 10 2010/11 2011/12 Merch. Exports 85.2 105.2 128.9 166.2 189.0 182.2 216.1 254.0 Merch. Imports 118.9 157.1 190.7 257.6 307.7 299.5 353.9 414.3 Merchandise Trade –33.7 –51.9 –61.8 –91.5 –118.7 –117.3 –137.8 –160.3 Balance –4.7% –6.2% –6.5% –7.4% –9.7% –8.9% –9.0% –9.3% Net Invisible 31.2 42.0 52.2 75.7 89.9 78.9 96.0 109.7 Earnings 4.3% 5.0% 5.5% 6.2% 7.4% 6.0% 6.3% 6.4% o/w ITES 14.7 23.8 27.7 37.2 44.5 41.3 46.2 53.1 Private Remittances 20.5 24.5 29.8 41.7 44.6 52.1 58.3 67.0 Investment Income –4.1 –4.1 –6.8 –4.4 –4.0 –6.4 –6.5 –6.5 Current Account –2.5 –9.9 –9.6 –15.74 –28.7 –38.4 –41.8 –50.7 Balance –0.3% –1.2% –1.0% –1.3% –2.4% –2.9% –2.7% –2.9% Foreign Investment 13.0 15.5 14.8 45.0 3.5 52.1 55.0 65.0 o/w FDI (net) 3.7 3.0 7.7 15.4 17.5 19.7 30.0 30.0 Inbound FDI 6.0 8.9 22.7 34.2 35.0 31.7 50.0 55.0 Outbound FDI 2.3 5.9 15.0 18.8 17.5 12.0 20.0 25.0 Portfolio capital 9.3 12.5 7.1 29.6 –14.0 32.4 25.0 35.0 Loans 10.9 7.9 24.5 41.9 4.1 11.9 16.8 24.5 Banking capital 3.9 1.4 1.9 11.8 –3.2 2.1 0 0 Other capital 0.7 1.2 4.2 9.5 4.5 –12.7 0 0 Capital Account 28.0 25.5 45.2 108.0 8.7 53.6 72.8 90.5 Balance 3.9% 3.0% 4.8% 8.8% 0.7% 4.1% 4.8% 5.3% Errors & Omissions 0.6 –0.5 1.0 1.2 1.1 –1.7 Accretion to 26.2 15.1 36.6 92.2 –18.9 13.4 30.9 39.8 Reserves 3.6% 1.8% 3.9% 7.5% –1.5% 1.0% 2.0% 2.3% Note: Percentage figures proportion to GDP July 23, 2010