

![Growth Indicators
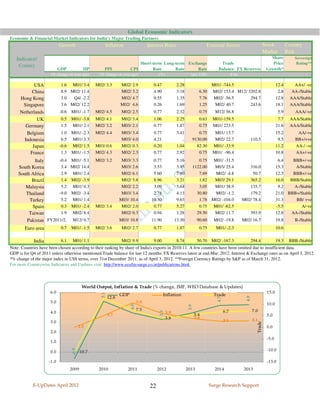
GDP Growth Rates Q1 Q2 Q3 Q4 FY
2011-12 7.7* 6.9* 6.1 6.9 (AE)*
2010-11 8.5* 7.6* 8.3* 7.8 8.4 (QE)*
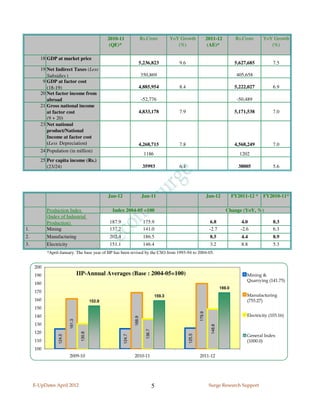
GDP[at Constant(2004-05) prices] Q3 Rs.Crore YoY Growth Q3 Rs.Crore YoY Growth
2010-11* (Share in 2011-12* (Share in
GDP) GDP)
(%) (%)
1 Agriculture, Forestry &
Fishing 224,044 11.0 230,168 2.7
2 Mining & Quarrying 28,200 6.1 27,334 -3.1
3 Manufacturing
194,435 7.8 195,228 0.4
4 Electricity, Gas & Water
Supply. 22,480 3.8 24,509 9.0
5 Construction
96,000 8.7 102,887 7.2
6 Trade, Hotels, Transport
and Communication 330,573 9.8 361,074 9.2
7 Financing, Insurance,
Real Estate & Business
Services. 214,205 11.2 233,537 9.0
8 Community, Social &
Personal Services. 152,857 -0.8 164,866 7.9
9 GDP at factor cost
(1 to 8) 1,262,794 8.3 1,339,603 6.1
10 Private final consumption
expenditure
818,122 7.6 (60.4) 869,193 6.2 (60.4)
11 Government final
consumption expenditure
168,576 4.7 (12.5) 175,952 4.4 (12.2)
12 Gross fixed capital
formation 437,564 11.1 (32.3) 432,169 -1.2 (30.0)
13 Changes in stocks 48,036 (3.5) 47,820 (3.3)
14 Valuables 29,981 (2.2) 32,909 (2.3)
15 Exports
316,694 28.1 (23.4) 358,160 13.1 (24.9)
16 Less Imports 401,587 14.2 (29.7) 471,062 17.3 (32.7)
17 Discrepancies -63,628 (-4.7) -6,222 (-0.4)
18 GDP at market price
(10 to 17) 1,353,757 10.1 (100) 1,438,918 6.2 (100)
*Estimates based on the New series of IIP. QE: Quick Estimates; AE: Advanced Estimates.
E-UpDates April 2012 4 Surge Research Support](https://image.slidesharecdn.com/eupdtsapr12-120605213753-phpapp02/85/E-Updates_Apr12-Indian-Global-Economic-Indicators-4-320.jpg)
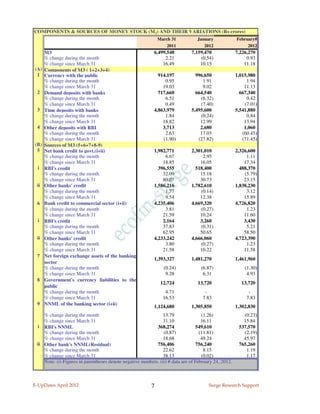
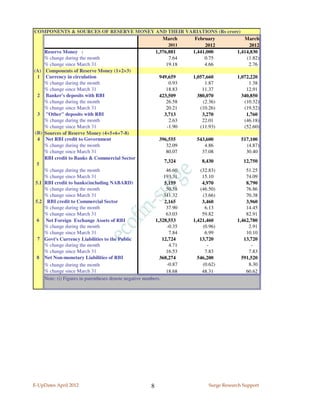
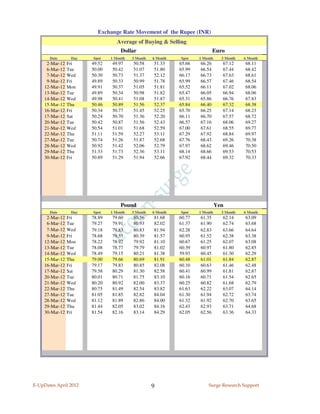
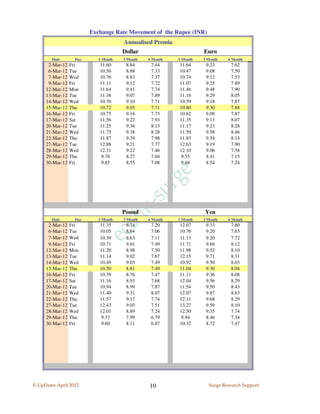
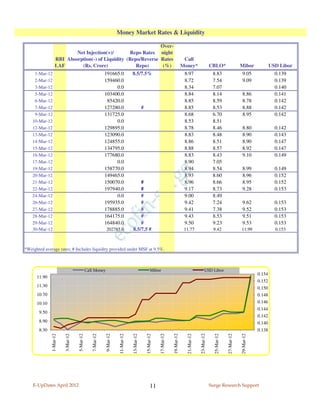
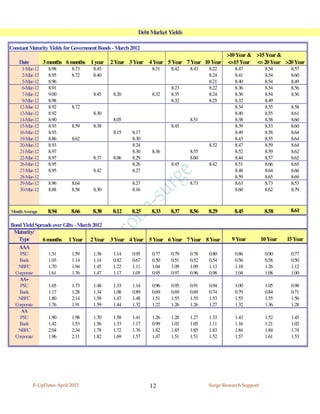
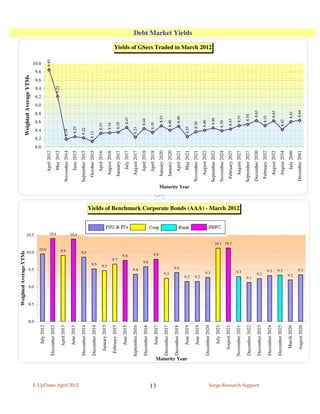
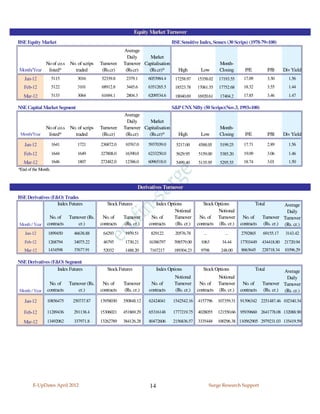
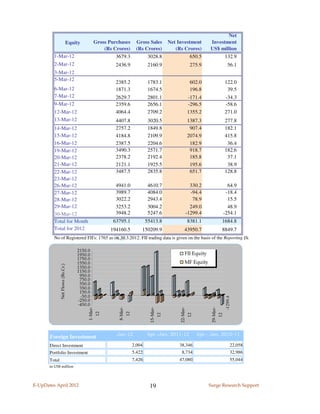
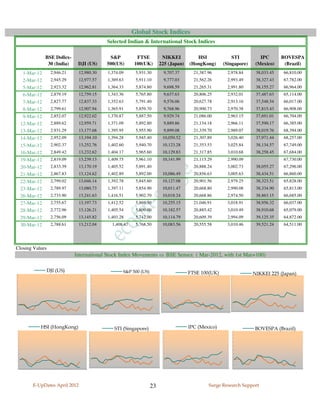
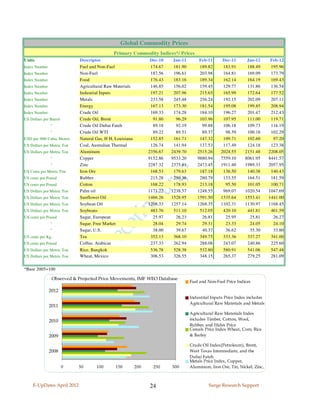


The document provides a comprehensive analysis of the Indian economy as of April 2012, detailing key growth, price, banking, and exchange rate indicators alongside global economic comparisons. It includes statistics such as GDP growth rates, inflation figures, and components of money supply, presenting advanced estimates for the fiscal year. Additionally, it features insights into the Union Budget for 2012-2013, highlighting important economic trends and metrics.


