Download to read offline

![E-UpDates October 2016
Surge Research Support
4
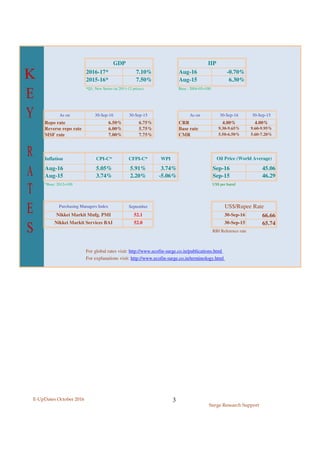
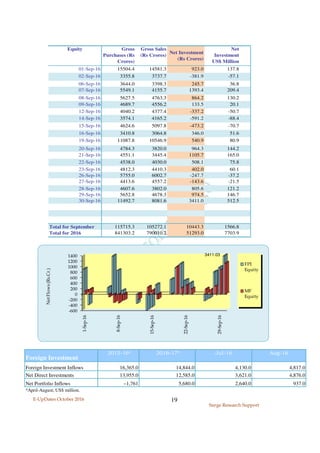
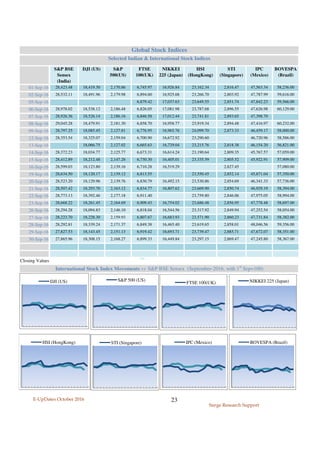
GDP Growth Rates
(at 2011-12 prices)
Q1 Q2 Q3 Q4 FY
2016-17 7.1
2015-16 7.5 7.6 7.2 7.9 7.6 (PE)
GVA at Basic Price by
Economic Activity
1 Agriculture, forestry & fishing 3,67,623 2.6 3,74,390 1.8
2 Mining & quarrying 86,444 8.5 86,091 -0.1
3 Manufacturing 4,49,280 7.3 4,90,164 9.1
4 Electricity, gas, water supply &
other utlility services
57,037 4.0 62,378 9.4
5 Construction 2,25,637 5.6 2,29,092 1.5
6 Trade, hotels, transport,
communication and services
related to broadcasting
4,83,238 10.0 5,22,610 8.1
7 Financial, real estate &
professional services
5,81,471 9.3 6,35,963 9.4
8 Public administration, defence
and other services
3,00,705 5.9 3,37,630 12.3
9
GVA at basic prices (1 to 8) 25,51,435 7.2 27,38,318 7.3
Estimates of Final
Expenditures on GDP
10 Private final consumption
expenditure (PFCE)
15,04,442 6.9 (55.2) 16,05,527 6.7 (55.0)
11 Government final consumption
expenditure (GFCE)
2,93,720 `-0.2 (10.8) 3,49,059 18.8 (12.0)
12 Gross fixed capital formation
(GFCF)
8,91,627 7.1 (32.7) 8,63,956 `-3.1 (29.6)
13 Changes in stocks (CIS) 50,754 3.6 (1.9) 54,345 7.1 (1.9)
14 Valuables 43,138 `(1.6) 22,129 `(0.8)
15 Exports 5,85,324 `-5.7 (21.5) 6,04,052 3.2 (20.7)
16 Less Imports 6,45,577 `-2.4 (23.7) 6,07,953 `-5.8 (20.8)
17 Discrepancies 761 `(0.0) 26,232 `(0.9)
18
GDP (10 to 17) 27,24,188
7.5
(100.0)
29,17,348 7.1 (100.0)
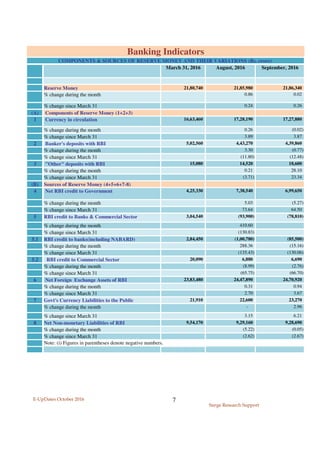
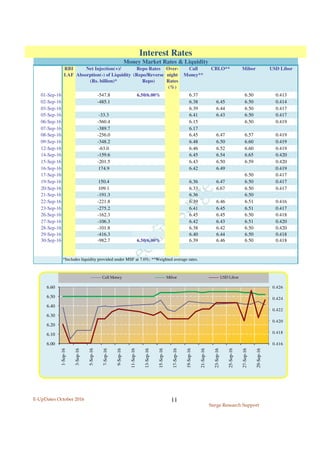
Growth Indicators
YoY
Growth
(Share in
GDP)
(%)
GDP
[at Constant(2011-12) prices]
2015-16
(Q1)
Rs.Crore YoY
Growth
(Share in
GDP)
(%)
2016-17
(Q1)
Rs.Crore](https://image.slidesharecdn.com/eupdtsoct16-170222033922/85/E-UPDates-A-Monthly-Statistical-Bulletin-Sample-4-320.jpg)
![E-UpDates October 2016
Surge Research Support
5
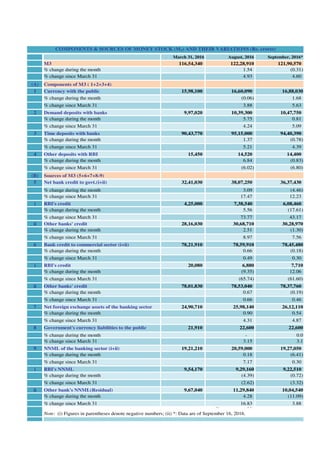
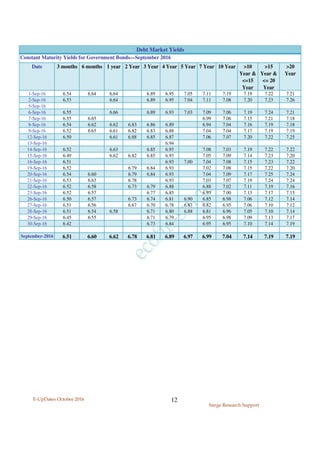
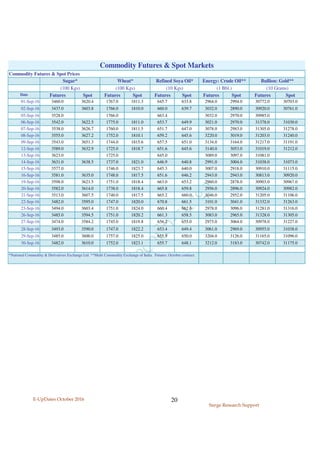
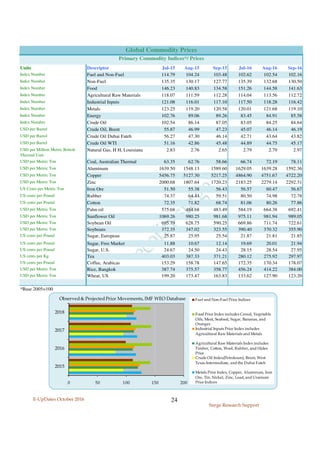
1 GVA at basic prices 104,27,191 7.2 97,27,490 7.1
2 Taxes 11,90,986 7.5 11,08,339 8.0
3 Less Subsidies 2,67,929 -5.6 2,83,679 4.8
4
GDP (1+2-3) 113,50,249 7.6 105,52,151 7.2
5 Net Domestic Product (GDP less
Consumption of Fixed Capital)
100,71,784 7.6 93,59,476 7.1
6 Net factor income from abroad -1,36,921 -1,24,450
7 Gross National Income (4+6) 112,13,328 7.5 104,27,701 7.3
8 Net National Income (GNI less
Consumption of Fixed Capital)
99,34,863 7.6 92,35,026 7.2
9 Population (in million) 1,283 1.3 1,267 1.3
10 Per capita GDP (Rs.) 88,466 6.2 83,285 5.9
11 Per capita GNI (Rs.) 87,399 6.2 82,302 6.0
12 Per capita PFCE (Rs.) 49,112 6.1 46,285 4.9
PE : Provisional Estimates; RE : Revised Estimates.
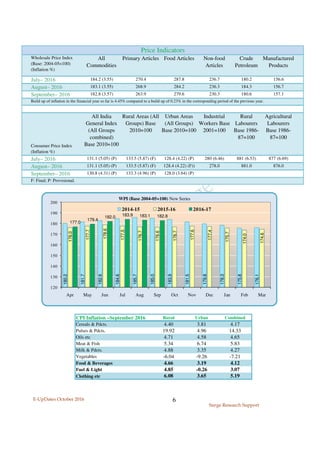
Index of Industrial Production Aug-16 Aug-15 Aug-16 FY2016-17 FY2015-16
General Index 175.3 176.6 -0.7 -0.3 4.1
1. Mining 113.5 120.2 -5.6 0.6 1.4
2. Manufacturing 184.3 184.8 -0.3 -1.2 4.5
3. Electricity 194.6 194.4 0.1 5.7 3.2
Index 2004-05 =100 Change (YoY, %)
Rs.Crore YoY
Growth (%)
GDP
[at Constant(2011-12) prices]
2015-16
(PE)
Rs.Crore YoY
Growth
2014-15
(1st RE)
126.5
129.3
122.6
186.0
189.8
186.0
178.6
188.6
198.8
176.8
181.1 178.3
100
110
120
130
140
150
160
170
180
190
200
210
2014-15 2015-16 2016-17
IIP-Annual Averages (Base : 2004-05=100) Mining &
Quarrying
(141.75)
Manufacturing
(755.27)
Electricity
(103.16)
General Index
(1000.0)](https://image.slidesharecdn.com/eupdtsoct16-170222033922/85/E-UPDates-A-Monthly-Statistical-Bulletin-Sample-5-320.jpg)


The document is the October 2016 edition of the Ecofin Surge Research Support bulletin, providing statistical updates on the Indian and global economies. It details key economic indicators like GDP growth rates, inflation, and monetary policy, comparing statistics from previous years. Highlights include growth rates, inflation figures, and banking indicators as of September 2016.


