Download to read offline
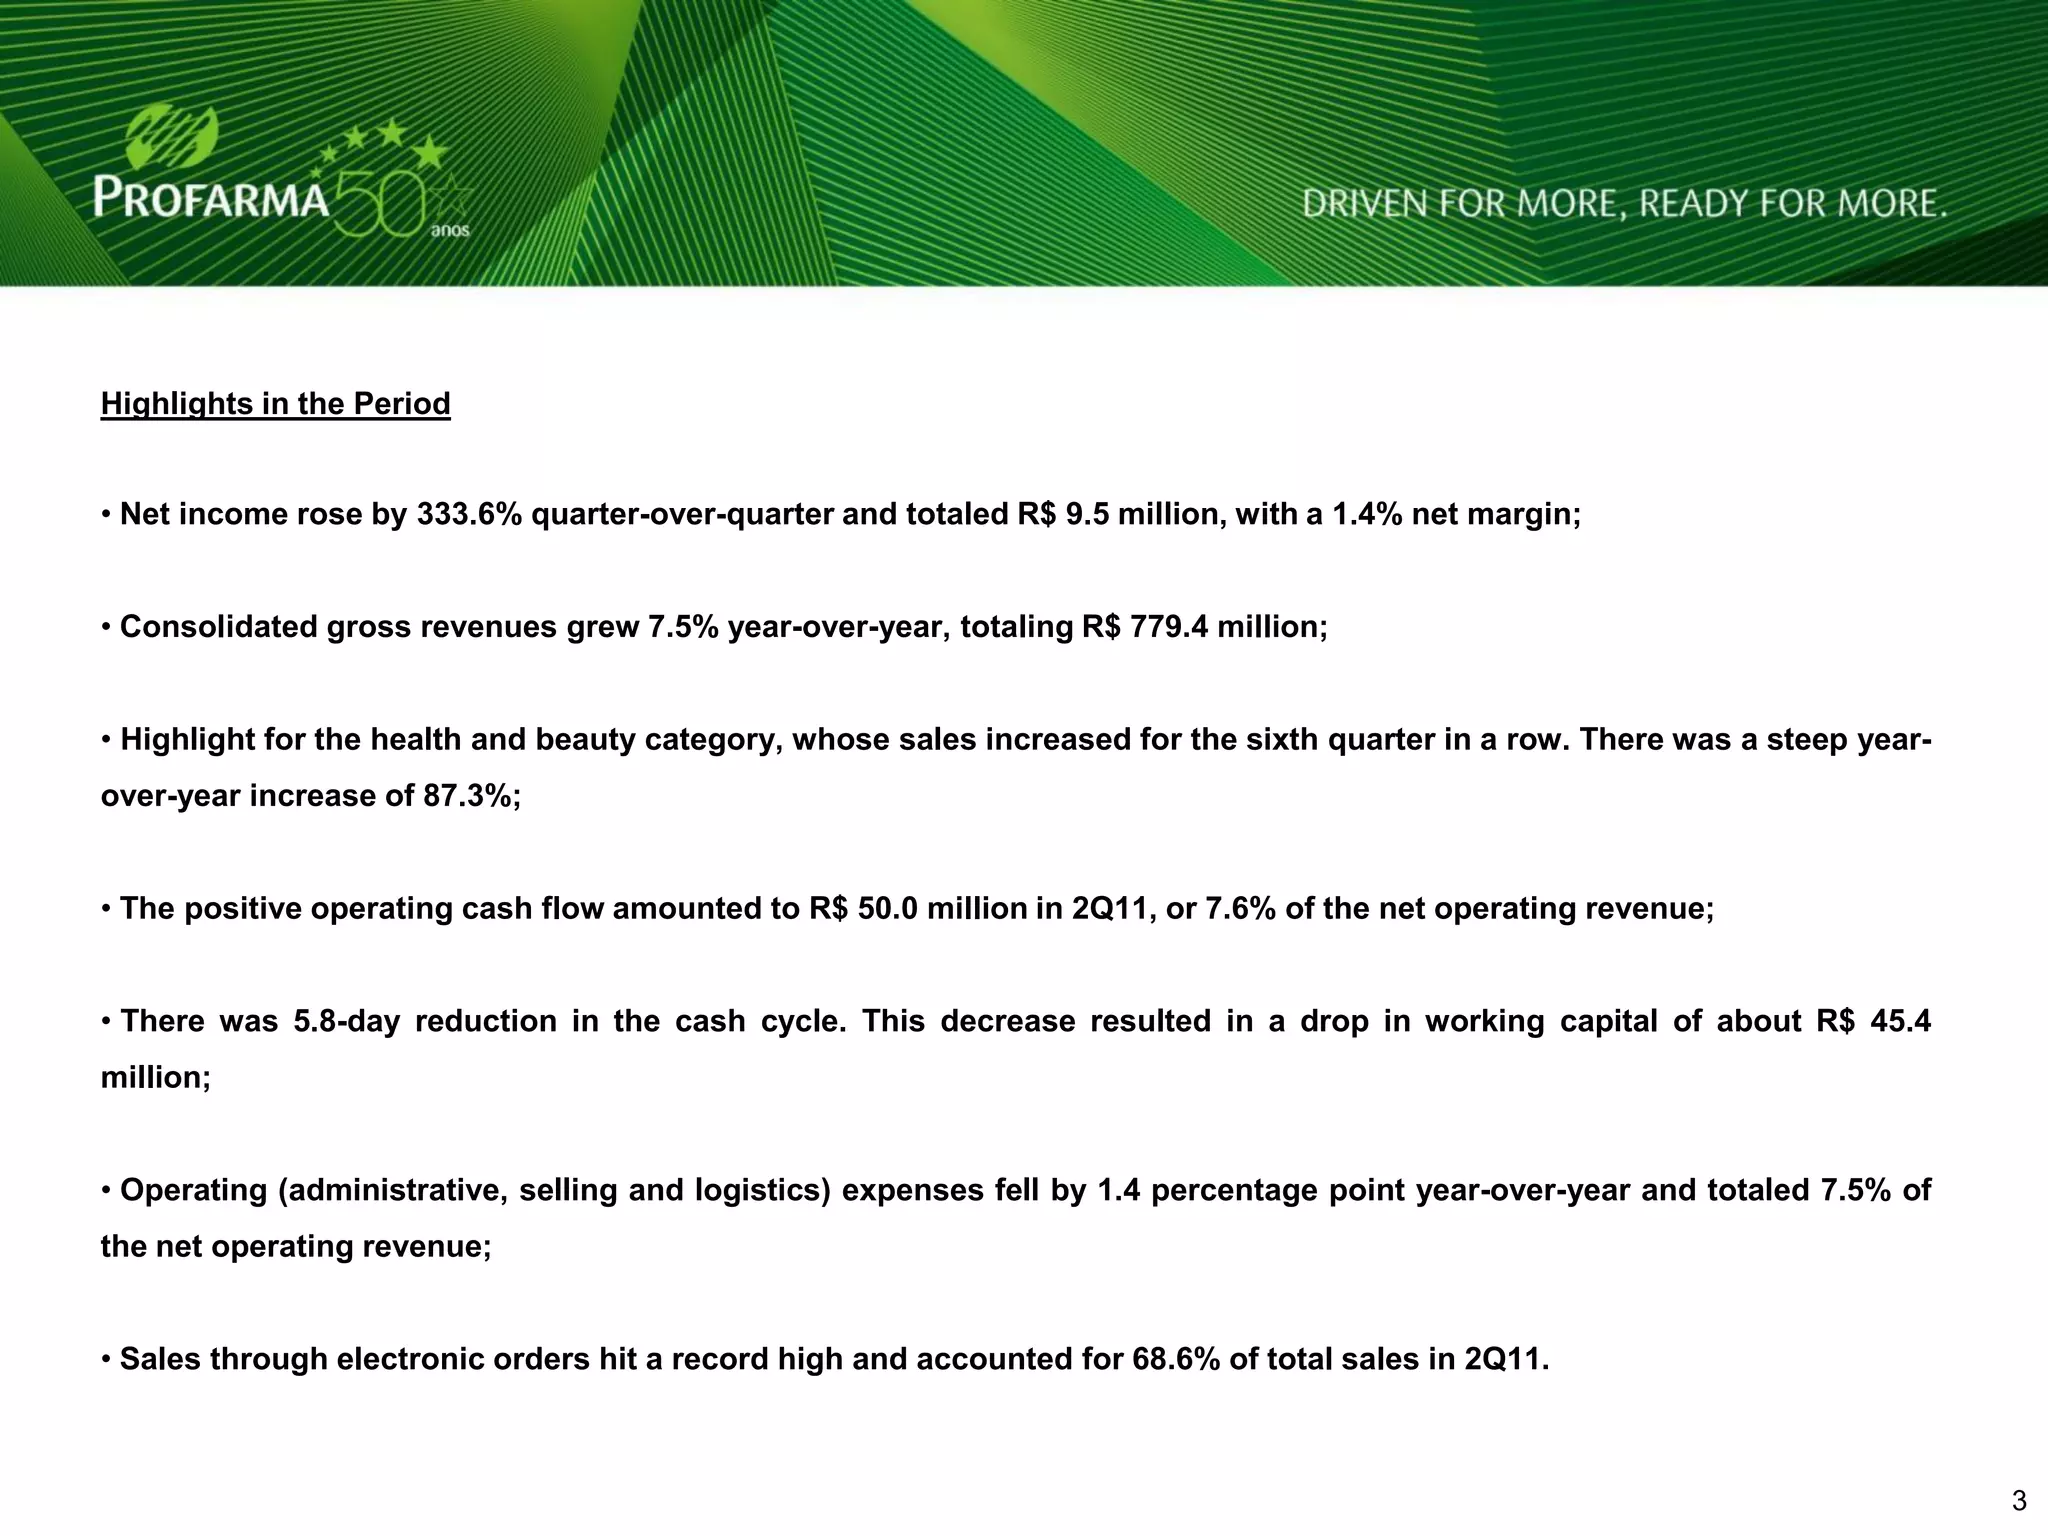
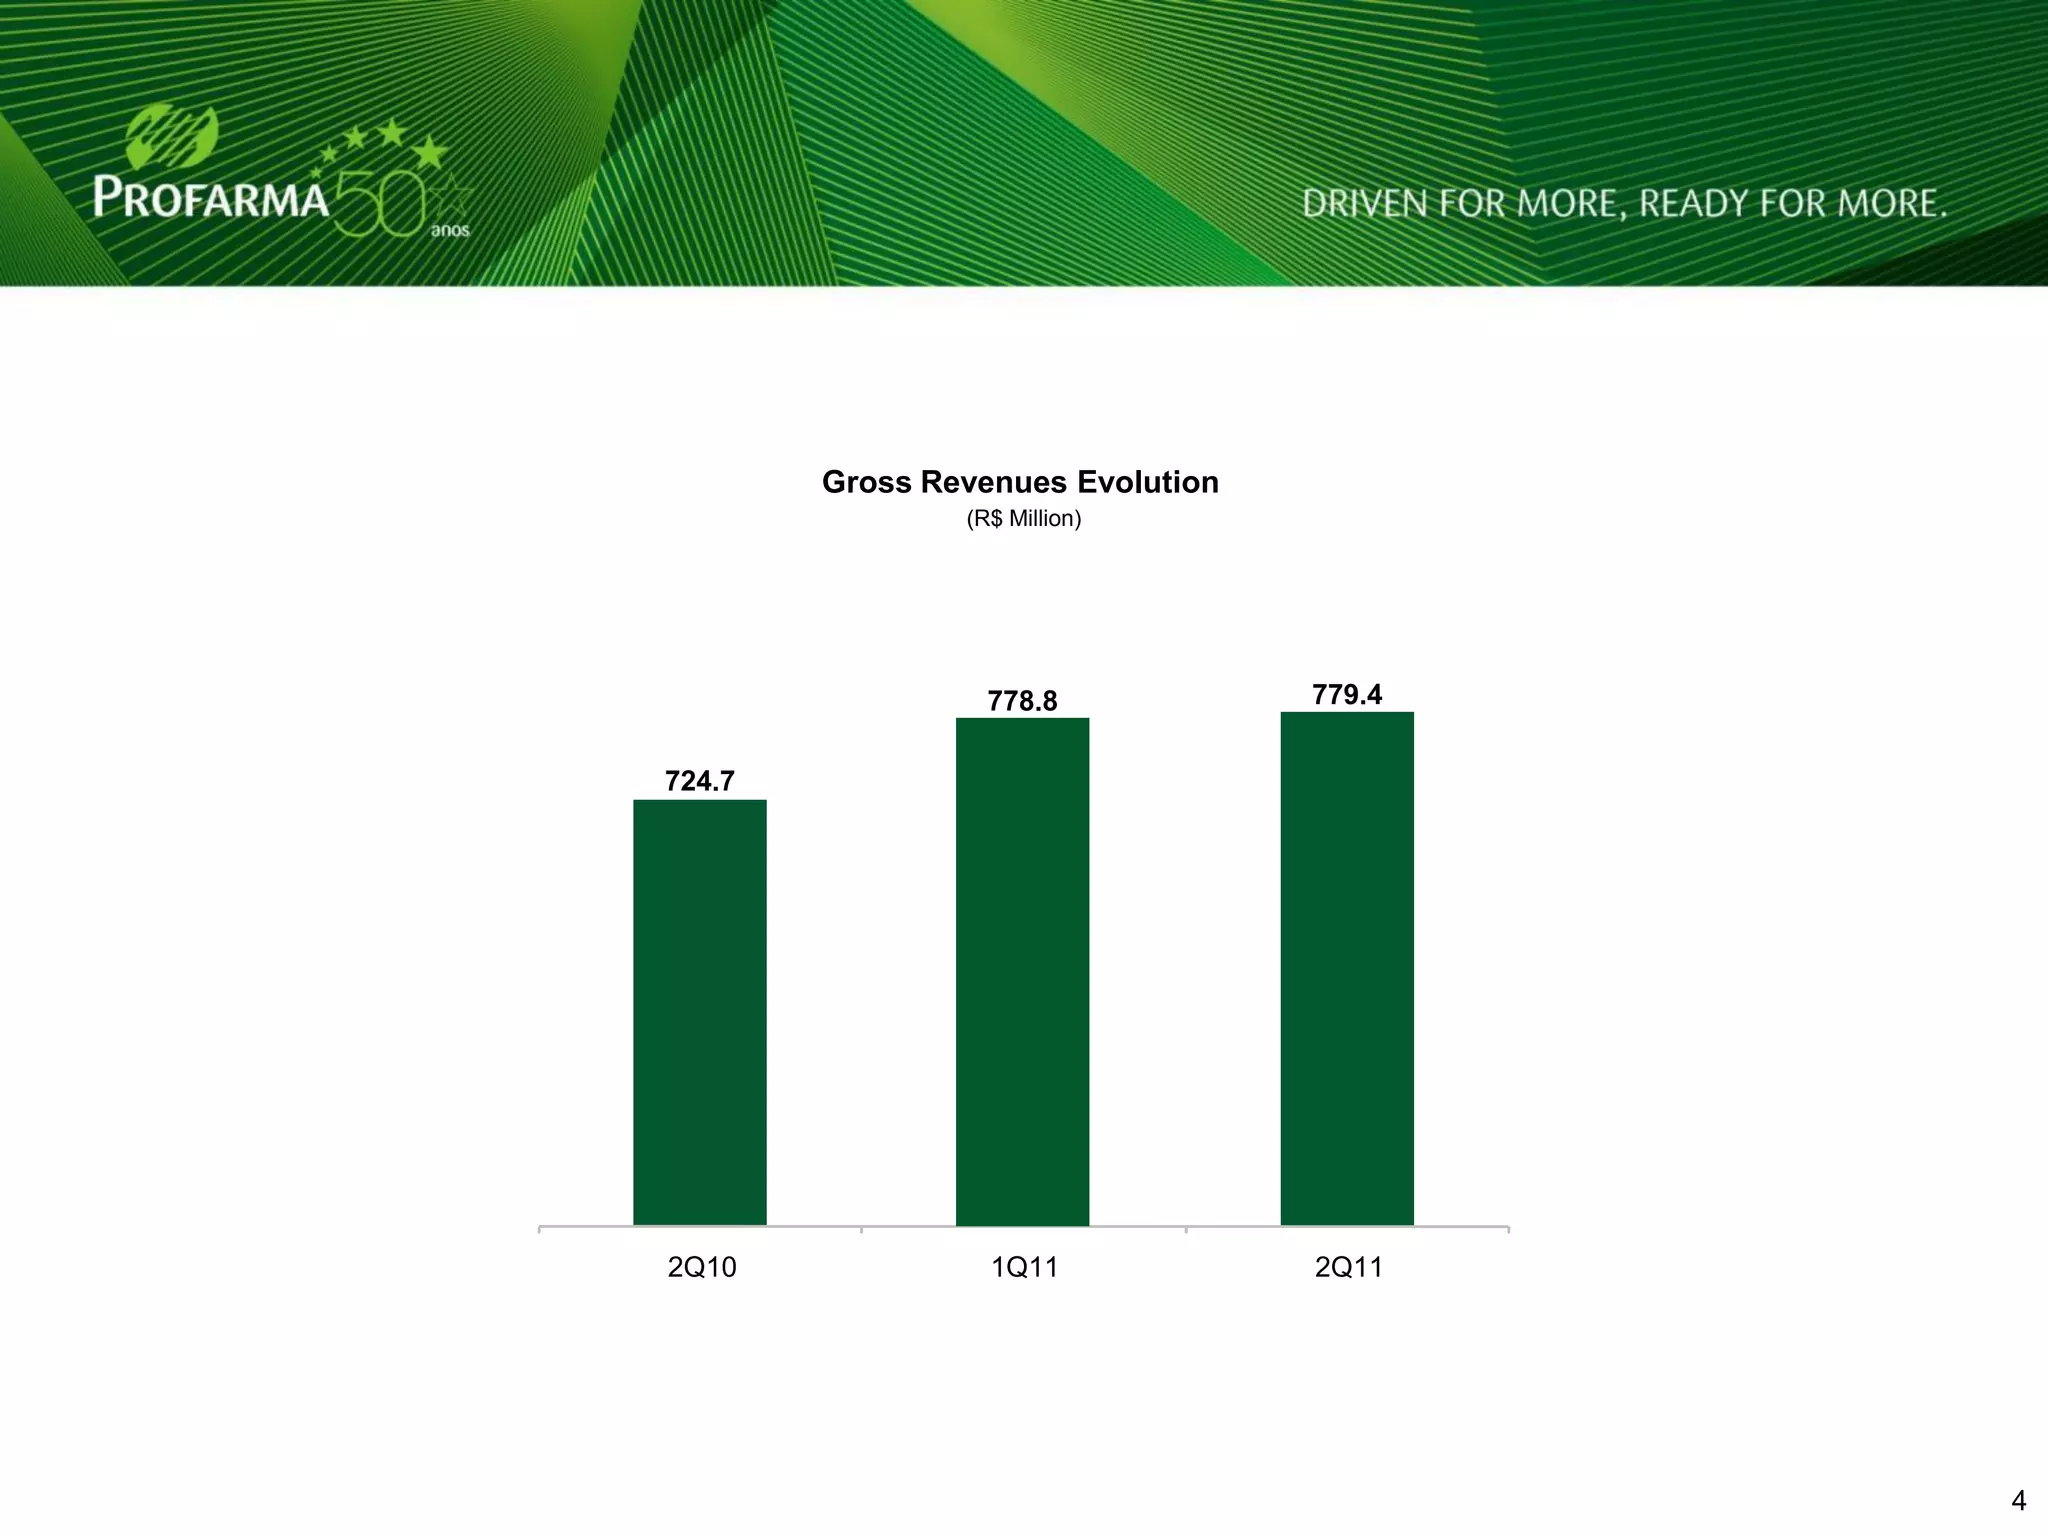
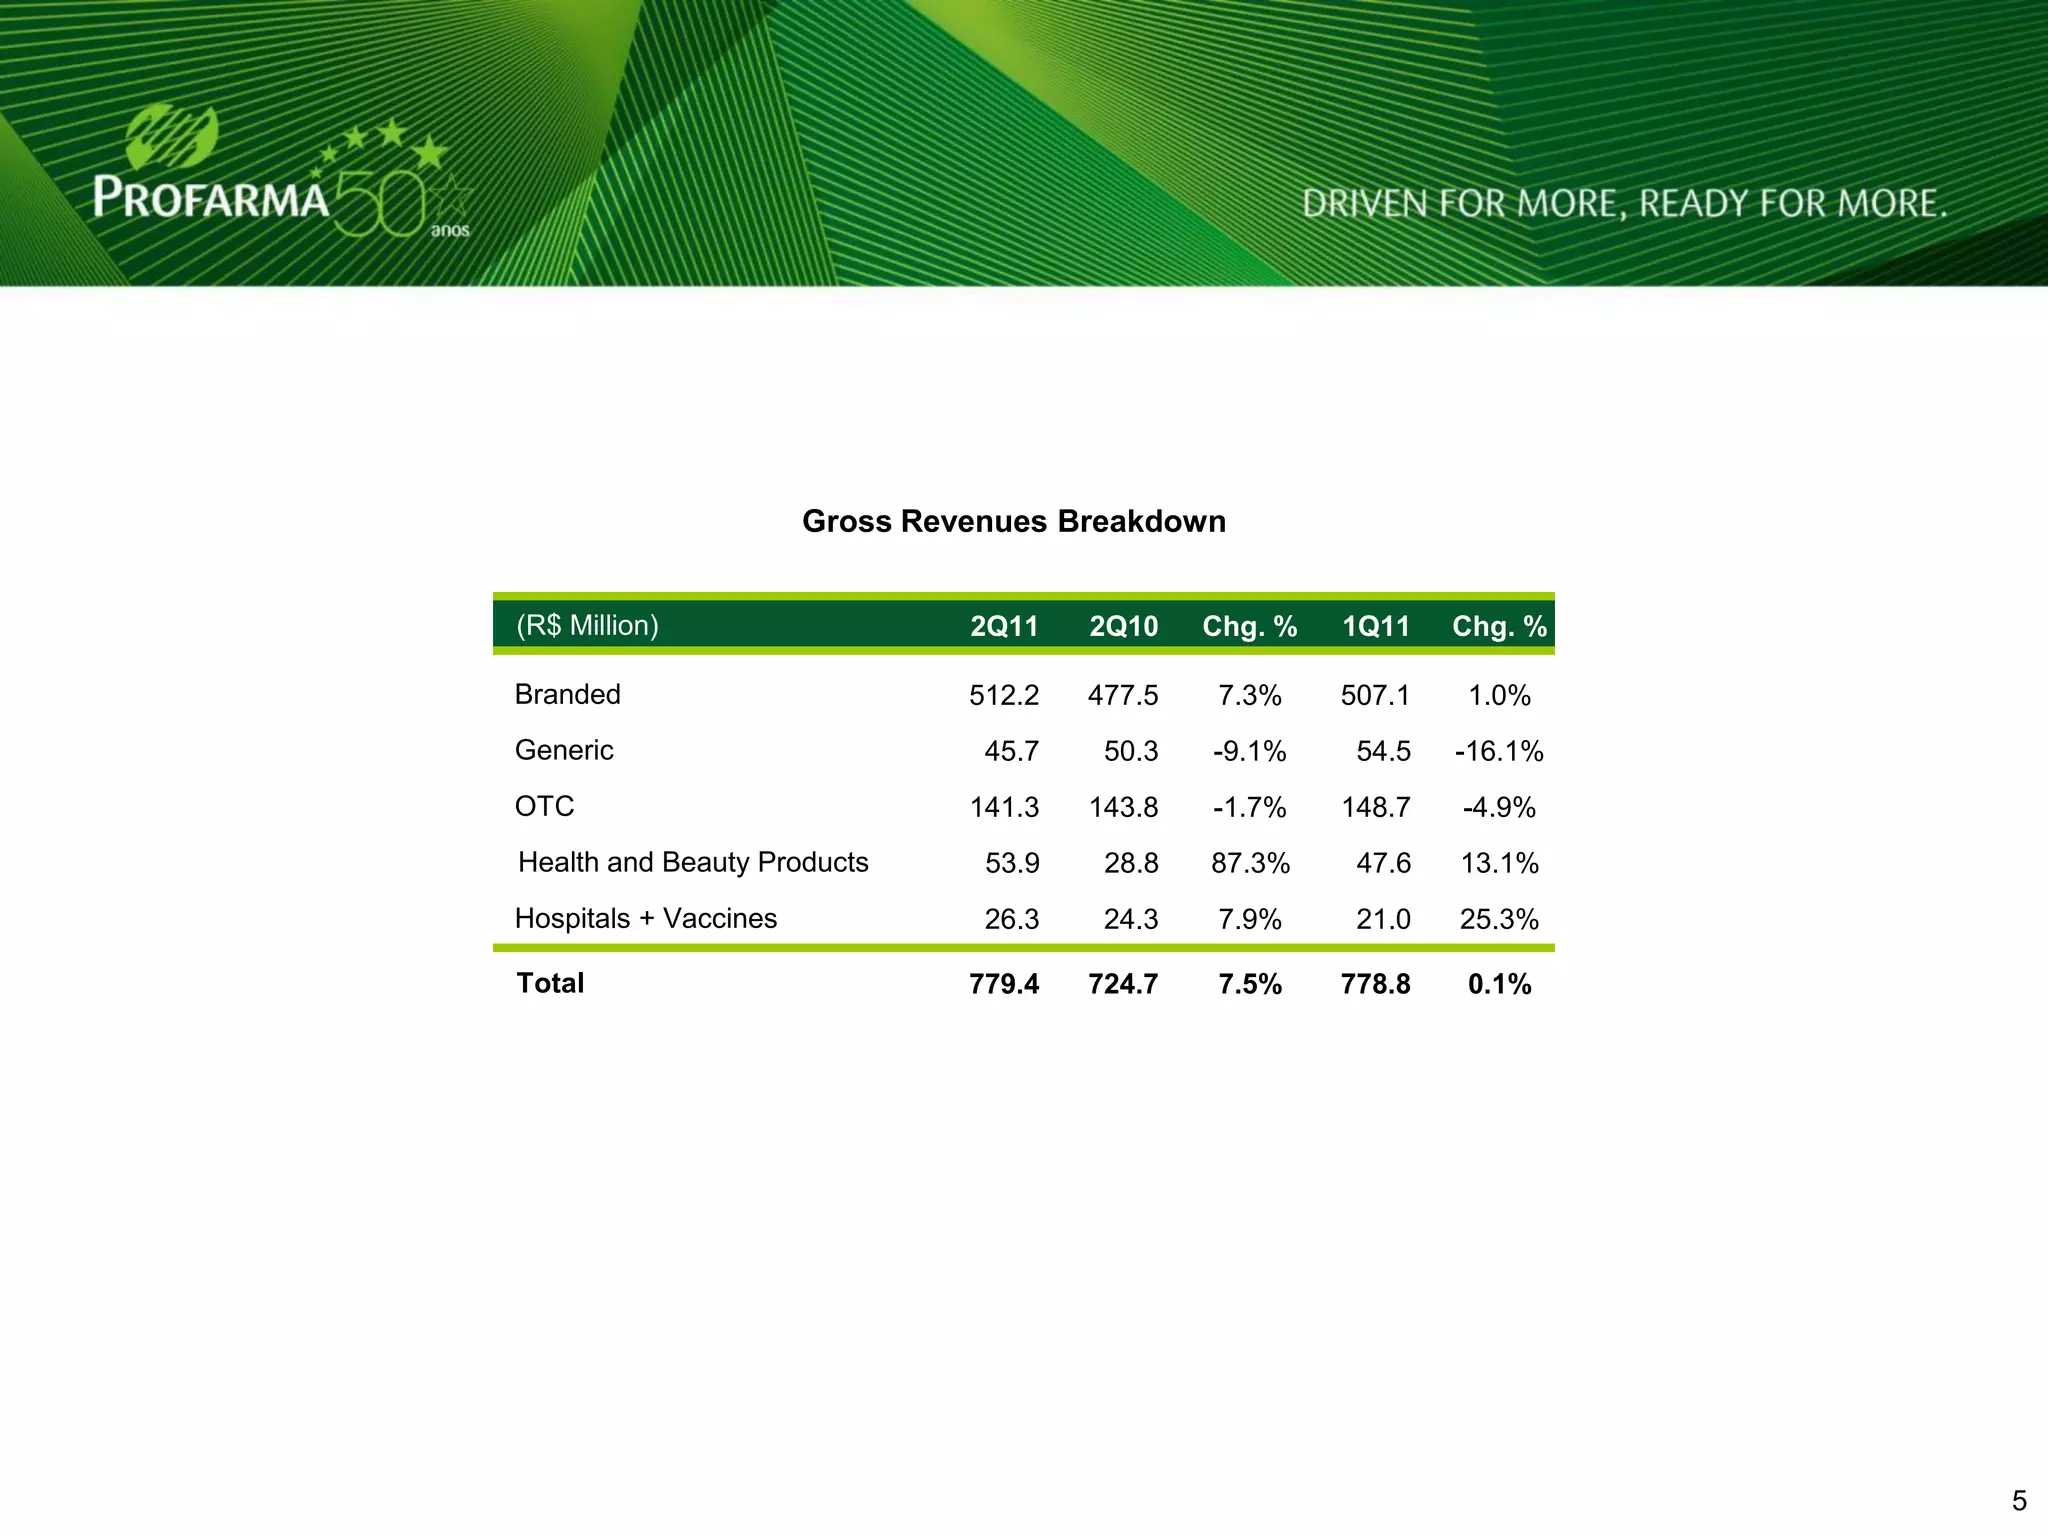
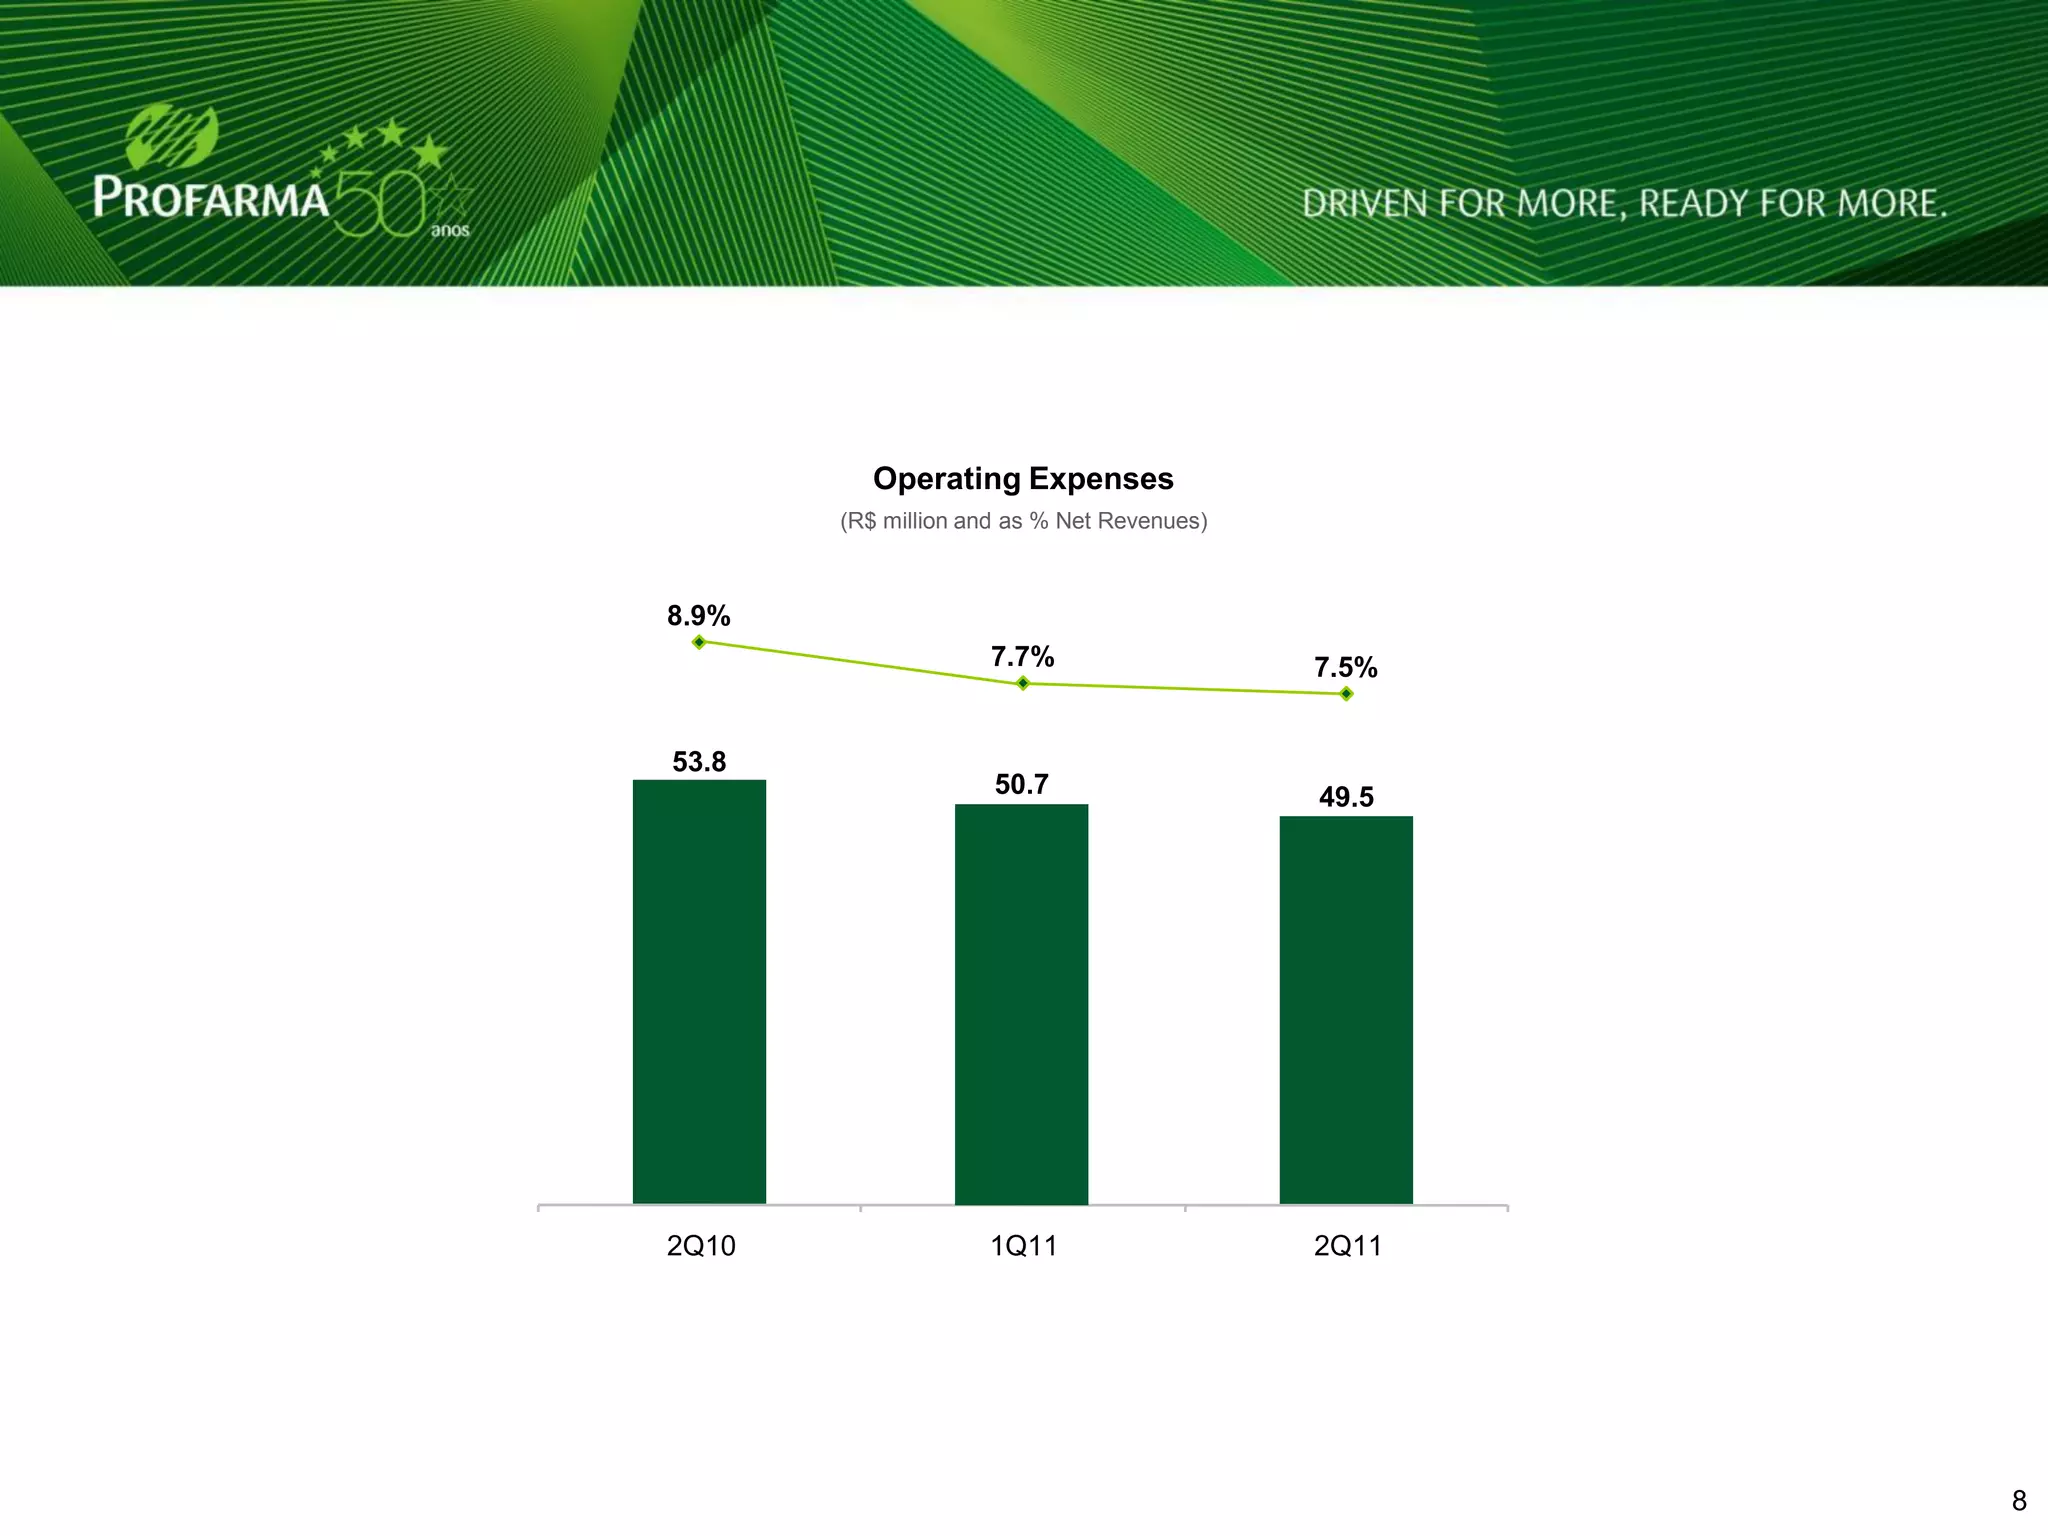
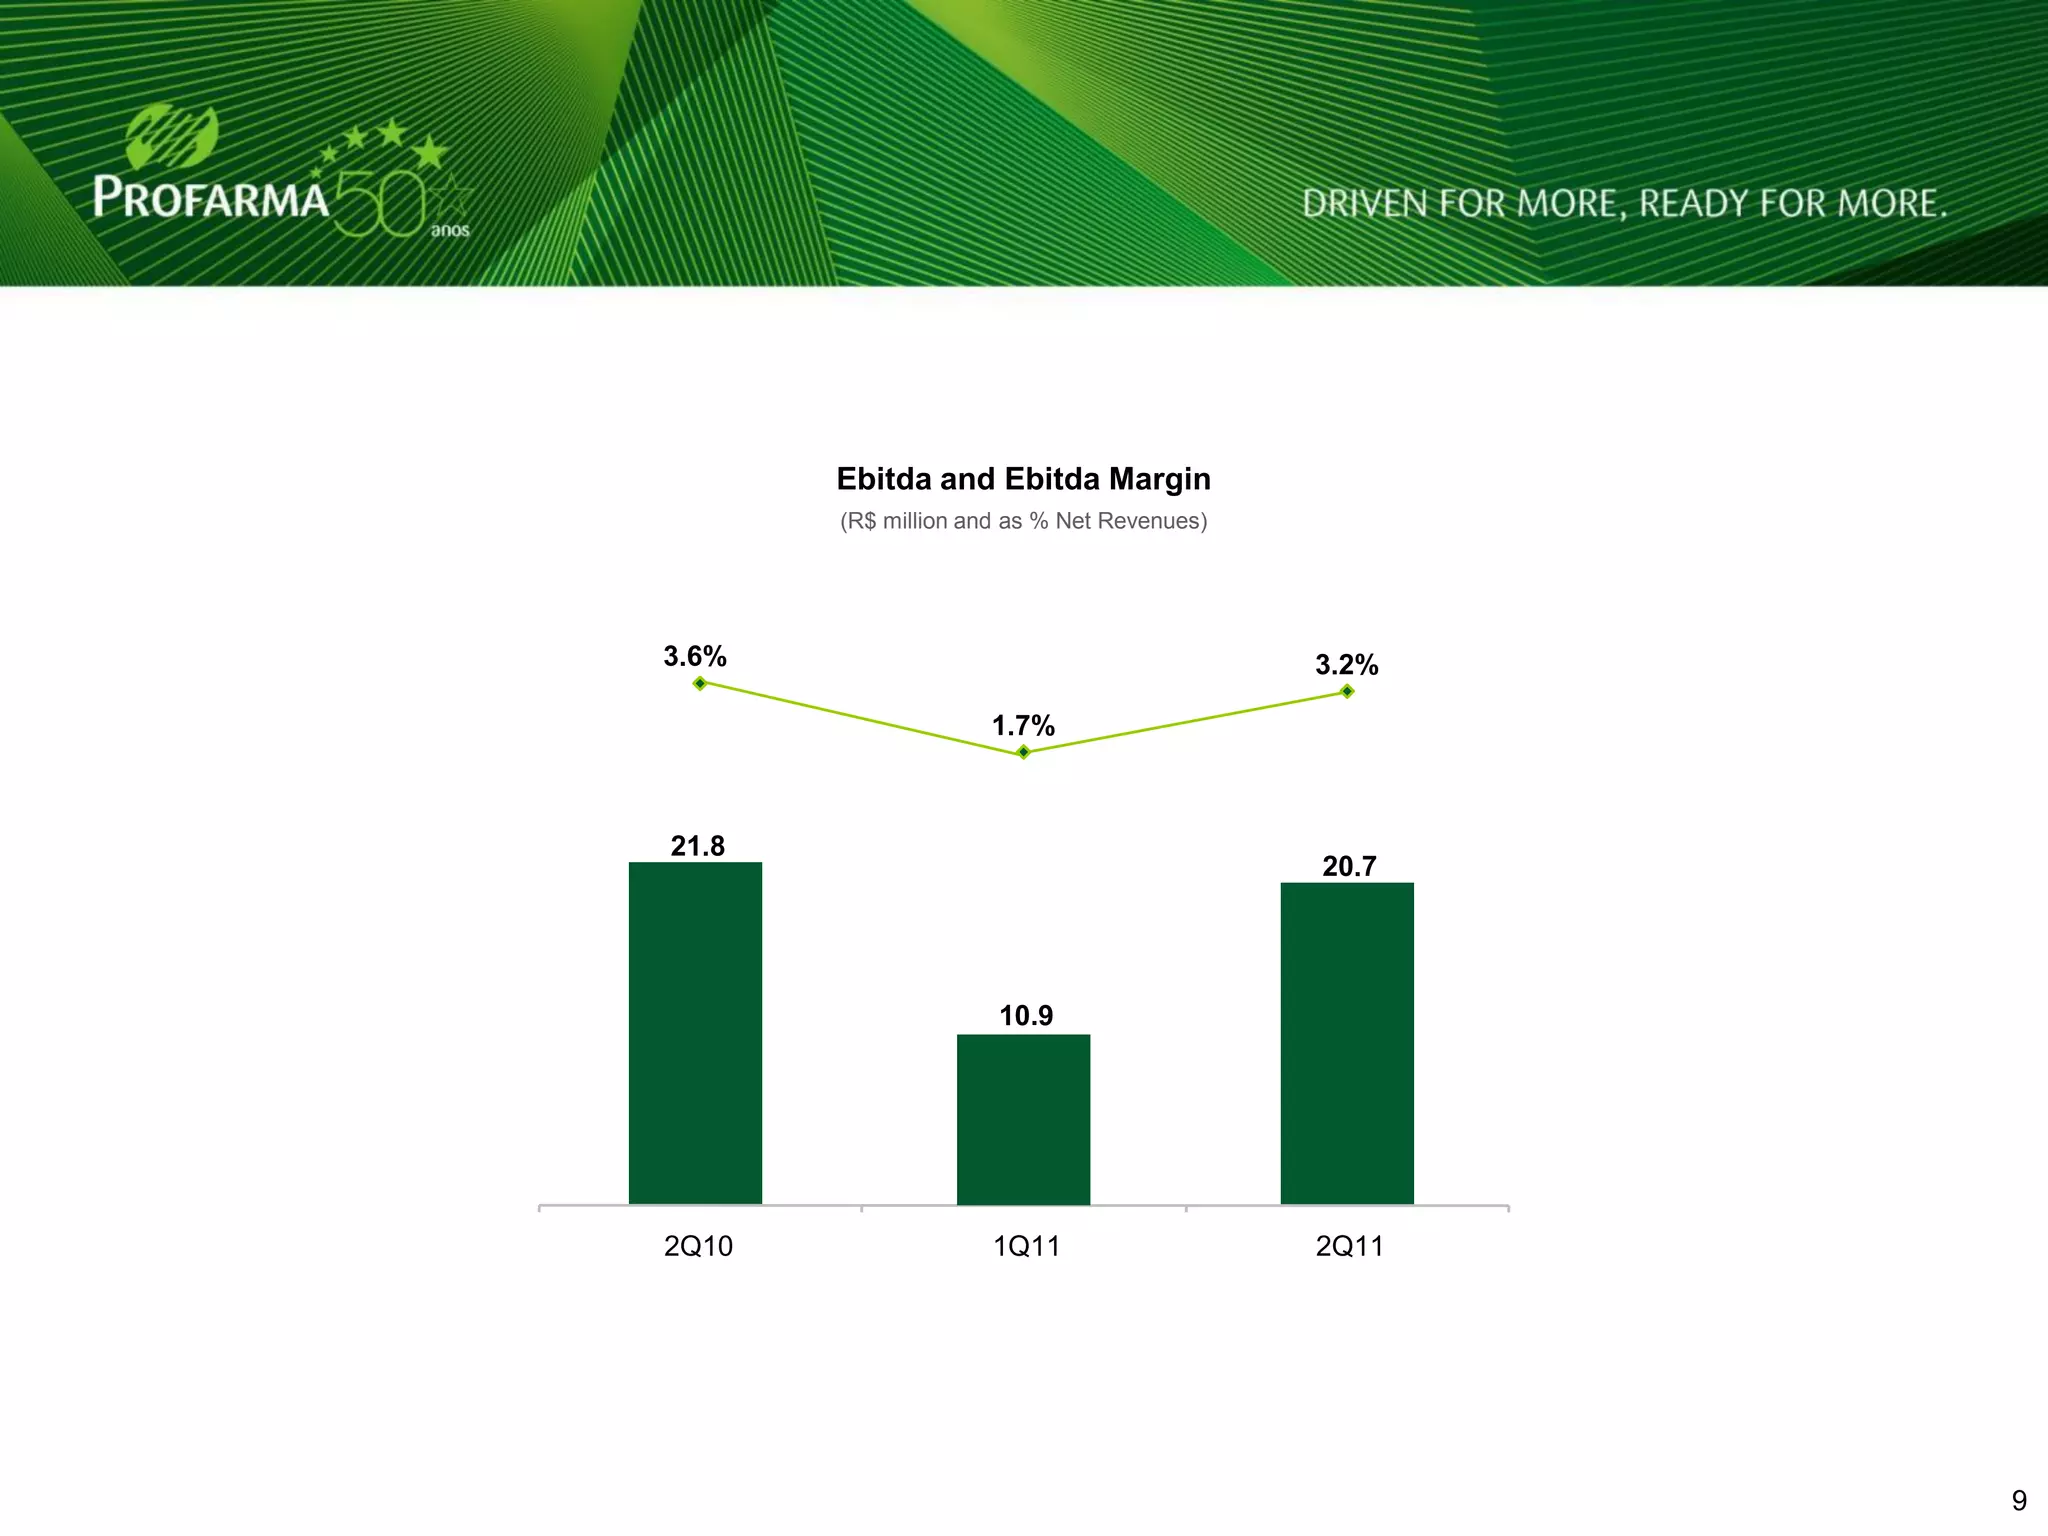
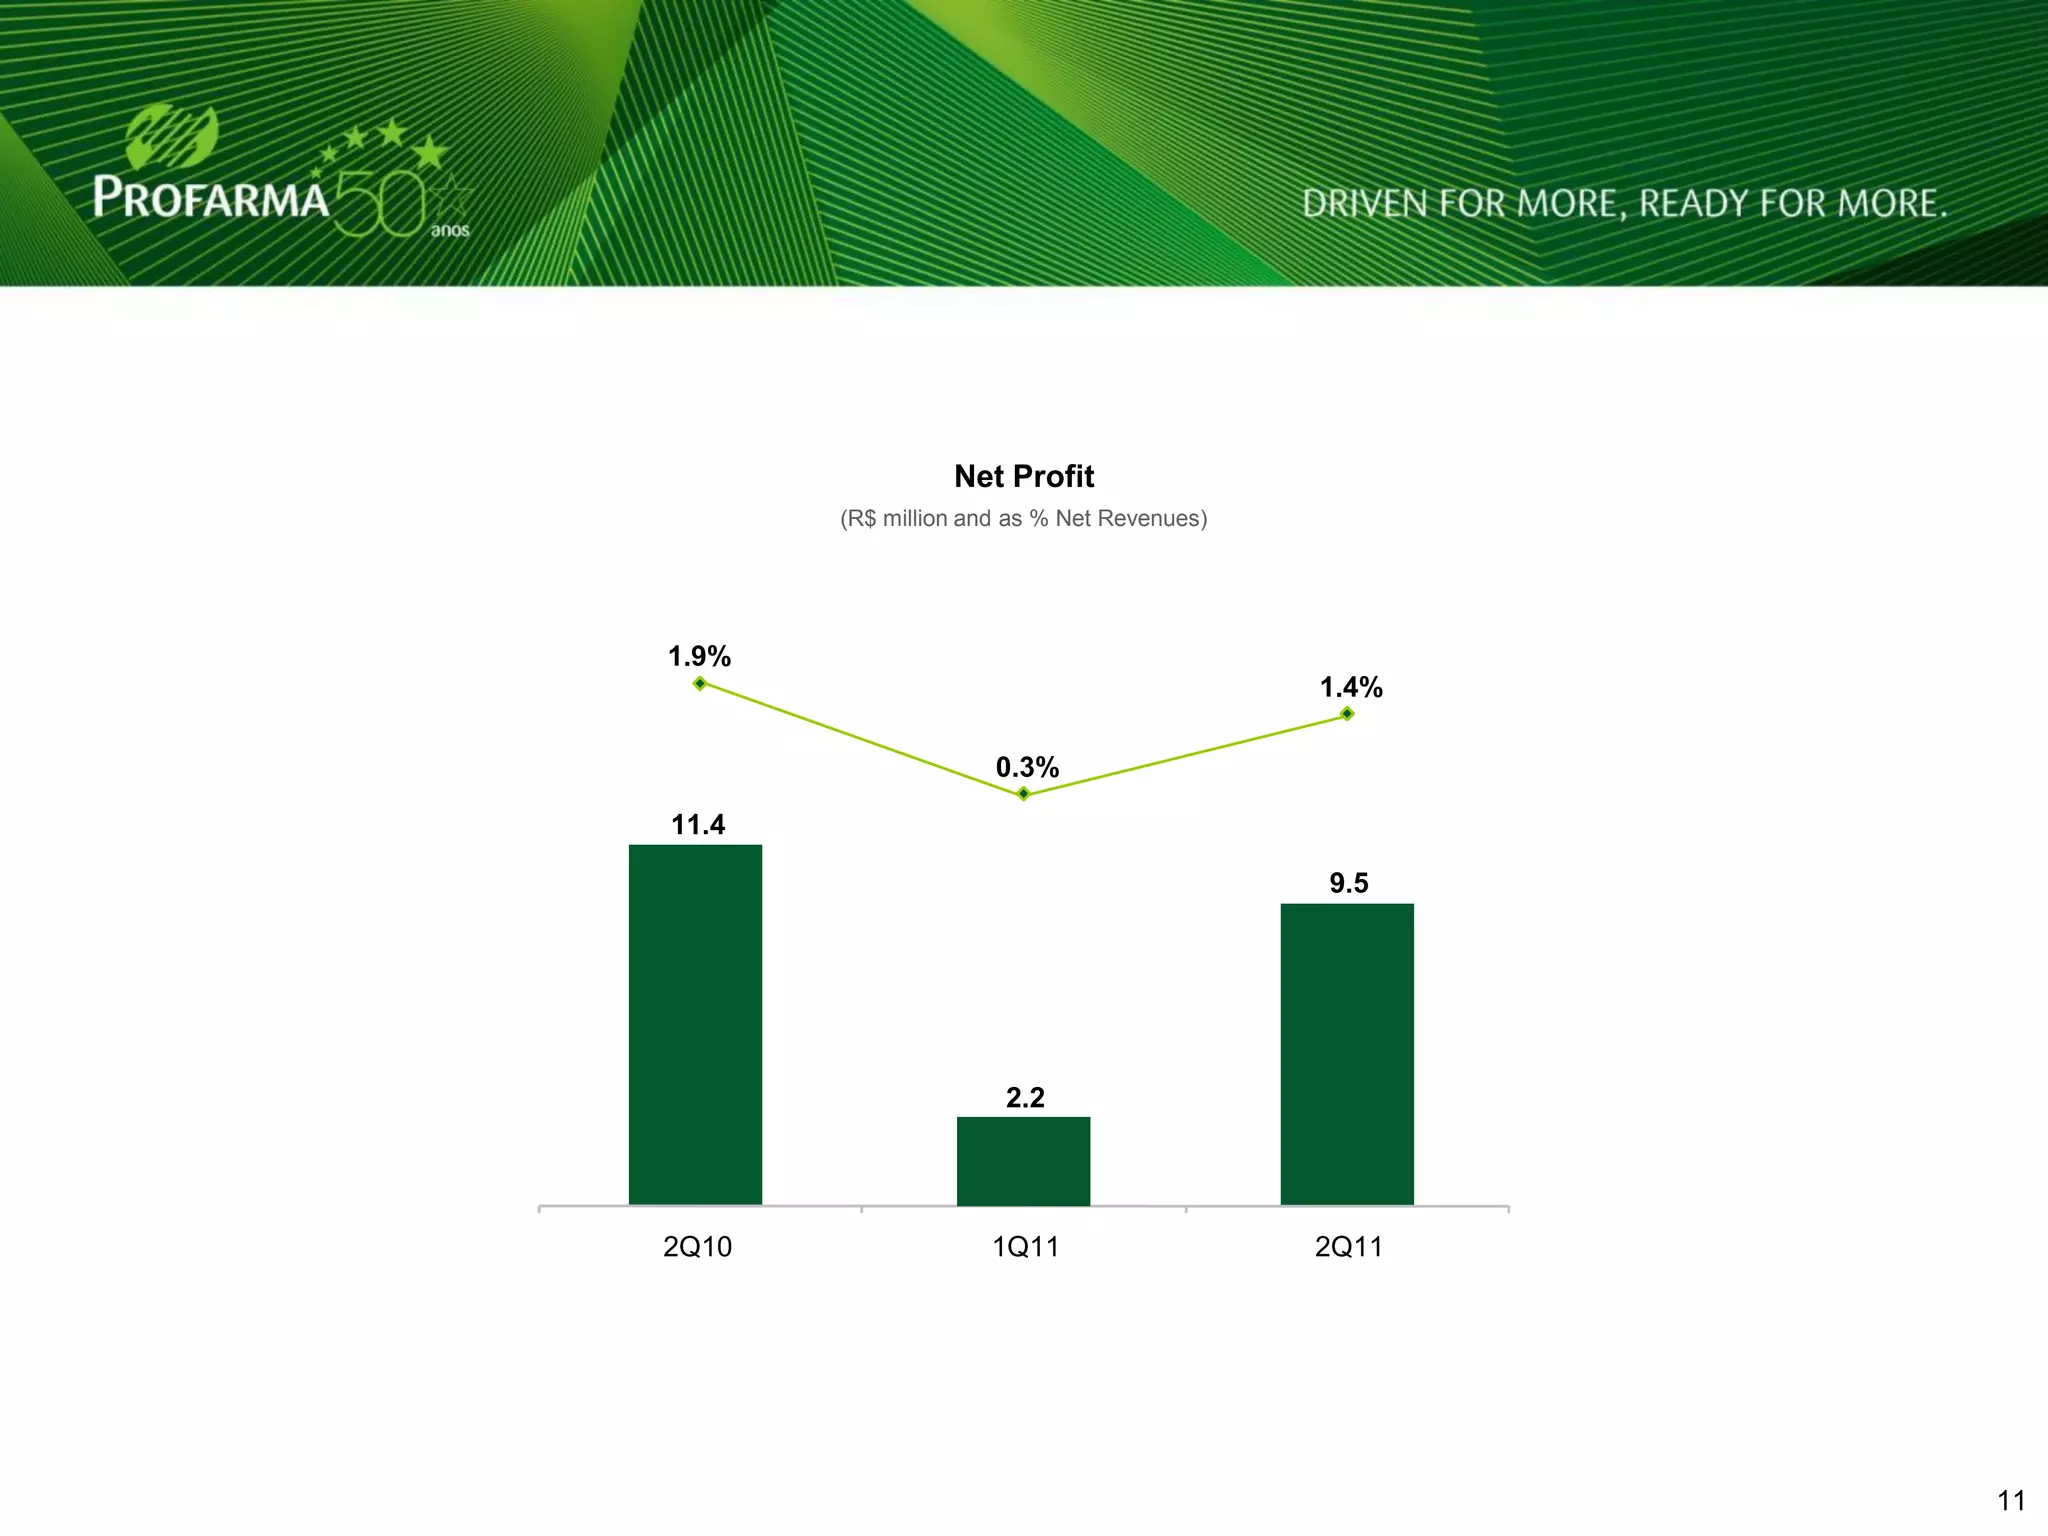


- Net income rose 333.6% quarter-over-quarter to R$9.5 million, with a 1.4% net margin. Gross revenues grew 7.5% year-over-year to R$779.4 million. - Sales of health and beauty products, which increased for the sixth quarter in a row, rose 87.3% year-over-year. - Operating expenses fell 1.4 percentage points year-over-year to 7.5% of net operating revenue. Sales through electronic orders hit a record high of 68.6% of total sales.


