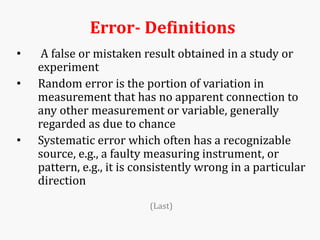
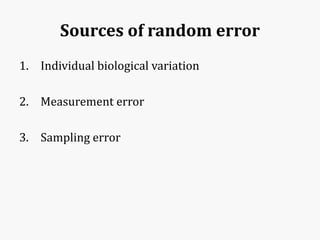
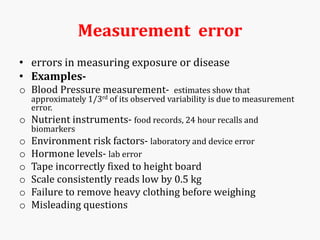
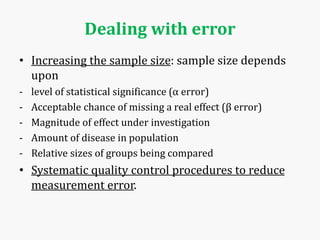
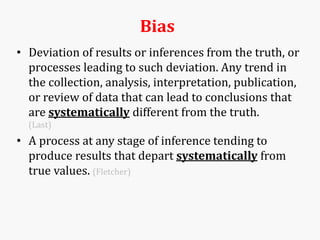
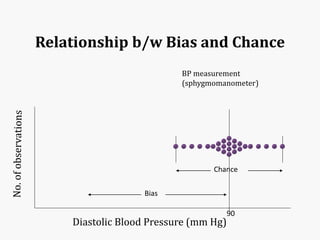
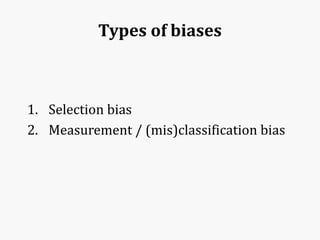
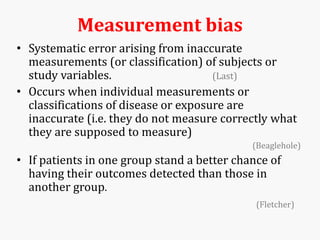
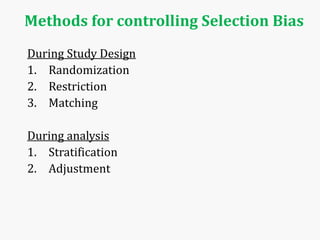
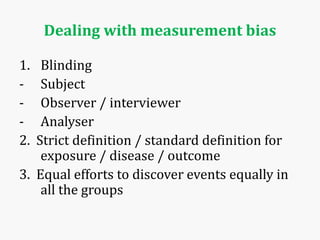
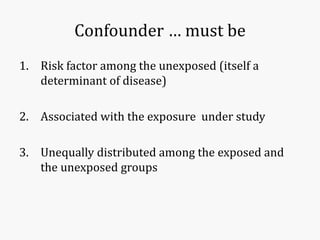
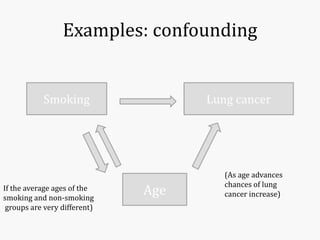
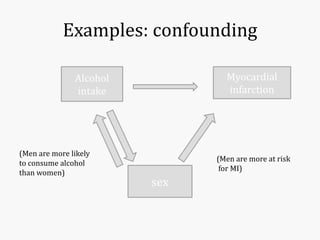
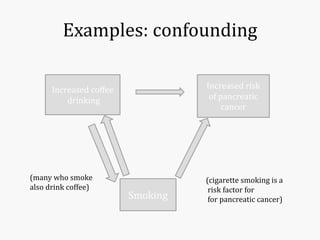
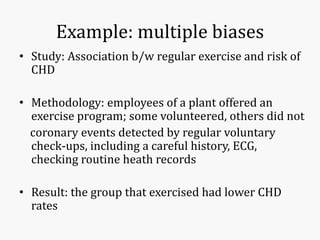
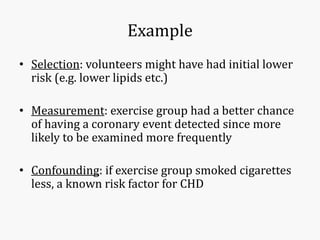
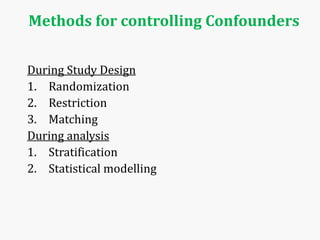
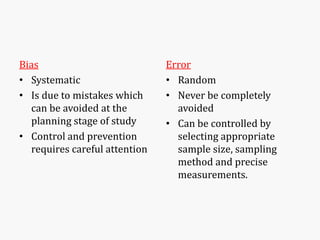
Systematic and random errors can affect epidemiological studies. Random errors are due to chance and include individual biological variation, measurement error, and sampling error. Systematic errors, also called biases, are non-random and can distort study results. Selection bias occurs if study groups differ in characteristics unrelated to exposure that influence outcomes. Measurement bias happens if exposures or diseases are inaccurately classified. Confounding is present when a third factor is associated with both the exposure and outcome under investigation. Careful study design and analysis techniques can help reduce biases and errors to obtain more accurate results.
Study designs, Epidemiological study design, Types of studiesDr Lipilekha Patnaik
Study design, Epidemiological study designA study design is a specific plan or protocol
for conducting the study, which allows the investigator to translate the conceptual hypothesis into an operational one.
Cross over design, Placebo and blinding techniques Dinesh Gangoda
A crossover design is a modified randomized block design in which each block receives more than one treatment at different dosing periods.
A block can be a patient or a group of patients.
Patients in each block receive different sequences of treatments.
A crossover design is called a complete crossover design if each sequence contains all treatments under investigation.
A placebo is a dummy medicine containing no active substance.
This substance has no therapeutic effect, used as a control in testing new drugs.
Latin- ‘ I shall please’
Methods of randomisation in clinical trialsAmy Mehaboob
Randomization is the process by which allocation of subjects to treatment groups is done by chance, without the ability to predict who is in what group. A randomized clinical trial is a clinical trial in which participants are randomly assigned to separate groups that compare different treatments.
Randomized trials are gold standard of study designs because the potential for bias (selection into treatment groups) is avoided.
This document includes the purpose, types, advantages and disadvantages of each type of randomisation.
EpidemiologyUnit 3Bias, Error, Confounding and Effect Modification4hrs
Radha Maharjan
MN(WHD)
Contents
3.1 Bias and Error in Epidemiology
3.1.1 Bias (Researcher and Respondent)
Recall Bias
Information Bias ( sponsor bias, social desirability bias, acquiescence Bias)
Selection Bias
Confirmation Bias
The halo effect.
Contents
3.1.2 Error
Systematic Error
Random Error
Confounding & Effect Modification
Definition of Error
A measure of the estimated difference between the observed or calculated value of a quantity and its true value.
Random error or Chance
It is the by-chance error
It makes observed value different from the true value
May occur through sampling variability or random fluctuation of the event of interest due to
biological variability, sampling error and measurement error (not due to machine)
lack of precision in the measurement of an association
Biological variability:
The natural variability in a lab parameter due to physiologic differences among subjects and within the same subject over time.
Differences between subjects due to differences in diet, genetics or immune status.
Sampling error:
Sampling error is a statistical error that occurs when an analyst does not select a sample that represents the entire population of data.
Measurement error:
Measurement Error (also called Observational Error) is the difference between a measured quantity and its true value.
Random error or Chance
Random error can never be completely eliminated since we can study only a sample of the population.
Random error can be reduced by
careful measurement of exposure and outcome
Proper selection of study
Taking larger sample- increase the size of the study.
Systematic error or Bias
Systematic error (or bias) occurs in epidemiology when results differ in a systematic manner from the true values.
Bias is any difference between the true value and observed value due to all causes other than random fluctuation and sampling variability.
This type of error is generally more insidious and hard to detect.
Systematic error or Bias
For example over-estimate of blood sugar of every subject by 0.05 mmol/l resulted from using inaccurate analyser.
The possible sources of systematic error are many and varied but the important biases are selection bias, measurement bias, confounding, information bias, recall (respondent) bias, etc..
Sources of error in epidemiological study
Common sources of error are
selection bias
absence or inadequacy of controls
unwarranted conclusions
improper interpretation of associations
mixing of non-comparable records
errors of measurement (intra-observer variation, inter-observer variation), etc.
The error can be minimised through
study design (by randomisation, restriction & matching) and
during analysis of the results (by stratification and statistical modelling) ..
Selection bias
Excelsior College PBH 321 Page 1 EXPERI MENTAL E.docxgitagrimston
Excelsior College PBH 321
Page 1
EXPERI MENTAL E PIDE MIOLOGICAL STUDIE S
Epidemiologic studies are either observational or experimental. Observational studies, including ecologic,
cross-sectional, cohort, and case-control designs, are considered “natural” experiments, but experimental
studies are considered true experiments. We will spend the next 2 modules discussing these designs.
Before we begin to discuss study designs, we need a brief introduction to a concept that we will spend more
time discussing in later modules -- bias. The definition of bias is:
“Deviation of results or inferences from the truth, or processes leading to such deviation. Any trend in the
collection, analysis, interpretation, publication, or review of data that can lead to conclusions that are
systematically different from the truth.” (Last, J.M., A Dictionary of Epidemiology, 4th ed.)
Epidemiologists are naturally concerned whether the results of an epidemiologic study are biased, since many
important public health decisions are often drawn from epidemiologic research. The severity of the bias, that
is - how much it influences or distorts the results, is related to the study design as well as how information is
analyzed.
Experimental Studies
The defining feature of experimental studies is that the investigator assigns exposure to the study subjects.
Experimental studies most closely resemble controlled laboratory experiments and serve as models for the
conduct of observational studies, thus they are the “gold standard” of epidemiologic research. Experimental
studies have high validity (i.e., less bias), and can identify even very small effects. The most well known type of
experimental study is a randomized trial (sometimes referred to as a randomized controlled trial), where the
investigator randomly assigns exposure to the study subjects. In this type of study, the only expected
difference between the experimental and control groups is the outcome variable being studied.
Experimental designs like the randomized trial can assess both preventive interventions, where a prophylactic
agent is given to healthy or high-risk individual to prevent disease, or can assess effects of therapeutic
treatment, such as those given to diseased individuals to reduce their risk of disease recurrence, or to improve
their survival or quality of life.
Preventive intervention: Does tamoxifen lower the incidence of breast cancer in women with high risk profile
compared to high risk women not given tamoxifen?
Therapeutic intervention: Do combinations of two or three antiretroviral drugs prolong survival of AIDS
patients as well as regimens of single drugs?
The investigator can assign exposures (or allocate interventions) to either individuals or to an entire
community.
Individual-level assignment: Do women with stage I breast cancer given a lumpectomy alone survive as long
without recurrence of disease as women given a lumpec ...
RANDOMIZED CONTROL trials
an assessment method
questions validity and applicability of many preventive and therapeutic procedures
reference Park's Preventive and social medicine
Ozempic: Preoperative Management of Patients on GLP-1 Receptor Agonists Saeid Safari
Preoperative Management of Patients on GLP-1 Receptor Agonists like Ozempic and Semiglutide
ASA GUIDELINE
NYSORA Guideline
2 Case Reports of Gastric Ultrasound
These simplified slides by Dr. Sidra Arshad present an overview of the non-respiratory functions of the respiratory tract.
Learning objectives:
1. Enlist the non-respiratory functions of the respiratory tract
2. Briefly explain how these functions are carried out
3. Discuss the significance of dead space
4. Differentiate between minute ventilation and alveolar ventilation
5. Describe the cough and sneeze reflexes
Study Resources:
1. Chapter 39, Guyton and Hall Textbook of Medical Physiology, 14th edition
2. Chapter 34, Ganong’s Review of Medical Physiology, 26th edition
3. Chapter 17, Human Physiology by Lauralee Sherwood, 9th edition
4. Non-respiratory functions of the lungs https://academic.oup.com/bjaed/article/13/3/98/278874
NVBDCP.pptx Nation vector borne disease control programSapna Thakur
NVBDCP was launched in 2003-2004 . Vector-Borne Disease: Disease that results from an infection transmitted to humans and other animals by blood-feeding arthropods, such as mosquitoes, ticks, and fleas. Examples of vector-borne diseases include Dengue fever, West Nile Virus, Lyme disease, and malaria.
Flu Vaccine Alert in Bangalore Karnatakaaddon Scans
As flu season approaches, health officials in Bangalore, Karnataka, are urging residents to get their flu vaccinations. The seasonal flu, while common, can lead to severe health complications, particularly for vulnerable populations such as young children, the elderly, and those with underlying health conditions.
Dr. Vidisha Kumari, a leading epidemiologist in Bangalore, emphasizes the importance of getting vaccinated. "The flu vaccine is our best defense against the influenza virus. It not only protects individuals but also helps prevent the spread of the virus in our communities," he says.
This year, the flu season is expected to coincide with a potential increase in other respiratory illnesses. The Karnataka Health Department has launched an awareness campaign highlighting the significance of flu vaccinations. They have set up multiple vaccination centers across Bangalore, making it convenient for residents to receive their shots.
To encourage widespread vaccination, the government is also collaborating with local schools, workplaces, and community centers to facilitate vaccination drives. Special attention is being given to ensuring that the vaccine is accessible to all, including marginalized communities who may have limited access to healthcare.
Residents are reminded that the flu vaccine is safe and effective. Common side effects are mild and may include soreness at the injection site, mild fever, or muscle aches. These side effects are generally short-lived and far less severe than the flu itself.
Healthcare providers are also stressing the importance of continuing COVID-19 precautions. Wearing masks, practicing good hand hygiene, and maintaining social distancing are still crucial, especially in crowded places.
Protect yourself and your loved ones by getting vaccinated. Together, we can help keep Bangalore healthy and safe this flu season. For more information on vaccination centers and schedules, residents can visit the Karnataka Health Department’s official website or follow their social media pages.
Stay informed, stay safe, and get your flu shot today!
Tom Selleck Health: A Comprehensive Look at the Iconic Actor’s Wellness Journeygreendigital
Tom Selleck, an enduring figure in Hollywood. has captivated audiences for decades with his rugged charm, iconic moustache. and memorable roles in television and film. From his breakout role as Thomas Magnum in Magnum P.I. to his current portrayal of Frank Reagan in Blue Bloods. Selleck's career has spanned over 50 years. But beyond his professional achievements. fans have often been curious about Tom Selleck Health. especially as he has aged in the public eye.
Follow us on: Pinterest
Introduction
Many have been interested in Tom Selleck health. not only because of his enduring presence on screen but also because of the challenges. and lifestyle choices he has faced and made over the years. This article delves into the various aspects of Tom Selleck health. exploring his fitness regimen, diet, mental health. and the challenges he has encountered as he ages. We'll look at how he maintains his well-being. the health issues he has faced, and his approach to ageing .
Early Life and Career
Childhood and Athletic Beginnings
Tom Selleck was born on January 29, 1945, in Detroit, Michigan, and grew up in Sherman Oaks, California. From an early age, he was involved in sports, particularly basketball. which played a significant role in his physical development. His athletic pursuits continued into college. where he attended the University of Southern California (USC) on a basketball scholarship. This early involvement in sports laid a strong foundation for his physical health and disciplined lifestyle.
Transition to Acting
Selleck's transition from an athlete to an actor came with its physical demands. His first significant role in "Magnum P.I." required him to perform various stunts and maintain a fit appearance. This role, which he played from 1980 to 1988. necessitated a rigorous fitness routine to meet the show's demands. setting the stage for his long-term commitment to health and wellness.
Fitness Regimen
Workout Routine
Tom Selleck health and fitness regimen has evolved. adapting to his changing roles and age. During his "Magnum, P.I." days. Selleck's workouts were intense and focused on building and maintaining muscle mass. His routine included weightlifting, cardiovascular exercises. and specific training for the stunts he performed on the show.
Selleck adjusted his fitness routine as he aged to suit his body's needs. Today, his workouts focus on maintaining flexibility, strength, and cardiovascular health. He incorporates low-impact exercises such as swimming, walking, and light weightlifting. This balanced approach helps him stay fit without putting undue strain on his joints and muscles.
Importance of Flexibility and Mobility
In recent years, Selleck has emphasized the importance of flexibility and mobility in his fitness regimen. Understanding the natural decline in muscle mass and joint flexibility with age. he includes stretching and yoga in his routine. These practices help prevent injuries, improve posture, and maintain mobilit
Prix Galien International 2024 Forum ProgramLevi Shapiro
June 20, 2024, Prix Galien International and Jerusalem Ethics Forum in ROME. Detailed agenda including panels:
- ADVANCES IN CARDIOLOGY: A NEW PARADIGM IS COMING
- WOMEN’S HEALTH: FERTILITY PRESERVATION
- WHAT’S NEW IN THE TREATMENT OF INFECTIOUS,
ONCOLOGICAL AND INFLAMMATORY SKIN DISEASES?
- ARTIFICIAL INTELLIGENCE AND ETHICS
- GENE THERAPY
- BEYOND BORDERS: GLOBAL INITIATIVES FOR DEMOCRATIZING LIFE SCIENCE TECHNOLOGIES AND PROMOTING ACCESS TO HEALTHCARE
- ETHICAL CHALLENGES IN LIFE SCIENCES
- Prix Galien International Awards Ceremony
Recomendações da OMS sobre cuidados maternos e neonatais para uma experiência pós-natal positiva.
Em consonância com os ODS – Objetivos do Desenvolvimento Sustentável e a Estratégia Global para a Saúde das Mulheres, Crianças e Adolescentes, e aplicando uma abordagem baseada nos direitos humanos, os esforços de cuidados pós-natais devem expandir-se para além da cobertura e da simples sobrevivência, de modo a incluir cuidados de qualidade.
Estas diretrizes visam melhorar a qualidade dos cuidados pós-natais essenciais e de rotina prestados às mulheres e aos recém-nascidos, com o objetivo final de melhorar a saúde e o bem-estar materno e neonatal.
Uma “experiência pós-natal positiva” é um resultado importante para todas as mulheres que dão à luz e para os seus recém-nascidos, estabelecendo as bases para a melhoria da saúde e do bem-estar a curto e longo prazo. Uma experiência pós-natal positiva é definida como aquela em que as mulheres, pessoas que gestam, os recém-nascidos, os casais, os pais, os cuidadores e as famílias recebem informação consistente, garantia e apoio de profissionais de saúde motivados; e onde um sistema de saúde flexível e com recursos reconheça as necessidades das mulheres e dos bebês e respeite o seu contexto cultural.
Estas diretrizes consolidadas apresentam algumas recomendações novas e já bem fundamentadas sobre cuidados pós-natais de rotina para mulheres e neonatos que recebem cuidados no pós-parto em unidades de saúde ou na comunidade, independentemente dos recursos disponíveis.
É fornecido um conjunto abrangente de recomendações para cuidados durante o período puerperal, com ênfase nos cuidados essenciais que todas as mulheres e recém-nascidos devem receber, e com a devida atenção à qualidade dos cuidados; isto é, a entrega e a experiência do cuidado recebido. Estas diretrizes atualizam e ampliam as recomendações da OMS de 2014 sobre cuidados pós-natais da mãe e do recém-nascido e complementam as atuais diretrizes da OMS sobre a gestão de complicações pós-natais.
O estabelecimento da amamentação e o manejo das principais intercorrências é contemplada.
Recomendamos muito.
Vamos discutir essas recomendações no nosso curso de pós-graduação em Aleitamento no Instituto Ciclos.
Esta publicação só está disponível em inglês até o momento.
Prof. Marcus Renato de Carvalho
www.agostodourado.com
Title: Sense of Taste
Presenter: Dr. Faiza, Assistant Professor of Physiology
Qualifications:
MBBS (Best Graduate, AIMC Lahore)
FCPS Physiology
ICMT, CHPE, DHPE (STMU)
MPH (GC University, Faisalabad)
MBA (Virtual University of Pakistan)
Learning Objectives:
Describe the structure and function of taste buds.
Describe the relationship between the taste threshold and taste index of common substances.
Explain the chemical basis and signal transduction of taste perception for each type of primary taste sensation.
Recognize different abnormalities of taste perception and their causes.
Key Topics:
Significance of Taste Sensation:
Differentiation between pleasant and harmful food
Influence on behavior
Selection of food based on metabolic needs
Receptors of Taste:
Taste buds on the tongue
Influence of sense of smell, texture of food, and pain stimulation (e.g., by pepper)
Primary and Secondary Taste Sensations:
Primary taste sensations: Sweet, Sour, Salty, Bitter, Umami
Chemical basis and signal transduction mechanisms for each taste
Taste Threshold and Index:
Taste threshold values for Sweet (sucrose), Salty (NaCl), Sour (HCl), and Bitter (Quinine)
Taste index relationship: Inversely proportional to taste threshold
Taste Blindness:
Inability to taste certain substances, particularly thiourea compounds
Example: Phenylthiocarbamide
Structure and Function of Taste Buds:
Composition: Epithelial cells, Sustentacular/Supporting cells, Taste cells, Basal cells
Features: Taste pores, Taste hairs/microvilli, and Taste nerve fibers
Location of Taste Buds:
Found in papillae of the tongue (Fungiform, Circumvallate, Foliate)
Also present on the palate, tonsillar pillars, epiglottis, and proximal esophagus
Mechanism of Taste Stimulation:
Interaction of taste substances with receptors on microvilli
Signal transduction pathways for Umami, Sweet, Bitter, Sour, and Salty tastes
Taste Sensitivity and Adaptation:
Decrease in sensitivity with age
Rapid adaptation of taste sensation
Role of Saliva in Taste:
Dissolution of tastants to reach receptors
Washing away the stimulus
Taste Preferences and Aversions:
Mechanisms behind taste preference and aversion
Influence of receptors and neural pathways
Impact of Sensory Nerve Damage:
Degeneration of taste buds if the sensory nerve fiber is cut
Abnormalities of Taste Detection:
Conditions: Ageusia, Hypogeusia, Dysgeusia (parageusia)
Causes: Nerve damage, neurological disorders, infections, poor oral hygiene, adverse drug effects, deficiencies, aging, tobacco use, altered neurotransmitter levels
Neurotransmitters and Taste Threshold:
Effects of serotonin (5-HT) and norepinephrine (NE) on taste sensitivity
Supertasters:
25% of the population with heightened sensitivity to taste, especially bitterness
Increased number of fungiform papillae
Ethanol (CH3CH2OH), or beverage alcohol, is a two-carbon alcohol
that is rapidly distributed in the body and brain. Ethanol alters many
neurochemical systems and has rewarding and addictive properties. It
is the oldest recreational drug and likely contributes to more morbidity,
mortality, and public health costs than all illicit drugs combined. The
5th edition of the Diagnostic and Statistical Manual of Mental Disorders
(DSM-5) integrates alcohol abuse and alcohol dependence into a single
disorder called alcohol use disorder (AUD), with mild, moderate,
and severe subclassifications (American Psychiatric Association, 2013).
In the DSM-5, all types of substance abuse and dependence have been
combined into a single substance use disorder (SUD) on a continuum
from mild to severe. A diagnosis of AUD requires that at least two of
the 11 DSM-5 behaviors be present within a 12-month period (mild
AUD: 2–3 criteria; moderate AUD: 4–5 criteria; severe AUD: 6–11 criteria).
The four main behavioral effects of AUD are impaired control over
drinking, negative social consequences, risky use, and altered physiological
effects (tolerance, withdrawal). This chapter presents an overview
of the prevalence and harmful consequences of AUD in the U.S.,
the systemic nature of the disease, neurocircuitry and stages of AUD,
comorbidities, fetal alcohol spectrum disorders, genetic risk factors, and
pharmacotherapies for AUD.
Report Back from SGO 2024: What’s the Latest in Cervical Cancer?bkling
Are you curious about what’s new in cervical cancer research or unsure what the findings mean? Join Dr. Emily Ko, a gynecologic oncologist at Penn Medicine, to learn about the latest updates from the Society of Gynecologic Oncology (SGO) 2024 Annual Meeting on Women’s Cancer. Dr. Ko will discuss what the research presented at the conference means for you and answer your questions about the new developments.
Report Back from SGO 2024: What’s the Latest in Cervical Cancer?
Error, bias and confounding
1. Error, Bias and Confounding
Presenter: Dr. Mitasha Singh
Moderator: Dr. SK Raina
30.10.15
2. Error- Definitions
• A false or mistaken result obtained in a study or
experiment
• Random error is the portion of variation in
measurement that has no apparent connection to
any other measurement or variable, generally
regarded as due to chance
• Systematic error which often has a recognizable
source, e.g., a faulty measuring instrument, or
pattern, e.g., it is consistently wrong in a particular
direction
(Last)
3. Random error
• Divergence on the basis of chance alone of an
observation on a sample from the population
from the true population values
• ‘random’ because on an average it is as likely to
result in observed values being on one side of
the true value as on the other side
• Inherent in all observations
• Can be minimized, but never avoided altogether
4. Sources of random error
1. Individual biological variation
2. Measurement error
3. Sampling error
5. Measurement error
• errors in measuring exposure or disease
• Examples-
o Blood Pressure measurement- estimates show that
approximately 1/3rd of its observed variability is due to measurement
error.
o Nutrient instruments- food records, 24 hour recalls and
biomarkers
o Environment risk factors- laboratory and device error
o Hormone levels- lab error
o Tape incorrectly fixed to height board
o Scale consistently reads low by 0.5 kg
o Failure to remove heavy clothing before weighing
o Misleading questions
6. Sampling error
• Since inclusion of individuals in a sample is
determined by chance, the results of analysis
on two or more samples will differ purely by
chance. (Last)
• Influenced by:
– Sample size (Greater with smaller sample sizes)
– Sampling scheme
8. Hypothesis testing
• Start off with the Null Hypothesis (H0)
• the statistical hypothesis that one variable has
no association with another variable or set of
variables, or that two or more population
distributions do not differ from one another
• the null hypothesis states that the results
observed in a study, experiment or test are no
different from what might have occurred as a
result of operation of chance alone
(Last)
9. Statistical tests – errors
Null hypothesis (Ho)
(H0) false (H0) true
CONCLUSION
OF
STATISTICAL
TEST
SIGNIFICANT
(H0) Rejected
NOT
SIGNIFICANT
(H0) Accepted
Type I
( α ) error
Type II
( β ) error
Power
Fletcher
10. Statistical tests - errors
• Type I (α) error: error of rejecting a true null
hypothesis , i.e. declaring a difference exists
when it does not
• Type II (β) error: error of failing to reject a false
null hypothesis , i.e. declaring that a difference
does not exist when in fact it does
• Power of a study: ability of a study to
demonstrate an association if one exists
Power = 1- β
11. Estimation
• Effect size observed in a particular study is
called ‘Point estimate’
• True effect is unlikely to be exactly that
observed in study because of random variation
• Confidence interval (CI): interval computed
with a given probability e.g. 95%, that the true
value such as a mean, proportion, or rate is
contained within the interval
12. Confidence intervals
If the study is unbiased, there is a 95% chance that
that the interval includes the true effect size. The
true value is likely to be close to the point estimate,
less likely to be near the outer limits of that
interval, and could (5 times out of 100) fall outside
these limits altogether.
Fletcher
14. Dealing with error
• Increasing the sample size: sample size depends
upon
- level of statistical significance (α error)
- Acceptable chance of missing a real effect (β error)
- Magnitude of effect under investigation
- Amount of disease in population
- Relative sizes of groups being compared
• Systematic quality control procedures to reduce
measurement error.
15. Bias
• Deviation of results or inferences from the truth, or
processes leading to such deviation. Any trend in
the collection, analysis, interpretation, publication,
or review of data that can lead to conclusions that
are systematically different from the truth.
(Last)
• A process at any stage of inference tending to
produce results that depart systematically from
true values. (Fletcher)
16. Relationship b/w Bias and Chance
Chance
Bias
Diastolic Blood Pressure (mm Hg)
90
BP measurement
(sphygmomanometer)
18. Selection bias
• Errors due to systematic differences in
characteristics between those who are selected for
study and those who are not.
(Last; Beaglehole)
• When comparisons are made between groups of
patients that differ in ways other than the main
factors under study, that affect the outcome under
study. (Fletcher)
19. Examples of Selection bias
• Subjects: hospital cases under the care of a
physician
• Excluded:
1. Die before admission – acute/severe disease.
2. Not sick enough to require hospital care
3. Do not have access due to cost, distance etc.
• Result: conclusions cannot be generalized
(Last)
20. Examples: selection bias
• Respondents to study on ‘effects of smoking’ usually
are not as heavy smokers as non-respondents hence
they volunteer either because they are unwell, or
worried about an exposure
• In a cohort study of newborn children, the
proportion successfully followed up for 12 months
varied according to the income level of the parents
21. Example: selection bias
• Question: association b/w formaldehyde
exposure and eye irritation
• Subjects: factory workers exposed to
formaldehyde
• Bias: those who suffer most from eye irritation
are likely to leave the job at their own request
or on medical advice
• Result: remaining workers are less affected;
association effect is diluted
22. Measurement bias
• Systematic error arising from inaccurate
measurements (or classification) of subjects or
study variables. (Last)
• Occurs when individual measurements or
classifications of disease or exposure are
inaccurate (i.e. they do not measure correctly what
they are supposed to measure)
(Beaglehole)
• If patients in one group stand a better chance of
having their outcomes detected than those in
another group.
(Fletcher)
23. Example: Measurement bias
Theoretical definition
• Exposure: passive
smoking – inhalation of
tobacco smoke from
other people’s smoking
• Disease: Myocardial
infarction – necrosis of
the heart muscle tissue
Empirical definition
• Exposure: passive
smoking – time spent
with smokers (having
smokers as room-
mates)
• Disease: Myocardial
infarction – certain
diagnostic criteria
(chest pain, enzyme
levels, signs on ECG)
24. Example: measurement bias
• analysis of Hb by different methods
(cyanmethemoglobin and Sahli's) in cases and
controls.
• biochemical analysis of the two groups from two
different laboratories, which give consistently
different results
25. Example: measurement bias
• patients suffering from MI are more likely to
recall and report ‘lack of exercise’ in the past
than controls. (differences in accuracy or completeness of
recall to memory of past events or experience.)
• Use of information taken from medical records
to determine if women on birth control pills
were at greater risk for thromboembolism than
those not on pill. (women with thrombophlebitis, if aware of
association b/w estrogens and thrombotic events, might report
use of ocp more completely than women without phlebitis)
26. Accuracy
The degree to which a measurement, or an
estimate based on measurements, represents
the true value of the attribute that is being
measured.
Last. A Dictionary of Epidemiology. 1988
27. Methods for controlling Selection Bias
During Study Design
1. Randomization
2. Restriction
3. Matching
During analysis
1. Stratification
2. Adjustment
28. Dealing with measurement bias
1. Blinding
- Subject
- Observer / interviewer
- Analyser
2. Strict definition / standard definition for
exposure / disease / outcome
3. Equal efforts to discover events equally in
all the groups
29. Confounding
1. A situation in which the effects of two processes are not
separated. The distortion of the apparent effect of an
exposure on risk brought about by the association with
other factors that can influence the outcome
2. A relationship b/w the effects of two or more causal
factors as observed in a set of data such that it is not
logically possible to separate the contribution that any
single causal factor has made to an effect
(Last)
30. Confounder … must be
1. Risk factor among the unexposed (itself a
determinant of disease)
2. Associated with the exposure under study
3. Unequally distributed among the exposed and
the unexposed groups
31. Examples: confounding
Smoking Lung cancer
AgeIf the average ages of the
smoking and non-smoking
groups are very different)
(As age advances
chances of lung
cancer increase)
34. Example: multiple biases
• Study: Association b/w regular exercise and risk of
CHD
• Methodology: employees of a plant offered an
exercise program; some volunteered, others did not
coronary events detected by regular voluntary
check-ups, including a careful history, ECG,
checking routine heath records
• Result: the group that exercised had lower CHD
rates
35. Example
• Selection: volunteers might have had initial lower
risk (e.g. lower lipids etc.)
• Measurement: exercise group had a better chance
of having a coronary event detected since more
likely to be examined more frequently
• Confounding: if exercise group smoked cigarettes
less, a known risk factor for CHD
36. Methods for controlling Confounders
During Study Design
1. Randomization
2. Restriction
3. Matching
During analysis
1. Stratification
2. Statistical modelling
37. Bias
• Systematic
• Is due to mistakes which
can be avoided at the
planning stage of study
• Control and prevention
requires careful attention
Error
• Random
• Never be completely
avoided
• Can be controlled by
selecting appropriate
sample size, sampling
method and precise
measurements.
( the part of the total estimation of error of a parameter caused by the random nature of the sample)
Unlike nonsampling bias and sampling bias, it can be predicted, calculated, and accounted for.
Difference between survey result and population value
Due to random selection of sample
Exclude the chance of missing the true differences= power= prob of getting a significant difference which really exists
CI allows the reader to see the range of plausible values and so to decide whether the effect size they regard as clinically meaningful is consistent with or ruled out by the data
In short, obtaining similar results with
repeated measurement
Also known as ‘Ascertainment Bias’
Response bias
A phenomenon observed initially in studies of occupational diseases: workers usually exhibit lower overall death rates than the general population, because the severely ill and chronically disabled are ordinarily excluded from employment. Death rates in the general population may be inappropriate for comparison if this effect is not taken into account.
Gap b/w the theoretical and empirical definition of exposure / disease