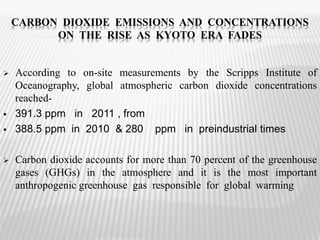
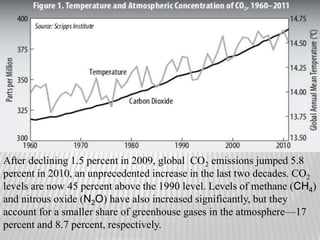
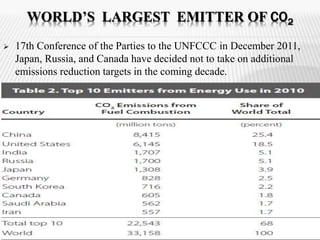
ENVIRONMENT AND CLIMATE TRENDS
CARBON DIOXIDE EMISSIONS AND CONCENTRATIONS 
ON THE RISE AS KYOTO ERA FADES 
 According to on-site measurements by the Scripps Institute of 
Oceanography, global atmospheric carbon dioxide concentrations 
reached- 
 391.3 ppm in 2011 , from 
 388.5 ppm in 2010 & 280 ppm in preindustrial times 
 Carbon dioxide accounts for more than 70 percent of the greenhouse 
gases (GHGs) in the atmosphere and it is the most important 
anthropogenic greenhouse gas responsible for global warming
After declining 1.5 percent in 2009, global CO2 emissions jumped 5.8 
percent in 2010, an unprecedented increase in the last two decades. CO2 
levels are now 45 percent above the 1990 level. Levels of methane (CH4) 
and nitrous oxide (N2O) have also increased significantly, but they 
account for a smaller share of greenhouse gases in the atmosphere—17 
percent and 8.7 percent, respectively.
CO2 EMISSIONS FROM ENERGY SECTORS 
 Deforestation and logging, forest and peat fires, and decomposition of 
organic carbon drained in peat soils are estimated at around 14% of 
global CO2 emissions; however, this number is highly uncertain and 
varies from 15% to 30% in last years. Industrial processes, mainly the 
production of cement, constitute another 5% of global CO2 emissions. 
 The energy sector represents the largest source of CO2emissions 
worldwide. In 2009, some 41% of energy-related CO2 emissions 
came from electricity generation and heating. Another 23% were 
produced by road, air, and marine transportation; 20% came from 
energy used in the industrial sector; and the residential sector 
accounted for 6% of energy-related emissions.
 In 2010, coal combustion constituted 40% of energy related CO2 
emissions, while oil represented 37% and natural gas 20 percent. 
Burning coal generates about twice as much CO2 as gas and oil do 
because of the larger carbon content per unit of energy released.
 The year 2010 was marked by a general growth in CO2 emissions in 
developing countries as well as richer industrial ones. 
 Annex I countries—which includes most OECD (Organization for 
Economic Cooperation and Development) countries that were 
assigned internationally legally binding emissions reduction targets 
and all economies in transition—reduced their emissions from 1990 
levels 
 Annex I countries were expected to meet the 4.6% reduction 
mandated by the Kyoto Protocol by the end of 2012.But some 
countries, such as Australia, Canada, New Zealand, and Spain, will 
not meet their reduction targets. 
 The United States, which signed but never ratified the Kyoto Protocol 
will also be unable to meet its original reduction target of 6 % , as its 
greenhouse gases have increased by 12.9 % since 1990
WORLD’S LARGEST EMITTER OF CO2 
 17th Conference of the Parties to the UNFCCC in December 2011, 
Japan, Russia, and Canada have decided not to take on additional 
emissions reduction targets in the coming decade.
 In early 2007, the Intergovernmental Panel on Climate Change (IPCC) 
released its strongest statement yet linking CO2 emissions and 
increasing global temperatures, stating with more than 90% certainty 
that the warming over the past 50 years has been caused by human 
activities. Growth of CO2 levels in the atmosphere has been 
accompanied by significant temperature increase in the past decade: 
the global average surface temperature in 2011 was the ninth warmest 
since 1880. NASA scientists established 2000–09 as the warmest 
decade on record since 1880. 
 A recent report by the London-based Royal Society estimated that at 
4° Celsius of global temperature increase, which is in the middle of 
the range of current projections, half the world’s current agricultural 
land would become unusable, sea levels would rise by up to two 
meters, and around 40 percent of the world’s species would become 
extinct.
CARBON CAPTURE AND STORAGE( CCS) 
 CCS has three steps- 
1. Capturing CO2 from a source such as a power plant’s flue gas 
2. Moving this CO2 to a storage site 
3. Injecting it into a storage reservoir 
 There are three primary methods for that first step in power plants:- 
pre-combustion , post-combustion, and oxy-fuel combustion 
 Pre-combustion combines gasification of a solid fuel with CO2 
separation to yield a hydrogen gas, which can then be burned without 
emitting greenhouse gases 
 In post-combustion, CO2 is extracted from flue gases that emerge 
from the combustion process
 Oxy-fuel technology burns fuel in oxygen mixed with recycled flue 
gas rather than nitrogen-rich air, producing a CO2 -rich gas that is 
ready to be stored. 
 For power generation, pre-combustion and post-combustion 
technologies have attracted similar levels of investment $3.5 billion 
and $3.3 billion, respectively. Investments in oxy-fuel CCS are 
significantly smaller at $1.7 billion. 
 The main options for CO2 storage are deep saline aquifers and 
depleted oil and gas fields. Onshore depleted oil and gas fields are the 
cheapest option but a majority of the world’s identified storage 
capacity is found in deep saline aquifers.
CARBON CAPTURE AND STORAGE( CCS) 
 In March 2012, the Global CCS Institute identified 75 large-scale 
fully integrated CCS projects in 17 countries at various stages of 
development -4 projects fewer than at the end of 2010. Only 8 of these 
plants are operational. 
 These 8 projects store a combined total of 23.18 million tons of 
carbon dioxide a year, about as much as emitted annually by 4.5 
million passenger vehicles in the United States. 
 At the end of 2011, the United States remained the largest funder of 
large-scale CCS projects ($7.4 billion), having allocated $6.1 billion 
to projects and with an additional $1.3 billion set aside for future 
projects. The European Union has announced the next largest amount 
of funding ($5.6 billion), although Canada has actually allocated more 
money ($2.9 billion)
 There are now 7 large-scale CCS plants currently under construction, 
bringing the total annual storage capacity of operating and under-construction 
plants to 34.97 Mtpa. If the remaining 60 projects under 
planning or development are built, they would add an additional 
134.25 Mtpa of capacity. The total storage capacity of all active and 
planned large-scale CCS projects is 169.2 Mtpa , equivalent to only 
about 0.5 percent of global emissions from energy use in 2010 
 A total of 13 projects were canceled or post-poned in 2011 
 Governments and industry have continued to invest heavily in CCS 
with the aim of substantially decreasing CO2 emissions and combating 
climate change. Funding for CCS is mostly targeted at fossil fuel 
power plants, especially greenhouse gas–intensive coal plants
THANK YOU

Environment and climate trends (co2)

  • 1.
  • 2.
    CARBON DIOXIDE EMISSIONSAND CONCENTRATIONS ON THE RISE AS KYOTO ERA FADES  According to on-site measurements by the Scripps Institute of Oceanography, global atmospheric carbon dioxide concentrations reached-  391.3 ppm in 2011 , from  388.5 ppm in 2010 & 280 ppm in preindustrial times  Carbon dioxide accounts for more than 70 percent of the greenhouse gases (GHGs) in the atmosphere and it is the most important anthropogenic greenhouse gas responsible for global warming
  • 3.
    After declining 1.5percent in 2009, global CO2 emissions jumped 5.8 percent in 2010, an unprecedented increase in the last two decades. CO2 levels are now 45 percent above the 1990 level. Levels of methane (CH4) and nitrous oxide (N2O) have also increased significantly, but they account for a smaller share of greenhouse gases in the atmosphere—17 percent and 8.7 percent, respectively.
  • 4.
    CO2 EMISSIONS FROMENERGY SECTORS  Deforestation and logging, forest and peat fires, and decomposition of organic carbon drained in peat soils are estimated at around 14% of global CO2 emissions; however, this number is highly uncertain and varies from 15% to 30% in last years. Industrial processes, mainly the production of cement, constitute another 5% of global CO2 emissions.  The energy sector represents the largest source of CO2emissions worldwide. In 2009, some 41% of energy-related CO2 emissions came from electricity generation and heating. Another 23% were produced by road, air, and marine transportation; 20% came from energy used in the industrial sector; and the residential sector accounted for 6% of energy-related emissions.
  • 5.
     In 2010,coal combustion constituted 40% of energy related CO2 emissions, while oil represented 37% and natural gas 20 percent. Burning coal generates about twice as much CO2 as gas and oil do because of the larger carbon content per unit of energy released.
  • 6.
     The year2010 was marked by a general growth in CO2 emissions in developing countries as well as richer industrial ones.  Annex I countries—which includes most OECD (Organization for Economic Cooperation and Development) countries that were assigned internationally legally binding emissions reduction targets and all economies in transition—reduced their emissions from 1990 levels  Annex I countries were expected to meet the 4.6% reduction mandated by the Kyoto Protocol by the end of 2012.But some countries, such as Australia, Canada, New Zealand, and Spain, will not meet their reduction targets.  The United States, which signed but never ratified the Kyoto Protocol will also be unable to meet its original reduction target of 6 % , as its greenhouse gases have increased by 12.9 % since 1990
  • 8.
    WORLD’S LARGEST EMITTEROF CO2  17th Conference of the Parties to the UNFCCC in December 2011, Japan, Russia, and Canada have decided not to take on additional emissions reduction targets in the coming decade.
  • 10.
     In early2007, the Intergovernmental Panel on Climate Change (IPCC) released its strongest statement yet linking CO2 emissions and increasing global temperatures, stating with more than 90% certainty that the warming over the past 50 years has been caused by human activities. Growth of CO2 levels in the atmosphere has been accompanied by significant temperature increase in the past decade: the global average surface temperature in 2011 was the ninth warmest since 1880. NASA scientists established 2000–09 as the warmest decade on record since 1880.  A recent report by the London-based Royal Society estimated that at 4° Celsius of global temperature increase, which is in the middle of the range of current projections, half the world’s current agricultural land would become unusable, sea levels would rise by up to two meters, and around 40 percent of the world’s species would become extinct.
  • 11.
    CARBON CAPTURE ANDSTORAGE( CCS)  CCS has three steps- 1. Capturing CO2 from a source such as a power plant’s flue gas 2. Moving this CO2 to a storage site 3. Injecting it into a storage reservoir  There are three primary methods for that first step in power plants:- pre-combustion , post-combustion, and oxy-fuel combustion  Pre-combustion combines gasification of a solid fuel with CO2 separation to yield a hydrogen gas, which can then be burned without emitting greenhouse gases  In post-combustion, CO2 is extracted from flue gases that emerge from the combustion process
  • 12.
     Oxy-fuel technologyburns fuel in oxygen mixed with recycled flue gas rather than nitrogen-rich air, producing a CO2 -rich gas that is ready to be stored.  For power generation, pre-combustion and post-combustion technologies have attracted similar levels of investment $3.5 billion and $3.3 billion, respectively. Investments in oxy-fuel CCS are significantly smaller at $1.7 billion.  The main options for CO2 storage are deep saline aquifers and depleted oil and gas fields. Onshore depleted oil and gas fields are the cheapest option but a majority of the world’s identified storage capacity is found in deep saline aquifers.
  • 13.
    CARBON CAPTURE ANDSTORAGE( CCS)  In March 2012, the Global CCS Institute identified 75 large-scale fully integrated CCS projects in 17 countries at various stages of development -4 projects fewer than at the end of 2010. Only 8 of these plants are operational.  These 8 projects store a combined total of 23.18 million tons of carbon dioxide a year, about as much as emitted annually by 4.5 million passenger vehicles in the United States.  At the end of 2011, the United States remained the largest funder of large-scale CCS projects ($7.4 billion), having allocated $6.1 billion to projects and with an additional $1.3 billion set aside for future projects. The European Union has announced the next largest amount of funding ($5.6 billion), although Canada has actually allocated more money ($2.9 billion)
  • 15.
     There arenow 7 large-scale CCS plants currently under construction, bringing the total annual storage capacity of operating and under-construction plants to 34.97 Mtpa. If the remaining 60 projects under planning or development are built, they would add an additional 134.25 Mtpa of capacity. The total storage capacity of all active and planned large-scale CCS projects is 169.2 Mtpa , equivalent to only about 0.5 percent of global emissions from energy use in 2010  A total of 13 projects were canceled or post-poned in 2011  Governments and industry have continued to invest heavily in CCS with the aim of substantially decreasing CO2 emissions and combating climate change. Funding for CCS is mostly targeted at fossil fuel power plants, especially greenhouse gas–intensive coal plants
  • 16.