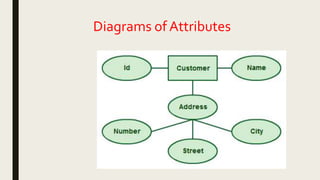
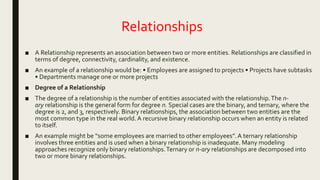
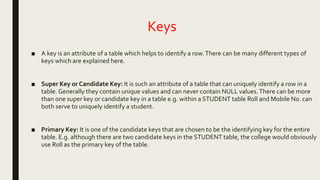
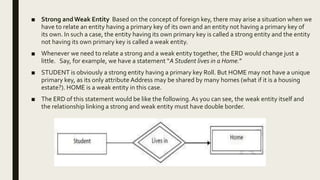
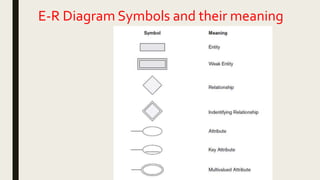
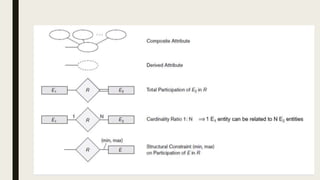
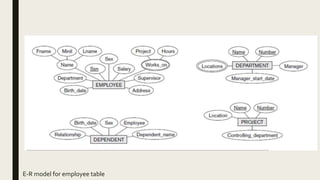
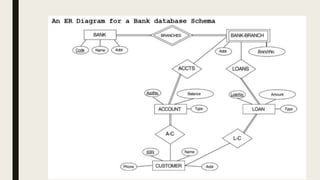
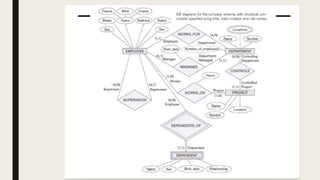
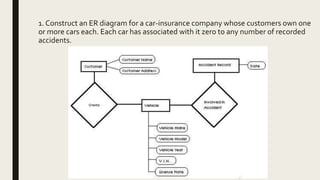
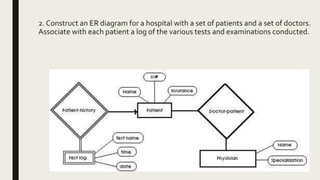
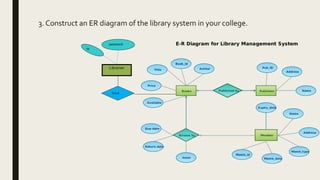
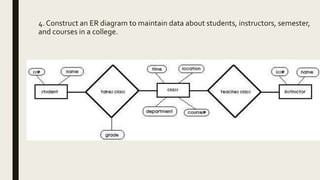
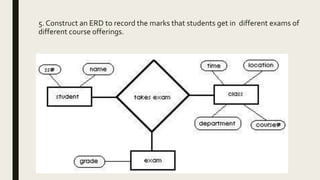
The document provides information on the key concepts of an entity-relationship (E-R) model, including:
1) Entities represent real-world objects like people, places, and things that are stored in a database. Attributes describe the properties of entities.
2) Relationships represent associations between entities. Relationships have properties like degree, cardinality, and existence.
3) Keys like primary keys and foreign keys uniquely identify entities and define relationships between entities.
4) Strong and weak entities differ in whether they have their own primary keys or rely on other entities.
5) E-R diagrams visually depict entities, attributes, relationships, keys and other concepts to model a database.
You can get clear knowledge about the functional dependencies in "Normalization". And also the rules, types of FDs and finally the closure and its applications
An Entity–relationship model (ER model) describes the structure of a database with the help of a diagram, which is known as Entity Relationship Diagram (ER Diagram). An ER model is a design or blueprint of a database that can later be implemented as a database. The main components of E-R model are: entity set and relationship set
Data modeling is a process used to define and analyze data requirements needed to support the business processes within the scope of corresponding information systems in organizations.
Techniques to optimize the pagerank algorithm usually fall in two categories. One is to try reducing the work per iteration, and the other is to try reducing the number of iterations. These goals are often at odds with one another. Skipping computation on vertices which have already converged has the potential to save iteration time. Skipping in-identical vertices, with the same in-links, helps reduce duplicate computations and thus could help reduce iteration time. Road networks often have chains which can be short-circuited before pagerank computation to improve performance. Final ranks of chain nodes can be easily calculated. This could reduce both the iteration time, and the number of iterations. If a graph has no dangling nodes, pagerank of each strongly connected component can be computed in topological order. This could help reduce the iteration time, no. of iterations, and also enable multi-iteration concurrency in pagerank computation. The combination of all of the above methods is the STICD algorithm. [sticd] For dynamic graphs, unchanged components whose ranks are unaffected can be skipped altogether.
Data Centers - Striving Within A Narrow Range - Research Report - MCG - May 2...pchutichetpong
M Capital Group (“MCG”) expects to see demand and the changing evolution of supply, facilitated through institutional investment rotation out of offices and into work from home (“WFH”), while the ever-expanding need for data storage as global internet usage expands, with experts predicting 5.3 billion users by 2023. These market factors will be underpinned by technological changes, such as progressing cloud services and edge sites, allowing the industry to see strong expected annual growth of 13% over the next 4 years.
Whilst competitive headwinds remain, represented through the recent second bankruptcy filing of Sungard, which blames “COVID-19 and other macroeconomic trends including delayed customer spending decisions, insourcing and reductions in IT spending, energy inflation and reduction in demand for certain services”, the industry has seen key adjustments, where MCG believes that engineering cost management and technological innovation will be paramount to success.
MCG reports that the more favorable market conditions expected over the next few years, helped by the winding down of pandemic restrictions and a hybrid working environment will be driving market momentum forward. The continuous injection of capital by alternative investment firms, as well as the growing infrastructural investment from cloud service providers and social media companies, whose revenues are expected to grow over 3.6x larger by value in 2026, will likely help propel center provision and innovation. These factors paint a promising picture for the industry players that offset rising input costs and adapt to new technologies.
According to M Capital Group: “Specifically, the long-term cost-saving opportunities available from the rise of remote managing will likely aid value growth for the industry. Through margin optimization and further availability of capital for reinvestment, strong players will maintain their competitive foothold, while weaker players exit the market to balance supply and demand.”
Explore our comprehensive data analysis project presentation on predicting product ad campaign performance. Learn how data-driven insights can optimize your marketing strategies and enhance campaign effectiveness. Perfect for professionals and students looking to understand the power of data analysis in advertising. for more details visit: https://bostoninstituteofanalytics.org/data-science-and-artificial-intelligence/
Chatty Kathy - UNC Bootcamp Final Project Presentation - Final Version - 5.23...John Andrews
SlideShare Description for "Chatty Kathy - UNC Bootcamp Final Project Presentation"
Title: Chatty Kathy: Enhancing Physical Activity Among Older Adults
Description:
Discover how Chatty Kathy, an innovative project developed at the UNC Bootcamp, aims to tackle the challenge of low physical activity among older adults. Our AI-driven solution uses peer interaction to boost and sustain exercise levels, significantly improving health outcomes. This presentation covers our problem statement, the rationale behind Chatty Kathy, synthetic data and persona creation, model performance metrics, a visual demonstration of the project, and potential future developments. Join us for an insightful Q&A session to explore the potential of this groundbreaking project.
Project Team: Jay Requarth, Jana Avery, John Andrews, Dr. Dick Davis II, Nee Buntoum, Nam Yeongjin & Mat Nicholas
As Europe's leading economic powerhouse and the fourth-largest hashtag#economy globally, Germany stands at the forefront of innovation and industrial might. Renowned for its precision engineering and high-tech sectors, Germany's economic structure is heavily supported by a robust service industry, accounting for approximately 68% of its GDP. This economic clout and strategic geopolitical stance position Germany as a focal point in the global cyber threat landscape.
In the face of escalating global tensions, particularly those emanating from geopolitical disputes with nations like hashtag#Russia and hashtag#China, hashtag#Germany has witnessed a significant uptick in targeted cyber operations. Our analysis indicates a marked increase in hashtag#cyberattack sophistication aimed at critical infrastructure and key industrial sectors. These attacks range from ransomware campaigns to hashtag#AdvancedPersistentThreats (hashtag#APTs), threatening national security and business integrity.
🔑 Key findings include:
🔍 Increased frequency and complexity of cyber threats.
🔍 Escalation of state-sponsored and criminally motivated cyber operations.
🔍 Active dark web exchanges of malicious tools and tactics.
Our comprehensive report delves into these challenges, using a blend of open-source and proprietary data collection techniques. By monitoring activity on critical networks and analyzing attack patterns, our team provides a detailed overview of the threats facing German entities.
This report aims to equip stakeholders across public and private sectors with the knowledge to enhance their defensive strategies, reduce exposure to cyber risks, and reinforce Germany's resilience against cyber threats.
Show drafts
volume_up
Empowering the Data Analytics Ecosystem: A Laser Focus on Value
The data analytics ecosystem thrives when every component functions at its peak, unlocking the true potential of data. Here's a laser focus on key areas for an empowered ecosystem:
1. Democratize Access, Not Data:
Granular Access Controls: Provide users with self-service tools tailored to their specific needs, preventing data overload and misuse.
Data Catalogs: Implement robust data catalogs for easy discovery and understanding of available data sources.
2. Foster Collaboration with Clear Roles:
Data Mesh Architecture: Break down data silos by creating a distributed data ownership model with clear ownership and responsibilities.
Collaborative Workspaces: Utilize interactive platforms where data scientists, analysts, and domain experts can work seamlessly together.
3. Leverage Advanced Analytics Strategically:
AI-powered Automation: Automate repetitive tasks like data cleaning and feature engineering, freeing up data talent for higher-level analysis.
Right-Tool Selection: Strategically choose the most effective advanced analytics techniques (e.g., AI, ML) based on specific business problems.
4. Prioritize Data Quality with Automation:
Automated Data Validation: Implement automated data quality checks to identify and rectify errors at the source, minimizing downstream issues.
Data Lineage Tracking: Track the flow of data throughout the ecosystem, ensuring transparency and facilitating root cause analysis for errors.
5. Cultivate a Data-Driven Mindset:
Metrics-Driven Performance Management: Align KPIs and performance metrics with data-driven insights to ensure actionable decision making.
Data Storytelling Workshops: Equip stakeholders with the skills to translate complex data findings into compelling narratives that drive action.
Benefits of a Precise Ecosystem:
Sharpened Focus: Precise access and clear roles ensure everyone works with the most relevant data, maximizing efficiency.
Actionable Insights: Strategic analytics and automated quality checks lead to more reliable and actionable data insights.
Continuous Improvement: Data-driven performance management fosters a culture of learning and continuous improvement.
Sustainable Growth: Empowered by data, organizations can make informed decisions to drive sustainable growth and innovation.
By focusing on these precise actions, organizations can create an empowered data analytics ecosystem that delivers real value by driving data-driven decisions and maximizing the return on their data investment.
2. Entities
■ An entity is an object whose information is stored in the database. It is distinguishable from other
objects.
■ For example: specific person, company, event, plant.
■ In other words, any thing that may ‘have an independent existence and about which we intend to
collect data is known as Entity. It is also known as Entity type.
■ Entities are the principal data object about which information is to be collected. Entities are usually
recognizable concepts, either concrete or abstract, such as person, places, things, or events, which
have relevance to the database.
■ Some specific examples of entities are EMPLOYEES, PROJECTS, and INVOICES.An entity is
analogous to a table in the relational model. Entities are classified as independent or dependent (in
some methodologies, the terms used are strong and weak, respectively).
■ An independent entity is one that does not rely on another for identification.A dependent entity is
one that relies on another for identification.An entity occurrence (also called an instance) is an
individual occurrence of an entity. An occurrence is analogous to a row in the relational table.
3. Attributes
■ Attributes describe the properties of the entity of which they are associated.A particular instance of
an attribute is a value.
■ For example, “Ram” is one value of the attribute Name.The domain of an attribute is the collection
of all possible values an attribute can have.The domain of Name is a character string.
■ We can classify attributes as following types:
■ • Simple
■ • Composite
■ • Single-values
■ • Multi-values
■ • Derived
4. ■ Simple Attribute:A simple attribute is an attribute composed of a single component with an
independent existence. Simple attributes cannot be further subdivided. Examples of simple
attributes include Sex,Age, and Salary etc. Simple attributes are sometimes called atomic
attributes.
■ Composite Attribute: An attribute composed of multiple components, each with an independent
existence is called a composite attribute. Some attributes can be further divided to yield smaller
components with an independent existence of their own.
■ For example, the Address attribute can be composed of components like Street number, Area, City,
Pin code and so on.The decision to model the Address, Area, and City etc. is dependent on whether
the user view of the model refers to the Address attribute as a single unit or as individual
components.
■ Single-valuedAttribute: A single-valued attribute is one that holds a single value for a single entity.
The majority of attributes are single-valued for a particular entity. For example, the Classroom entity
has as single value for the room_number attribute and therefore the room_number attribute is
referred to as being single-valued.
5. ■ Multi-valuedAttribute: A multi-valued attribute is one that holds multiple values for a single
entity. Some attribute has multiple values for a particular entity. For example, a student entity can
have multiple values for the Hobby attribute-reading, music, movies and so on.A multi-valued
attribute may have set of numbers with upper and lower limits.
■ For example, the Hobby attribute of a Student may have between one and five values. In other
words, a student may have a minimum of one hobby and maximum of 5 hobbies.
■ DerivedAttribute: A derived attribute is one that represents a value that is derivable from the
value of a related attribute or set of attributes, not necessarily in the same entity. Some attributes
may be related for a particular entity.
■ For example the Age attribute can be derived from the date-of-birth attribute and therefore they
are related.We refer the age attribute as a derived attribute, the value of which is derived from
the date-of-birth attribute.
8. Relationships
■ A Relationship represents an association between two or more entities. Relationships are classified in
terms of degree, connectivity, cardinality, and existence.
■ An example of a relationship would be: • Employees are assigned to projects • Projects have subtasks
• Departments manage one or more projects
■ Degree of a Relationship
■ The degree of a relationship is the number of entities associated with the relationship.The n-
ary relationship is the general form for degree n. Special cases are the binary, and ternary, where the
degree is 2, and 3, respectively. Binary relationships, the association between two entities are the
most common type in the real world.A recursive binary relationship occurs when an entity is related
to itself.
■ An example might be “some employees are married to other employees”. A ternary relationship
involves three entities and is used when a binary relationship is inadequate. Many modeling
approaches recognize only binary relationships.Ternary or n-ary relationships are decomposed into
two or more binary relationships.
9. Keys
■ A key is an attribute of a table which helps to identify a row.There can be many different types of
keys which are explained here.
■ Super Key or Candidate Key: It is such an attribute of a table that can uniquely identify a row in a
table. Generally they contain unique values and can never contain NULL values.There can be more
than one super key or candidate key in a table e.g. within a STUDENT table Roll and Mobile No. can
both serve to uniquely identify a student.
■ Primary Key: It is one of the candidate keys that are chosen to be the identifying key for the entire
table. E.g. although there are two candidate keys in the STUDENT table, the college would obviously
use Roll as the primary key of the table.
10. ■ Alternate Key: This is the candidate key which is not chosen as the primary key of the table.They
are named so because although not the primary key, they can still identify a row.
■ Composite Key: Sometimes one key is not enough to uniquely identify a row. E.g. in a single class
Roll is enough to find a student, but in the entire school, merely searching by the Roll is not
enough, because there could be 10 classes in the school and each one of them may contain a
certain roll no 5.To uniquely identify the student we have to say something like “classVII, roll no 5”.
So, a combination of two or more attributes is combined to create a unique combination of values,
such as Class + Roll.
■ Foreign Key: Sometimes we may have to work with an attribute that does not have a primary key
of its own.To identify its rows, we have to use the primary attribute of a related table. Such a copy
of another related table’s primary key is called foreign key
11. ■ Strong andWeak Entity Based on the concept of foreign key, there may arise a situation when we
have to relate an entity having a primary key of its own and an entity not having a primary key of
its own. In such a case, the entity having its own primary key is called a strong entity and the entity
not having its own primary key is called a weak entity.
■ Whenever we need to relate a strong and a weak entity together, the ERD would change just a
little. Say, for example, we have a statement “A Student lives in a Home.”
■ STUDENT is obviously a strong entity having a primary key Roll. But HOME may not have a unique
primary key, as its only attribute Address may be shared by many homes (what if it is a housing
estate?). HOME is a weak entity in this case.
■ The ERD of this statement would be like the following.As you can see, the weak entity itself and
the relationship linking a strong and weak entity must have double border.
12. How to Draw ER Diagrams
■ Below points show how to go about creating an ER diagram.
Identify all the entities in the system. An entity should appear only once in a particular
diagram. Create rectangles for all entities and name them properly.
Identify relationships between entities. Connect them using a line and add a diamond in the
middle describing the relationship.
Add attributes for entities. Give meaningful attribute names so they can be understood easily.
20. 1. Construct an ER diagram for a car-insurance company whose customers own one
or more cars each. Each car has associated with it zero to any number of recorded
accidents.
21. 2. Construct an ER diagram for a hospital with a set of patients and a set of doctors.
Associate with each patient a log of the various tests and examinations conducted.
22. 3. Construct an ER diagram of the library system in your college.
Librarian
password
Issue
23. 4. Construct an ER diagram to maintain data about students, instructors, semester,
and courses in a college.
24. 5. Construct an ERD to record the marks that students get in different exams of
different course offerings.