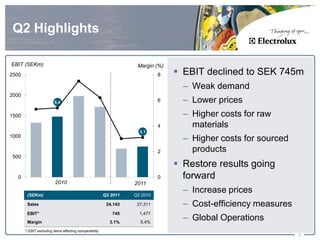
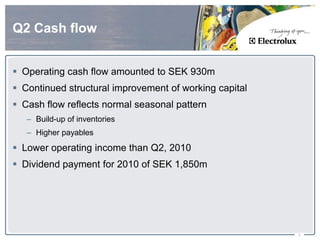
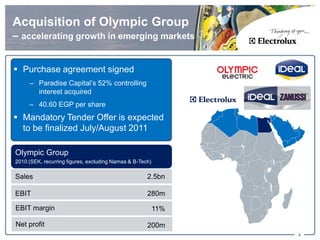
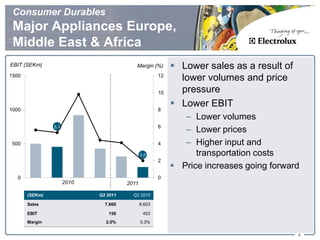
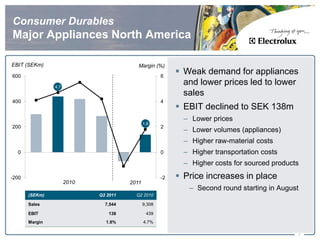
Q2 Results,
July 19, 2011
Keith McLoughlin,
President and CEO
Jonas Samuelson, CFO & COO
Peter Nyquist, SVP IR
Q2 Highlights

EBIT (SEKm)                                                            Margin (%)
2500                                                                            8    EBIT declined to SEK 745m
                                                                                      – Weak demand
2000
                         5,4                                                    6     – Lower prices
1500
         1326,0
                                                                                      – Higher costs for raw
                                                                                4       materials
                                                                        3,1
1000
                                                                                      – Higher costs for sourced
                                                              696,0
                                                                                2       products
 500
                                                                                     Restore results going
   0                                                                            0     forward
                          2010                                        2011

        (SEKm)                                           Q2 2011      Q2 2010
                                                                                      – Increase prices
        Sales                                             24,143       27,311         – Cost-efficiency measures
        EBIT*                                               745         1,477
        Margin                                             3.1%         5.4%
                                                                                      – Global Operations
       *) EBIT excluding items affecting comparability
                                                                                                                   2
Q2 Cash flow


 Operating cash flow amounted to SEK 930m
 Continued structural improvement of working capital
 Cash flow reflects normal seasonal pattern
   – Build-up of inventories
   – Higher payables
 Lower operating income than Q2, 2010
 Dividend payment for 2010 of SEK 1,850m


                                                        3
Acquisition of Olympic Group
– accelerating growth in emerging markets


 Purchase agreement signed
     – Paradise Capital’s 52% controlling
       interest acquired
     – 40.60 EGP per share
 Mandatory Tender Offer is expected
  to be finalized July/August 2011

Olympic Group
2010 (SEK, recurring figures, excluding Namaa & B-Tech)

Sales                                                2.5bn

EBIT                                                 280m

EBIT margin                                               11%

Net profit                                           200m
                                                                4
Consumer Durables
 Major Appliances Europe,
 Middle East & Africa
EBIT (SEKm)                                       Margin (%)        Lower sales as a result of
1500                                                          12
                                                                     lower volumes and price
                                                              10     pressure
                                                                    Lower EBIT
1000                                                          8
                                                                      – Lower volumes
                5,3                                           6
                                                                      – Lower prices
 500
        499,0
                                                              4       – Higher input and
                                       311,0
                                                      2,0                transportation costs
                                                              2
                                                                    Price increases going forward
   0                                                          0
                      2010                     2011

       (SEKm)                Q2 2011             Q2 2010

       Sales                   7,660                  8,603

       EBIT                     156                    453
       Margin                  2.0%                   5.3%

                                                                                                  5
Increased growth in Eastern
 Europe

                           Quarterly comparison, year over year

  10%

    5%

    0%

   -5%

 -10%

 -15%
                 2006                 2007                2008                  2009                 2010          2011
            Q1   Q2   Q3    Q4   Q1   Q2   Q3   Q4   Q1   Q2   Q3   Q4   Q1    Q2    Q3   Q4   Q1   Q2   Q3   Q4   Q1   Q2

W. Europe 4%     1%   1%    5% 1%     1%   -1% -5%   -4% -4% -5% -8%     -9%   -9%   -4% -2%   1%   0%   0%   0%   -2% -2%

E. Europe   1%   9%   6%    7% 14%    5%   5% 10%    6%   5%   4% -15% -31% -30% -26% -17% -7%      1%   5% 13%    13% 12%

                                                                                                                        6
Consumer Durables
Major Appliances North America

EBIT (SEKm)                               Margin (%)
600                                                   6
                                                            Weak demand for appliances
                4,7
                                                             and lower prices led to lower
                                                             sales
400                                                   4
                                                            EBIT declined to SEK 138m
                                                             – Lower prices
                                              1,8
200                                                   2
                                                             – Lower volumes (appliances)
                                                             – Higher raw-material costs
  0                                                   0      – Higher transportation costs
                                                             – Higher costs for sourced products
-200                                                  -2    Price increases in place
                      2010             2011
                                                              – Second round starting in August
       (SEKm)                Q2 2011     Q2 2010

       Sales                   7,544          9,308

       EBIT                     138            439
       Margin                  1.8%           4.7%

                                                                                               7
North America is estimated to
have declined by 10% in Q2

             Quarterly comparison, year-over-year

 15%
 10%
 5%
 0%
 -5%
-10%
-15%
-20%
       Q1 Q2 Q3 Q4 Q1 Q2 Q3 Q4 Q1 Q2 Q3 Q4 Q1 Q2 Q3 Q4 Q1 Q2 Q3 Q4 Q1 Q2

          2006        2007        2008        2009        2010     2011


                                                                          8
Consumer Durables
 Major Appliances Latin America

EBIT (SEKm)                              Margin (%)
400                                                  8
                                                          Market growth in Brazil at
                                                           lower pace
               5,7
                                                           – Strong growth in the rest of
300                                                  6
                                                             Latin America
                                                          EBIT declined to SEK 114m
200                                                  4
                                             3,1           – Negative customer mix due to
                                                             consolidation of retailers
100                                                  2     – Increased raw-material costs
                                                           – Price pressure
  0                                                  0     – Increased marketing
                     2010             2011
                                                             investments
      (SEKm)                Q2 2011     Q2 2010

      Sales                   3,708          3,667

      EBIT                     114            209
      Margin                  3.1%           5.7%
                                                                                            9
Consumer Durables
 Major Appliances Asia/Pacific

EBIT (SEKm)                                    Margin (%)
 300                                                   14
                                                             Market growth in Australia but
                                                              lower EBIT
                                                       12
                10,2                                          – Higher raw-material costs
 200
                                               9,1     10
                                                              – Price pressure
                                   174,0

        145,0
                                                       8
                                                             Southeast Asia and China
                                                       6      – Market-share gain in strong
 100
                                                       4
                                                                markets

                                                       2

   0                                                   0
                       2010             2011

       (SEKm)                 Q2 2011      Q2 2010

       Sales                    1,945          2,035

       EBIT                      177            207
       Margin                   9.1%        10.2%

                                                                                              10
Consumer Durables
 Small Appliances
EBIT (SEKm)                                         Margin (%)

 400                                                        15
                                                                  Higher sales in comparable
                                                                   currencies due to higher
                                                            12     volumes and improved mix
 300

                                                            9
                                                                  Lower EBIT
        211
 200            6,2
                                                                   – Higher product costs
                                       114
                                                            6
                                                                   – Increased investment in small
 100                                                                 domestic appliances
                                                            3
                                                    1,3
                                                                   – Price pressure
   0                                                        0      – Higher costs for raw materials
                      2010                   2011


       (SEKm)                Q2 2011           Q2 2010

       Sales                   1,794                1,966

       EBIT                      23                  122
       Margin                  1.3%                 6.2%

                                                                                                  11
Professional Products
 Food-service & Laundry products

EBIT (SEKm)                                          Margin (%)
                                                                   Lower sales and lower underlying
 400                                                 18,4    20
                                                                    EBIT for Food-service
                                                                    – Positive effect of SEK 90m related
 300                                                         15
                                                                      to a divestment
                12,0
                                                                    – Lower project sales in Southern
 200                                    177                  10       Europe
                                                                    – Higher raw-material costs
 100
         91
                                                             5      – Price increases
                                                                   Solid results for Laundry products
   0                                                         0      – Higher volumes
                       2010                   2011
                                                                    – Price increases
                                                                    – Negative mix impact
       (SEKm)                 Q2 2011           Q2 2010
                                                                    – Negative FX impact
       Sales                    1,491                1,730

       EBIT                      274                   207
                                                                    – Higher raw-material costs
       Margin                  18.4%             12.0%

                                                                                                        12
Q3 and H2 2011
In accordance with forward-looking statements
in the CEO letter


                        Q3 2011           H2 2011         Comment
                                                       Easier comparables
Volumes                  Higher             Higher     in US in Q3

                                           Slightly    Increases in NA and Latam,
Price                      Flat                        gradual increases in Europe in Q4
                                           positive
                                                       Mix improvement from product
                          Slightly
Mix                                             Flat   launches offset by negative
                         negative                      country/customer mix

                                                       SEK 800m in H2 whereof
Raw-material costs       Higher             Higher
                                                       SEK 500m in Q3

Costs from Global                                      Approximately evenly
                        SEK 125m          SEK 250m     distributed between quarters
Operations

 Manufacturing                                         Approximately evenly
                        SEK 125m          SEK 250m     distributed between quarters
 footprint savings


                                                                                      13
14
Factors affecting forward-
looking statements
Factors affecting forward-looking statements
This presentation contains “forward-looking” statements within the meaning
of the US Private Securities Litigation Reform Act of 1995. Such statements
include, among others, the financial goals and targets of Electrolux for
future periods and future business and financial plans. These statements
are based on current expectations and are subject to risks and uncertainties
that could cause actual results to differ materially due to a variety of factors.
These factors include, but may not be limited to the following: consumer
demand and market conditions in the geographical areas and industries in
which Electrolux operates, effects of currency fluctuations, competitive
pressures to reduce prices, significant loss of business from major retailers,
the success in developing new products and marketing initiatives,
developments in product liability litigation, progress in achieving operational
and capital efficiency goals, the success in identifying growth opportunities
and acquisition candidates and the integration of these opportunities with
existing businesses, progress in achieving structural and supply-chain
reorganization goals.

                                                                                    15

Electrolux Interim Report Q2 2011 Presentation

  • 1.
    Q2 Results, July 19,2011 Keith McLoughlin, President and CEO Jonas Samuelson, CFO & COO Peter Nyquist, SVP IR
  • 2.
    Q2 Highlights EBIT (SEKm) Margin (%) 2500 8  EBIT declined to SEK 745m – Weak demand 2000 5,4 6 – Lower prices 1500 1326,0 – Higher costs for raw 4 materials 3,1 1000 – Higher costs for sourced 696,0 2 products 500  Restore results going 0 0 forward 2010 2011 (SEKm) Q2 2011 Q2 2010 – Increase prices Sales 24,143 27,311 – Cost-efficiency measures EBIT* 745 1,477 Margin 3.1% 5.4% – Global Operations *) EBIT excluding items affecting comparability 2
  • 3.
    Q2 Cash flow Operating cash flow amounted to SEK 930m  Continued structural improvement of working capital  Cash flow reflects normal seasonal pattern – Build-up of inventories – Higher payables  Lower operating income than Q2, 2010  Dividend payment for 2010 of SEK 1,850m 3
  • 4.
    Acquisition of OlympicGroup – accelerating growth in emerging markets  Purchase agreement signed – Paradise Capital’s 52% controlling interest acquired – 40.60 EGP per share  Mandatory Tender Offer is expected to be finalized July/August 2011 Olympic Group 2010 (SEK, recurring figures, excluding Namaa & B-Tech) Sales 2.5bn EBIT 280m EBIT margin 11% Net profit 200m 4
  • 5.
    Consumer Durables MajorAppliances Europe, Middle East & Africa EBIT (SEKm) Margin (%)  Lower sales as a result of 1500 12 lower volumes and price 10 pressure  Lower EBIT 1000 8 – Lower volumes 5,3 6 – Lower prices 500 499,0 4 – Higher input and 311,0 2,0 transportation costs 2  Price increases going forward 0 0 2010 2011 (SEKm) Q2 2011 Q2 2010 Sales 7,660 8,603 EBIT 156 453 Margin 2.0% 5.3% 5
  • 6.
    Increased growth inEastern Europe Quarterly comparison, year over year 10% 5% 0% -5% -10% -15% 2006 2007 2008 2009 2010 2011 Q1 Q2 Q3 Q4 Q1 Q2 Q3 Q4 Q1 Q2 Q3 Q4 Q1 Q2 Q3 Q4 Q1 Q2 Q3 Q4 Q1 Q2 W. Europe 4% 1% 1% 5% 1% 1% -1% -5% -4% -4% -5% -8% -9% -9% -4% -2% 1% 0% 0% 0% -2% -2% E. Europe 1% 9% 6% 7% 14% 5% 5% 10% 6% 5% 4% -15% -31% -30% -26% -17% -7% 1% 5% 13% 13% 12% 6
  • 7.
    Consumer Durables Major AppliancesNorth America EBIT (SEKm) Margin (%) 600 6  Weak demand for appliances 4,7 and lower prices led to lower sales 400 4  EBIT declined to SEK 138m – Lower prices 1,8 200 2 – Lower volumes (appliances) – Higher raw-material costs 0 0 – Higher transportation costs – Higher costs for sourced products -200 -2  Price increases in place 2010 2011 – Second round starting in August (SEKm) Q2 2011 Q2 2010 Sales 7,544 9,308 EBIT 138 439 Margin 1.8% 4.7% 7
  • 8.
    North America isestimated to have declined by 10% in Q2 Quarterly comparison, year-over-year 15% 10% 5% 0% -5% -10% -15% -20% Q1 Q2 Q3 Q4 Q1 Q2 Q3 Q4 Q1 Q2 Q3 Q4 Q1 Q2 Q3 Q4 Q1 Q2 Q3 Q4 Q1 Q2 2006 2007 2008 2009 2010 2011 8
  • 9.
    Consumer Durables MajorAppliances Latin America EBIT (SEKm) Margin (%) 400 8  Market growth in Brazil at lower pace 5,7 – Strong growth in the rest of 300 6 Latin America  EBIT declined to SEK 114m 200 4 3,1 – Negative customer mix due to consolidation of retailers 100 2 – Increased raw-material costs – Price pressure 0 0 – Increased marketing 2010 2011 investments (SEKm) Q2 2011 Q2 2010 Sales 3,708 3,667 EBIT 114 209 Margin 3.1% 5.7% 9
  • 10.
    Consumer Durables MajorAppliances Asia/Pacific EBIT (SEKm) Margin (%) 300 14  Market growth in Australia but lower EBIT 12 10,2 – Higher raw-material costs 200 9,1 10 – Price pressure 174,0 145,0 8  Southeast Asia and China 6 – Market-share gain in strong 100 4 markets 2 0 0 2010 2011 (SEKm) Q2 2011 Q2 2010 Sales 1,945 2,035 EBIT 177 207 Margin 9.1% 10.2% 10
  • 11.
    Consumer Durables SmallAppliances EBIT (SEKm) Margin (%) 400 15  Higher sales in comparable currencies due to higher 12 volumes and improved mix 300 9  Lower EBIT 211 200 6,2 – Higher product costs 114 6 – Increased investment in small 100 domestic appliances 3 1,3 – Price pressure 0 0 – Higher costs for raw materials 2010 2011 (SEKm) Q2 2011 Q2 2010 Sales 1,794 1,966 EBIT 23 122 Margin 1.3% 6.2% 11
  • 12.
    Professional Products Food-service& Laundry products EBIT (SEKm) Margin (%)  Lower sales and lower underlying 400 18,4 20 EBIT for Food-service – Positive effect of SEK 90m related 300 15 to a divestment 12,0 – Lower project sales in Southern 200 177 10 Europe – Higher raw-material costs 100 91 5 – Price increases  Solid results for Laundry products 0 0 – Higher volumes 2010 2011 – Price increases – Negative mix impact (SEKm) Q2 2011 Q2 2010 – Negative FX impact Sales 1,491 1,730 EBIT 274 207 – Higher raw-material costs Margin 18.4% 12.0% 12
  • 13.
    Q3 and H22011 In accordance with forward-looking statements in the CEO letter Q3 2011 H2 2011 Comment Easier comparables Volumes Higher Higher in US in Q3 Slightly Increases in NA and Latam, Price Flat gradual increases in Europe in Q4 positive Mix improvement from product Slightly Mix Flat launches offset by negative negative country/customer mix SEK 800m in H2 whereof Raw-material costs Higher Higher SEK 500m in Q3 Costs from Global Approximately evenly SEK 125m SEK 250m distributed between quarters Operations Manufacturing Approximately evenly SEK 125m SEK 250m distributed between quarters footprint savings 13
  • 14.
  • 15.
    Factors affecting forward- lookingstatements Factors affecting forward-looking statements This presentation contains “forward-looking” statements within the meaning of the US Private Securities Litigation Reform Act of 1995. Such statements include, among others, the financial goals and targets of Electrolux for future periods and future business and financial plans. These statements are based on current expectations and are subject to risks and uncertainties that could cause actual results to differ materially due to a variety of factors. These factors include, but may not be limited to the following: consumer demand and market conditions in the geographical areas and industries in which Electrolux operates, effects of currency fluctuations, competitive pressures to reduce prices, significant loss of business from major retailers, the success in developing new products and marketing initiatives, developments in product liability litigation, progress in achieving operational and capital efficiency goals, the success in identifying growth opportunities and acquisition candidates and the integration of these opportunities with existing businesses, progress in achieving structural and supply-chain reorganization goals. 15