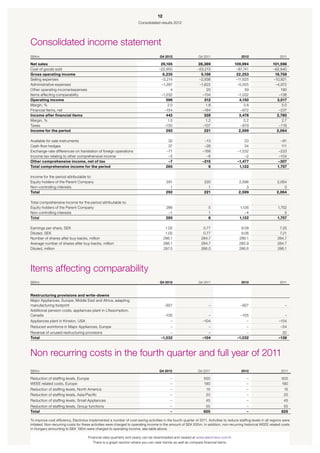
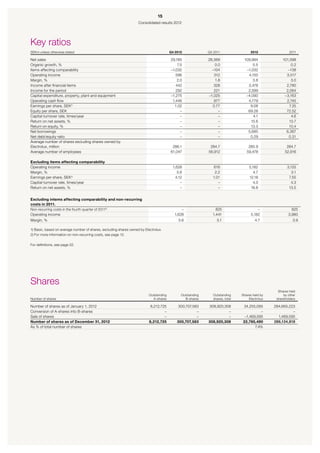
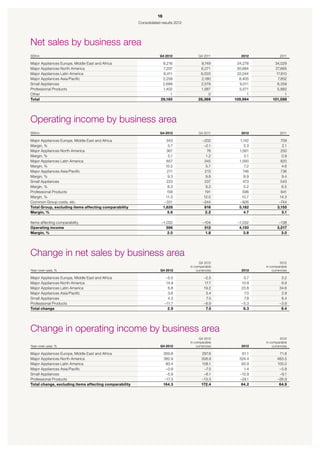
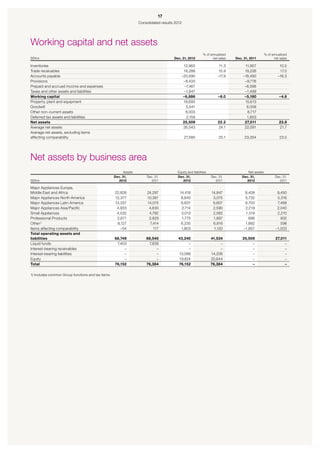
XX


Consolidated results 2012
Stockholm, February 1, 2013 			


      Highlights of the fourth quarter of 2012	                                                                                                       Read more

      •	Net sales amounted to SEK 29,185m (28,369) and income for the period was SEK 292m
        (221), or SEK 1.02 (0.77) per share.	                                                                                                                      2
      •	Net sales improved by 2.9%, of which 7.5% was organic growth and
        –4.6% changes in exchange rates. 	                                                                                                                         2
      •	Strong volume growth, price increases and mix improvements in Latin America
        and North America contributed to the positive trend in net sales. 	                                                                                   4-5
     •	Market conditions in Europe continued to weaken and Major Appliances, Small Appliances
       and Professional Products, were negatively impacted. 	                                                                                                 4-6
     •	Operations in Latin America showed record earnings. 	                                                                                                       5
     •		 orth America showed strong earnings growth despite extra costs from plant restructuring
       N
       and for entering new distribution channels.	                                                                                                                4
     •	Lower volumes and a weak price/mix development in Europe had a
       negative impact on results. 	                                                                                                                               4
     •	Measures to improve manufacturing footprint were initiated and SEK 1,032m was charged
       to operating income within items affecting comparability, as previously communicated.	                                                                      8
     •	The Board proposes a dividend for 2012 of SEK 6.50 (6.50) per share.	                                                                                       9


Financial overview
SEKm1)                                                       Q4 2012            Q4 2011          Change, %                 2012                2011          Change, %

Net sales                                                     29,185            28,369                    3            109,994             101,598                      8
Operating income                                               1,628               616                  164              5,182               3,155                     64
Margin, %                                                         5.6               2.2                                     4.7                 3.1
Income after financial items                                   1,474               432                  241              4,510               2,918                     55
Income for the period                                          1,179               286                  312              3,486               2,148                     62
Earnings per share, SEK 2)                                       4.12             1.01                                   12.18                7.55
Operating cash flow3)                                          1,446               977                   48              4,779               2,745                     74
1)	Key ratios are excluding items affecting comparability. Items affecting comparability amounted to SEK –1,032m (–104) for the fourth quarter of 2012 and SEK –1,032m
    (–138) for the full year of 2012. Items affecting comparability includes costs for restructuring programs to make the Group’s production competitive in the long term,
    see pages 8 and 12.
2)	 asic, based on an average of 286.1 (284.7) million shares for the fourth quarter and 285.9 (284.7) million shares for the full year of 2012, excluding shares held by
    B
    Electrolux.
3)	 Excluding financial items paid, taxes paid and acquisitions and divestments of operations.

Nullupid qui voluptiumdilution,di as si 12.
For earnings per share after sum see page
For definitions, see page 22.


         For further information, please contact Peter Nyquist, Senior Vice President, Head of Investor Relations and Financial Information, at +46 8 738 60 03.


About Electrolux
Electrolux is a global leader in household appliances and appliances for professional use, selling more than 40 million products to customers in more than 150 markets
every year. The company focuses on innovative solutions that are thoughtfully designed, based on extensive consumer insight, to meet the real needs of consumers and
professionals. Electrolux products include refrigerators, dishwashers, washing machines, cookers, air-conditioners and small appliances such as vacuum cleaners sold
under esteemed brands like Electrolux, AEG, Eureka and Frigidaire.
For more information, go to www.electrolux.com/press and www.electrolux.com/news.
2
                                                                    Consolidated results 2012


Market overview
Market demand for appliances in some of Electrolux core markets                      Market demand in Eastern Europe increased by 2% and demand in
continued to decline in the fourth quarter of 2012 year-over-year,                   Latin America and Southeast Asia continued to show strong growth.
while demand in emerging markets continued to grow.                                     Market demand for core appliances in Europe in 2013 is expected
  Market demand for core appliances in Western Europe and North                      to decline while demand in North America is expected to increase.
America declined by 2%. Market demand in Australia is estimated to
have declined.


Industry shipments of core appliances in Europe*                                     Industry shipments of core appliances in the US*
%                                                                                      %
30                                                                                     5
                                                            Western Europe
                                                            Eastern Europe
20
                                                                                        0
                                                                                            Q1     Q2      Q3     Q4   Q1     Q2    Q3    Q4
10

                                                                                       –5
  0
       Q1     Q2     Q3     Q4   Q1   Q2   Q3    Q4
–10                                                                                  –10
                                                                                                      2011                     2012
–20
                2011                   2012

* ­­Units, year-over-year, %.                                                       * ­­Units, year-over-year, %.

Sources: North America: AHAM. Europe: GfK. For other markets there are no comprehensive market statistics.


The fourth quarter in summary*
SEKm                                                                             Q4 2012            Q4 2011       Change, %           2012        2011   Change, %

Net sales                                                                            29,185         28,369              2.9        109,994     101,598         8.3
Change in net sales, %, whereof
Acquisitions                                                                                                              –                                    3.9
Organic growth                                                                                                          7.5                                    5.5
Changes in exchange rates                                                                                              –4.6                                   –1.1
Operating income
Major Appliances Europe, Middle East and Africa                                         343             –202           270           1,142        709          61
Major Appliances North America                                                          367                76          383           1,561        250         524
Major Appliances Latin America                                                          657              345            90           1,590        820          94
Major Appliances Asia/Pacific                                                           211              213            –1             746        736           1
Small Appliances                                                                        223              237            –6             473        543         –13
Professional Products                                                                   158              191           –17             596        841         –29
Other, common Group costs, etc.                                                        –331             –244           –36            –926       –744         –24
Operating income, excluding items affecting comparability                             1,628              616           164           5,182      3,155          64
Margin, %                                                                                5.6              2.2                           4.7        3.1
Items affecting comparability                                                        –1,032             –104                        –1,032       –138
Operating income                                                                        596              512            16           4,150      3,017          38
Margin, %                                                                                2.0              1.8                           3.8        3.0
*	 All comments on operating income are excluding items affecting comparability. For items affecting comparability, see page 12. The fourth quarter of 2011 included
   non-recurring costs in the amount of SEK 825m. The major part of these costs, SEK 690m, was related to Major Appliances Europe, Middle East and Africa, see page
   12.


      •	 Organic growth, especially in Latin America and North                   Net sales for the Electrolux Group in the fourth quarter of 2012
         America, contributed to the favorable trend in net sales.               improved by 2.9%. Organic growth was 7.5%. Sales growth was
      •	 Strong performance for the operations in North America                  particularly strong in Latin America and North America. Changes in
                                                                                 exchange rates had a negative impact of –4.6%.
         and Latin America.
                                                                                    Operating income improved to SEK 1,628m (616), corresponding
      •	 Market conditions in Europe deteriorated and adversely                  to a margin of 5.6% (2.2). Operating income for the fourth quarter of
         impacted results for appliances, professional products and              2011 included non-recurring costs in the amount of SEK 825m.
         small domestic appliances in the region.                                Excluding these non-recurring costs, operating income for the
                                                                                 fourth quarter of 2011 was SEK 1,441m and the corresponding mar-
                                                                                 gin 5.1%.
3
                                                            Consolidated results 2012


The performances of the operations in Latin America and North               Income after financial items amounted to SEK 3,478m (2,780).
America were particularly strong in the quarter. Good volume                   Income for the period was SEK 2,599m (2,064), corresponding to
growth, price increases and mix improvements contributed to the             SEK 9.08 (7.25) in earnings per share, see page 12.
positive trend. Market demand in Europe weakened further in the
quarter, which affected sales and operating income for the opera-
tions within appliances, professional products and small appliances.
                                                                               Events during the fourth quarter of 2012
   Price/mix pressure and weak volumes in Europe negatively
impacted operating income. Previous cost-saving activities and
                                                                               November 20. Electrolux issues bond loan
ongoing global initiatives to reduce costs continued to contribute to
                                                                               Electrolux has issued a SEK 500m bond loan under its EMTN (Euro
the results.
                                                                               Medium Term Note) program.

Effects of changes in exchange rates                                           November 14. Electrolux hosts Capital Markets Day
Changes in exchange rates had a negative impact year-over-year on              In addition to presenting the pillars of the Electrolux strategy, man-
operating income of SEK –40m. The impact of transaction effects                agement gave a brief overview of the current business environment
was SEK –90m, results from hedging operations SEK 70m and                      and how it could drive the Group’s performance in 2013. Cost sav-
                                                                               ings in 2013 are expected to be greater than SEK 1 billion, compared
translation effects SEK –20m. The impact from transaction and                  to 2012. The raw-material headwinds experienced in previous years
hedging operations was mainly attributable to the operations in                are expected to turn into tailwinds. Although the demand situation in
Latin America and the strengthening of the US dollar against the               Europe remains uncertain, Electrolux as a Group expects another
Brazilian real.                                                                year of positive organic sales growth. The majority of the growth is
                                                                               expected to derive from emerging markets and a positive price/mix
                                                                               development, supported by product launches. In 2013, Electrolux
Financial net                                                                  will continue to step up its investments in product development,
Net financial items for the fourth quarter of 2012 improved to                 design and marketing to support future product launches.
SEK –154m (–184).

Income for the period                                                          Events during the first quarter of 2013
Income for the period amounted to SEK 292m (221), corresponding
to SEK 1.02 (0.77) in earnings per share, see page 12.                         February 1. Electrolux acquires its head office in
                                                                               Stockholm
Full year of 2012                                                              Electrolux acquires its head office building with associated grounds
Net sales for the Electrolux Group in the full year of 2012 amounted           at S:t Göransgatan in Stockholm, Sweden. The purchase price is
to SEK 109,994m (101,598). Net sales improved by 8.3%, of which                SEK 1,145m and possession will take place today February 1, 2013.
                                                                               Electrolux aim is to find an alternative ownership structure for the real
5.5% referred to organic growth, 3.9% to acquisitions and –1.1% to
                                                                               estate as soon as possible. For more information, see page 10.
changes in exchange rates.
   Operating income, improved to SEK 5,182m (3,155), correspond-
ing to a margin of 4.7% (3.1). Excluding the non-recurring costs,
operating income for 2011 was SEK 3,980m and the operating mar-
gin 3.9%. The negative trend on the core markets in Europe has
adversely impacted results for the Group’s operations in the region
in 2012. However, strong volume growth particularly in North Amer-
ica and Latin America, price increases and extensive product
launches contributed to the improvement in operating income for
2012. Costs savings and the ongoing global initiatives to reduce
complexity and improve competitiveness within manufacturing also
contributed to the income trend.


Share of sales by business area in the full year 2012                       Operating income and margin*

                          Consumer Durables, 95%                            SEKm                                                      %
                                                                             2,000                                                    10
                               Europe, Middle East and Africa, 31%
                               North America, 28%                                                                                               EBIT
                                                                             1,600                                                    8
                               Latin America, 20%                                                                                               EBIT margin
                               Asia/Pacific, 8%                              1,200                                                    6       *	Excluding items
                               Small Appliances, 8%                                                                                              affecting compa-
                                                                                                                                                 rability.
                                                                              800                                                     4
                               Professional Products, 5%

                                                                              400                                                     2


                                                                                 0 Q1                                                 0
                                                                                           Q2 Q3        Q4    Q1     Q2 Q3      Q4
                                                                                            2011                      2012
4
                                                                    Consolidated results 2012


Business areas
Major Appliances Europe, Middle East and Africa

SEKm                                                                                               Q4 2012           Q4 2011*                   2012             2011*

Net sales                                                                                              9,216              9,749            34,278           34,029
Operating income                                                                                         343              –202              1,142              709
Operating margin, %                                                                                       3.7              –2.1               3.3               2.1

Industry shipments of core appliances in Europe,
units, year-over-year, %
Western Europe                                                                                            –2                  –3                 –2                –3
Eastern Europe (excluding Turkey)                                                                          2                   9                  3                 9
Total Europe                                                                                              –1                   1                 –1                 0
*	 Operating income for the fourth quarter of 2011 included non-recurring costs in the amount of SEK 690m, see page 12.


Market demand for appliances in Europe decreased year-over-year                      SEKm                                                        %
in the fourth quarter of 2012. Western Europe declined by 2% as a                    800                                                         8        EBIT
result of weak demand in Southern Europe, France, the Nordic and                                                                                          EBIT
the Benelux countries. Demand in Eastern Europe rose by 2%,                          600                                                         6        margin
driven mainly by growth in Russia, while demand declined in the rest
                                                                                     400                                                         4
of Eastern Europe.
   The market conditions in Europe deteriorated throughout the                       200                                                         2
quarter. Sales volumes and prices were negatively impacted and
sales and operating income declined, compared to 2011 excluding                        0                                                         0
                                                                                            Q1    Q2     Q3     Q4   Q1       Q2     Q3    Q4
non-recurring costs.
                                                                                     –200                                                        –2
   Group sales increased for the full year of 2012 year-over-year in                               2011                        2012
comparable currencies as a result of higher sales volumes. The                       –400                                                        –4
launch of the next generation of high-end appliances under the
Electrolux brand, The Inspiration Range, across the markets in
Europe, has contributed to the sales development.                                    results in Egypt. However, increased manufacturing efficiency and
   Full-year operating income for the Group’s European business,                     costs savings made a positive contribution to the operating income.
declined, excluding the non-recurring costs for 2011, as a result of
lower sales prices, a deterioration in country mix and negative


Major Appliances North America
SEKm                                                                                               Q4 2012           Q4 2011*                   2012             2011*

Net sales                                                                                              7,207              6,271            30,684           27,665
Operating income                                                                                         367                 76             1,561              250
Operating margin, %                                                                                       5.1               1.2                5.1              0.9

Industry shipments of appliances in the US,
units, year-over-year, %
Core appliances                                                                                           –2                  –4                 –2                –4
Microwave ovens and home comfort products                                                                  1                  –1                  1                 7
Total Major Appliances                                                                                     0                  –3                  0                –1
*	 Operating income for the fourth quarter of 2011 included non-recurring costs in the amount of SEK 15m, see page 12.


                                                                                      SEKm                                                           %
Market demand in North America for core appliances declined by
                                                                                      800                                                            8     EBIT
2% during the fourth quarter of 2012 compared with the year-earlier
period. Market demand for microwave ovens and home comfort                            600                                                            6     EBIT
                                                                                                                                                           margin
products, such as room air-conditioners increased by 1%. In total,
demand for major appliances was unchanged in the quarter.                             400                                                            4
   Group sales in North America increased year-over-year in the
                                                                                      200                                                            2
fourth quarter due to significantly higher volumes of core appliances
and improvements in price and mix. Sales volumes rose in several of                     0                                                            0
                                                                                             Q1   Q2      Q3    Q4       Q1    Q2     Q3    Q4
the product categories in core appliances and the Group continued
to capture market share.                                                             –200                                                            –2
                                                                                                       2011                        2012
   Operating income for the fourth quarter and the full year improved
substantially year-over-year due to higher volumes and improve-
ments in price/mix. Increased marketing spend for launches of new                    entering new distribution channels. In addition, production costs
products, primarily related to the Frigidaire brand, impacted operat-                increased due to the consolidation of cooking production, with
ing income in the fourth quarter.                                                    manufacturing being relocated from L’Assomption in Quebec, Can-
   During the quarter, operations in North America were impacted                     ada, to Memphis in Tennessee, USA. These activities will to con-
by extra costs totaling approximately SEK  100m. Costs for ware-                     tinue impact operating income in 2013, although to a lesser degree.
housing and transportation were temporarily higher as a result of
5
                                                                    Consolidated results 2012


Major Appliances Latin America
SEKm                                                                                               Q4 2012               Q4 2011               2012             2011

Net sales                                                                                             6,411               6,003           22,044           17,810
Operating income                                                                                       657                  345            1,590              820
Operating margin, %                                                                                    10.2                  5.7              7.2              4.6


Market demand for core appliances in Latin America is estimated to                   SEKm                                                           %
have continued to increase in the fourth quarter of 2012 year-over-                  700                                                         15      EBIT
year. Demand for core appliances in Brazil continued to grow mainly
                                                                                                                                                 12      EBIT
as a result of tax incentives for appliances, a program that has been                560                                                                 margin
partially extended to June 2013.
                                                                                     420                                                         9
   Sales for the Latin American operations rose year-over-year in the
quarter and the full year 2012 as a result of continued volume growth                280                                                         6
and an improved mix. Sales in other Latin American markets outside
Brazil increased to about 32% (25) of total sales in 2012, primarily as              140                                                         3
a result of the acquisition of CTI in Chile.
                                                                                       0                                                         0
   Operating income improved significantly for the quarter and for                          Q1   Q2     Q3    Q4     Q1      Q2      Q3   Q4
the full year and was the highest ever recorded. Strong volume                                     2011                        2012
growth, higher prices and an improved product and customer mix
contributed to the strong results. Currency movements continued to
negatively impact the results. The successful integration of the
acquired company CTI in Chile also contributed to the strong results
for 2012.


Major Appliances Asia/Pacific
SEKm                                                                                               Q4 2012           Q4 2011*                  2012            2011*

Net sales                                                                                             2,259               2,180            8,405               7,852
Operating income                                                                                        211                 213              746                 736
Operating margin, %                                                                                     9.3                  9.8              8.9                 9.4
*	 Operating income for the fourth quarter of 2011 included non-recurring costs in the amount of SEK 20m, see page 12.


Australia and New Zealand                                                            SEKm                                                       %
Market demand for major appliances in Australia is estimated to have                 300                                                        15      EBIT
declined in the fourth quarter of 2012 year-over-year. Group sales
decreased during the fourth quarter and the full year, primarily as a                240                                                        12      EBIT
                                                                                                                                                        margin
result of lower sales volumes and prices and a negative customer mix.
                                                                                     180                                                        9
   Operating income declined for the fourth quarter and full-year
2012, mainly due to declining volumes as a result of a weak market.                  120                                                        6
Lower sales prices also had a negative impact on operating income.
Cost savings and favorable currency movements contributed posi-                       60                                                        3
tively to operating income.
                                                                                       0                                                        0
                                                                                            Q1   Q2    Q3     Q4    Q1      Q2     Q3     Q4
Southeast Asia and China                                                                           2011                       2012
Market demand in Southeast Asia is estimated to have continued
showing growth in the fourth quarter of 2012 year-over-year.
Demand in China continued to decline, while Electrolux sales in
Southeast Asia and China continued to display strong growth and
the Group’s market shares are estimated to have grown.
  Operations in Southeast Asia demonstrate favorable profitability
and the Group’s operation in China made a positive contribution to
operating income.
6
                                                                    Consolidated results 2012


Small Appliances

SEKm                                                                                                  Q4 2012         Q4 2011*               2012            2011*

Net sales                                                                                              2,689              2,579              9,011          8,359
Operating income                                                                                         223                237                473            543
Operating margin, %                                                                                       8.3               9.2                5.2             6.5
*	 Operating income for the fourth quarter of 2011 included non-recurring costs in the amount of SEK 45m, see page 12.


Market demand for vacuum cleaners in Europe and North America                        SEKm                                                     %
declined in the fourth quarter compared with the year-earlier period.                300                                                      15     EBIT
   Group sales increased year-over-year in the fourth quarter, mainly
                                                                                     240                                                      12     EBIT
as a result of strong sales growth for small domestic appliances,                                                                                    margin
particularly in Asia/Pacific. Higher sales of vacuum cleaners, mainly                180                                                      9
driven by promotion activities in North America around Black Friday,
also contributed to the rise in sales and the Group captured market                  120                                                      6
shares.
                                                                                      60                                                      3
   Operating income for the fourth quarter and the full year 2012
declined year-over-year. The weak market in Europe and the US had                      0                                                      0
a negative impact on prices and product mix and operating income                            Q1   Q2      Q3     Q4   Q1     Q2     Q3 Q4
declined. In addition, increased costs for sourced products                                       2011                        2012
adversely impacted income in 2012. The acquired company Somela
(CTI) in Chile had a positive impact on results.


Professional Products

SEKm                                                                                                  Q4 2012            Q4 2011              2012            2011

Net sales                                                                                              1,402              1,587              5,571          5,882
Operating income                                                                                         158                191                596            841
Operating margin, %                                                                                      11.3              12.0               10.7           14.3


Weak market demand in Europe for both professional food-service                      SEKm                                                     %
equipment and laundry equipment had a negative impact on the                         350                                                      21     EBIT
Group’s sales volumes in the fourth quarter.                                         300                                                      18     EBIT
   Sales of food-service equipment declined year-over-year due to                                                                                    margin
                                                                                     250                                                      15
lower volumes. Operating income declined for the fourth quarter
                                                                                     200                                                      12
and for the full year 2012 as a result of lower sales volumes and a
negative mix. However, price increases and productivity improve-                     150                                                      9
ments partly offset the decline in operating income and margins                      100                                                      6
were stable.                                                                          50                                                      3
   Continued investments related to the launch of the new ultra-lux-                   0                                                      0
ury product range Electrolux Grand Cuisine negatively impacted                             Q1    Q2     Q3      Q4   Q1     Q2     Q3   Q4
operating income for the fourth quarter.                                                          2011                        2012
   Sales of professional laundry equipment declined in the fourth
quarter and the full year as a result of lower volumes. Operating
income declined but margins remained solid despite lower volumes.
Price increases and a positive development of the product mix con-
tributed to operating income.
7
                                                              Consolidated results 2012


Cash flow
SEKm                                                                                           Q4 2012             Q4 2011                2012          2011

Operations                                                                                        2,327              1,937               7,665        6,122
Change in operating assets and liabilities                                                          470                463               1,727         1,116
Capital expenditure                                                                              –1,351             –1,423              –4,613       –4,493
Operating cash flow                                                                               1,446                977               4,779        2,745
Acquisitions and divestments of operations                                                            –             –3,213                –164       –5,556
Financial items paid, net                                                                          –223               –244                –673         –214
Taxes paid                                                                                         –465              –446               –1,564       –1,625
Cash flow from operations and
investments                                                                                         758            –2,926                2,378       –4,650
Dividend                                                                                              –                 –               –1,868       –1,850
Sale of shares                                                                                        –                 –                  212            –

Total cash flow, excluding change in loans and short-term investments                               758            –2,926                 722        –6,500


Cash flow from operations and investments in the fourth quarter of              Cash flow from operations and investments
2012 amounted to SEK 758m (–2,926).                                             SEKm
   The trend for the cash flow and working capital in the fourth quar-
                                                                                 4,000
ter of 2012 reflects a normal seasonal pattern with increased sales
and declining inventories. The Group’s ongoing structural efforts to             3,000
reduce tied-up capital has contributed to the strong cash flow in the            2,000
quarter.
                                                                                 1,000
   The operating cash flow for the full year far exceeded the level in
the preceding year.                                                                  0
                                                                                         Q1    Q2     Q3     Q4     Q1     Q2      Q3   Q4
   Payments for the ongoing restructuring and cost-cutting pro-
                                                                                –1,000
grams amounted to approximately SEK –80m in the quarter.
   Investments in the fourth quarter mainly related to investments within       –2,000
manufacturing facilities for new products and production capacity.              –3,000
Major projects include the cooker plant in Memphis, Tennessee, in the                             2011                        2012
US and the new plant for refrigerators and freezers in Rayong, Thailand,
for the Southeast Asian markets. The cooker plant in Memphis is
receiving investment support from state authorities.


Financial position
Net borrowings
                                                                                                                                   Dec. 31,          Dec. 31,
SEKm                                                                                                                                 2012              2011

Borrowings                                                                                                                           13,088          14,206
Liquid funds                                                                                                                          7,403           7,839
Net borrowings                                                                                                                        5,685           6,367
Net debt/equity ratio                                                                                                                  0.29            0.31
Equity                                                                                                                               19,824          20,644
Equity per share, SEK                                                                                                                 69.28           72.52
Return on equity, %                                                                                                                    13.3             10.4
Equity/assets ratio, %                                                                                                                 28.8             30.1


Net borrowings declined to SEK 5,685m (6,367). Net borrowings                   Cash flow and change in net borrowings
have been positively impacted by the strong cash flow from opera-
                                                                                 Net borrowings December 31, 2011
tions and working capital. During 2012, SEK 3,063m in long-term
                                                                                                          Operations
borrowings were amortized and new long-term borrowings were
                                                                                     Operating assets and liabilities
raised by SEK 2,569m, whereof SEK 2,744m were amortized and
                                                                                                      Investments
SEK 1,512m were raised in the fourth quarter.
                                                                                          Acquisitions/divestments
    Long-term borrowings as of December 31, 2012, including long-
                                                                                               Financial net and tax
term borrowings with maturities within 12 months, amounted to
                                                                                                            Dividend
SEK  11,005m with average maturity of 3.1 years, compared to
                                                                                                      Sale of shares
SEK  11,669m and 3.0 years at the end of 2011. During 2013 and
                                                                                                               Other
2014, long-term borrowings in the amount of approximately
                                                                                Net borrowings December 31, 2012
SEK 2,100m will mature.
                                                                                                                                              0                 SEKm
                                                                                                                                 00


                                                                                                                                                         0

                                                                                                                                                         0
                                                                                                                      00


                                                                                                                                 00
                                                                                                                                00


                                                                                                                                                       00
                                                                                                                                                         0


                                                                                                                                                  10 0
                                                                                                                                                      00

                                                                                                                                                      00
                                                                                                                                                      00


                                                                                                                                                      00
                                                                                                                              ,0
                                                                                                                    ,0


                                                                                                                              ,0
                                                                                                                              ,0


                                                                                                                                                    ,0
                                                                                                                                                   4,

                                                                                                                                                   6,
                                                                                                                                              2,


                                                                                                                                                   8,
                                                                                                                         –6
                                                                                                                  –8


                                                                                                                              –4
                                                                                                                           –2
8
                                                          Consolidated results 2012


Liquid funds as of December 31, 2012, amounted to SEK 7,403m               sitions in the second half of 2011 of Olympic Group in Egypt, and CTI
(7,839), excluding short-term back-up facilities. Electrolux has two       in Chile. Adjusted for items affecting comparability, i.e., restructuring
unused committed back-up facilities. One EUR        500m multi-cur-        provisions, average net assets amounted to SEK 27,585m (23,354),
rency revolving credit facility, approximately SEK 4,200m, maturing        corresponding to 25.1% (23.0) of net sales.
2016 with extension options for up to two more years and a credit             Working capital as of December 31, 2012, amounted to
facility of SEK 3,400m maturing 2017.                                      SEK –6,886m (–5,180), corresponding to –6.0% (–4.6) of annualized
                                                                           net sales. The return on net assets was 15.6% (13.7), and 18.8%
Net assets and working capital­                                            (13.5), excluding items affecting comparability.
Average net assets for the period amounted to SEK 26,543m
(22,091). Net assets as of December 31, 2012, amounted to
SEK 25,509m (27,011). Net assets have been impacted by the acqui-


Structural changes

Adapting manufacturing footprint in Europe
Electrolux is continuing the work to increase production competi-
tiveness by optimizing its industrial production system, as commu-
nicated at the Capital Markets Day in November 2011.
   Several activities have been initiated within the business area
Major Appliances Europe, Middle East and Africa. Total costs are
estimated to approximately SEK 927m, which have been charged
against operating income within items affecting comparability in the
fourth quarter of 2012.
   Additional costs of SEK 105m for pensions related to the closure
of the cooking facility in L´Assomption, Canada, have been charged
to operating income within items affecting comparability in the
fourth quarter of 2012. The decision to discontinue production in
L´Assomption was made in the fourth quarter of 2010 and costs
were charged as items affecting comparability.


   Relocation of production, items affecting comparability, restructuring measures 2007–2013

   Plant closures and cutbacks                               Closed        Authorized closures                                               Estimated closure
   Torsvik           Sweden      Compact appliances       Q1 2007          L’Assomption                 Canada            Cookers                    Q4 2013
   Nuremberg         Germany     Dishwashers, washing     Q1 2007
                                 machines and dryers                       Investment                                                                      Start
   Adelaide          Australia   Dishwashers              Q2 2007                                                         Washing
   Fredericia        Denmark     Cookers                  Q4 2007          Porcia                       Italy             machines                      Q4 2010
   Adelaide          Australia   Washing machines         Q1 2008          Memphis                      USA               Cookers                       Q2 2012
   Spennymoor        UK          Cookers                  Q4 2008
   Changsha          China       Refrigerators            Q1 2009          In 2004, Electrolux initiated a restructuring program to make the Group’s production
   Scandicci         Italy       Refrigerators            Q2 2009          competitive in the long term. This program is in its final phase and has so far yielded
                                                                           annual savings of about SEK 3.2 billion. In 2011, additional measures were pre-
   St. Petersburg    Russia      Washing machines         Q2 2010          sented to further adapt capacity in mature markets to lower demand, and savings
   Motala            Sweden      Cookers                  Q1 2011          are estimated to approximately SEK 1.6 billion as of 2016. Total costs for the whole
                                                                           program are approximately SEK 12 billion of which approximately, SEK 9 billion has
   Webster City      USA         Washing machines         Q1 2011
                                                                           been charged to operating income. About 35% of manufacturing in high-cost areas
   Alcalà            Spain       Washing machines         Q1 2011          have been moved, and more than 60% of the Group’s household appliances are
                                                                           currently manufactured in low-cost areas that are near rapidly-growing markets for
                                                                           household appliances. Restructuring provisions and write-downs are reported as
                                                                           items affecting comparability within operating income.
9
                                                            Consolidated results 2012


Annual General Meeting 2013
The Annual General Meeting of AB Electrolux will be held on Tues-
day, March 26, 2013, at Stockholm Waterfront Congress Centre,                 Nomination Committee
Nils Ericsons Plan 4, Stockholm, Sweden.                                      In accordance with decision by the Annual General Meeting,
                                                                              Electrolux Nomination Committee shall consist of six members. The
Proposed dividend                                                             members should be one representative of each of the four largest
The Board of Directors proposes a dividend for 2012 of SEK 6.50               shareholders in terms of voting rights that wish to participate in the
(6.50) per share, for a total dividend payment of approximately               committee, together with the Chairman of the Electrolux Board and
SEK  1,860m (1,860). The proposed dividend corresponds to                     one additional Board member.
approximately 55% (85) of income for the period, excluding items                 The members of the Nomination Committee have been appointed
affecting comparability. Tuesday, April 2, 2013, is proposed as               based on the ownership structure as of August 31, 2012. Petra
record date for the dividend.                                                 Hedengran, Investor AB, is the Chairman of the committee. The
   The Group’s goal is for the dividend to correspond to at least 30%         other owner representatives are Kaj Thorén, Alecta, Marianne
of income for the period, excluding items affecting comparability.            Nilsson, Swedbank Robur funds, and Johan Sidenmark, AMF. The
Historically, Electrolux dividend rate has been considerably higher           committee also includes Marcus Wallenberg and Torben Ballegaard
than 30%. Electrolux has a long tradition of high total distribution to       Sørensen, Board Chairman and Board member, respectively, of
shareholders that includes repurchases and redemptions of shares              Electrolux.
as well as dividends.                                                            The Nomination Committee will prepare proposals for the Annual
                                                                              General Meeting in 2013 regarding Chairman of the Annual General
Proposal for resolution on acquisition of own shares                          Meeting, Board members, Chairman of the Board, remuneration for
Electrolux has previously, on the basis of authorizations by the              Board members and, to the extent deemed necessary, proposal
Annual General Meetings, acquired own shares. The purpose of the              regarding amendments of the current instruction for the Nomination
repurchase programs has been to adapt the Group’s capital struc-              Committee.
ture, thus contributing to increased shareholder value and to use                Shareholders who wish to submit proposals to the Nomination
these shares to finance potential company acquisitions and as a               Committee should send an email to nominationcommittee@electro-
hedge for the company’s share-related incentive programs.                     lux.com.
   The Board of Directors makes the assessment that it continues to
be advantageous for the company to be able to adapt the compa-
ny’s capital structure, thereby contributing to increased shareholder
value, and to continue to be able to use repurchased shares on
account of potential company acquisitions and the company’s
share-related incentive programs.
   The Board of Directors proposes the Annual General Meeting
2013 to authorize the Board of Directors, for the period until the next
Annual General Meeting, to resolve on acquisitions of shares in the
company and that the company may acquire as a maximum so
many B shares that, following each acquisition, the company holds
at a maximum 10% of all shares issued by the company.
   As of January 31, 2013, Electrolux holds 22,785,490 B shares in
Electrolux, corresponding to 7.4% of the total number of shares in
the company.
10
                                                                Consolidated results 2012


Other items
Electrolux acquires its head office in Stockholm                                   and Electrolux cannot provide any assurances that the resolution of
Electrolux acquires its head office building with associated grounds               these types of lawsuits will not have a material adverse effect on its
at S:t Göransgatan in Stockholm, Sweden. The purchase price is                     business or on results of operations in the future.
SEK 1,145m and possession will take place today February 1,
2013.                                                                              Conversion of shares
   The purpose of the acquisition is to secure access to office space              According to AB Electrolux articles of association, owners of Class
in central Stockholm. Electrolux has made extensive investments in                 A shares have the right to have such shares converted to Class B
the building for, e.g., the Group’s design and product development                 shares. Conversion of shares reduces the total number of votes in
operations.                                                                        the company. In 2012, no shareholder requested conversion
   The transaction has been initiated by the seller NIAM. Electrolux               of shares.
aim is to find an alternative ownership structure for the real estate as              The total number of registered shares in the company amounts to
soon as possible.                                                                  308,920,308 shares, of which 8,212,725 are Class A shares and
                                                                                   300,707,583 are Class B shares, see table on page 15. The total
Asbestos litigation in the US                                                      number of votes amounts to 38 283 483.
Litigation and claims related to asbestos are pending against the                     On December 31, 2012, Electrolux owned 22,785,490, shares of
Group in the US. Almost all of the cases refer to externally supplied              Class B, corresponding to 7.4% of all outstanding shares.
components used in industrial products manufactured by discon-
tinued operations prior to the early 1970s. The cases involve plain-
tiffs who have made substantially identical allegations against other
defendants who are not part of the Electrolux Group.
    As of December 31, 2012, the Group had a total of 2,864 (2,714)
cases pending, representing approximately 2,936 (approximately
2,843) plaintiffs. During the fourth quarter of 2012, 273 new cases
with 273 plaintiffs were filed and 324 pending cases with approxi-
mately 324 plaintiffs were resolved.
    It is expected that additional lawsuits will be filed against
Electrolux. It is not possible to predict the number of future lawsuits.
In addition, the outcome of asbestos lawsuits is difficult to predict


Risks and uncertainty factors
As an international group with a wide geographic spread, Electrolux                management, see the 2011 Annual Report on page 70. No signifi-
is exposed to a number of business and financial risks. The busi-                  cant risks other than the risks described there are judged to have
ness risks can be divided into strategic, operational and legal risks.             occurred.
The financial risks are related to such factors as exchange rates,                   Risks, risk management and risk exposure are described in more
interest rates, liquidity, the giving of credit and financial instruments.         detail in the Annual Report 2011,
   Risk management in Electrolux aims to identify, control and                     www.electrolux.com/annualreport2011.
reduce risks. This work begins with the description of risks and risk


   Press releases 2012

   January 10	     Electrolux appoints Stefano Marzano to the new role of 	        July 19	       Interim report January-June and CEO
   	               Chief Design Officer                                            	              Keith McLoughlin’s comments
   February 2	     Consolidated results 2011 and CEO                               September 13	 Dow Jones Sustainability World Index names Electrolux 	
   	               Keith McLoughlin’s comments                                     	             Durable Household Products sector leader
   February 15	    Ronnie Leten and Fredrik Persson proposed new Board 	           September 17	 Electrolux launches the first and only professional
   	               members of Electrolux                                           	             cooking system for consumer homes
   February 17	    Notice convening the Annual General Meeting of                  September 26	 Nomination committee appointed for Electrolux Annual 	
   	               AB Electrolux                                                   	             General Meeting 2013
   March 2	        Electrolux Annual Report 2011 is published                      October 22	    Interim report January-September and CEO
   March 22	       Electrolux issues bond loan                                     	              Keith McLoughlin’s comments

   March 27	 Bulletin from AB Electrolux Annual General Meeting 		                 October 26	    Floating air cleaning appliance wins Electrolux Design 	
   	2012                                                                           	              Lab 2012

   April 25	       Interim report January-March and CEO                            November 14	 Electrolux hosts Capital Markets Day 2012
   	               Keith McLoughlin’s comments                                     November 20	 Electrolux issues bond loan
   July 3	         Electrolux products to be sold at The Home Depot
11
                                                                       Consolidated results 2012


Parent Company AB Electrolux                                                                Accounting and valuation principles
The Parent Company comprises the functions of the Group’s head
                                                                                            Electrolux applies International Financial Reporting Standards (IFRS)
office, as well as five companies operating on a commission basis
                                                                                            as adopted by the European Union. This report has been prepared
for AB Electrolux.                                                                          in accordance with IAS 34, Interim Financial Reporting, and ÅRL, the
   Net sales for the Parent Company, AB Electrolux, for the full year                       Swedish Annual Accounts Act and recommendation RFR 2,
of 2012 amounted to SEK 6,125m (6,660), of which SEK 2,959m                                 Accounting for legal entities, issued by the Swedish Financial
                                                                                            Reporting Board. There are no changes in the Group’s accounting
(3,266) referred to sales to Group companies and SEK 3,166m
                                                                                            and valuation principles compared with the accounting and valuation
(3,394) to external customers. Income after financial items was                             principles described in Note 1 of the Annual Report 2011.
SEK  1,112m (2,904), including dividends from subsidiaries in the
amount of SEK 1,259m (2,150). Income for the period amounted to                             This report has not been audited.
SEK 1,119m (2,745). The Parent Company reports group contribu-
tion in the income statement. Corresponding changes have been
made in the 2011 financial statements.
   Capital expenditure in tangible and intangible assets was
SEK 320m (483). Liquid funds at the end of the period amounted to
SEK 1,986m, as against SEK 2,206m at the start of the year.
   Undistributed earnings in the Parent Company at the end of the
period amounted to SEK 15,269m, as against SEK 15,938m at the
start of the year. Dividend payment to shareholders for 2011
amounted to SEK 1,860m.
    The income statement and balance sheet for the Parent Com-
pany are presented on page 20.


                       Stockholm, February 1, 2013

                              Keith McLoughlin
                             President and CEO


   New pension accounting standards as of 2013
   Employee Benefits (Amendments). IAS 19 prescribes the accounting and disclosure by employers for employee benefits. The amended standard requires an
   entity to regularly determine the present value of defined benefit obligations and the fair value of plan assets and to recognize the net of those values in the finan-
   cial statements as a net defined benefit liability. The amended standard removes the option to use the corridor approach (see Note 1 in the Annual Report 2011
   for a description) presently used by Electrolux.
      The standard also requires an entity to apply the discount rate on the net defined benefit liability (asset) in order to calculate the net interest expense
   (income). The standard thereby removes the use of an expected return on the plan assets. All changes in the net defined benefit liability (asset) will be
   recognized as they occur, as follows: (i) service cost and net interest in profit or loss; and (ii) remeasurement in other comprehensive income.
      The standard will have the following preliminary impact on the presentation of Electrolux financial results and position: All historical actuarial gains or
   losses will be included in the measurement of the net defined benefit liability. This will initially increase the liabilities of Electrolux and reduce the equity
   (after deduction for deferred tax). Future changes in the net defined benefit liability from changes in, e.g., discount rate will be presented in other com-
   prehensive income. Electrolux will classify the defined benefit liability as a financial liability and present the net interest on the net liability in the financial
   net. The removal of the expected return will worsen the net interest with the difference between the expected return and the discount rate applied on
   the plan assets. For 2012, the changes would have increased the net defined benefit liability by approximately SEK 4,800m and reduced retained earn-
   ings by SEK 4,100m.
      The modified net interest calculation and the removal of the amortization of the actuarial losses would have decreased the income for the period by
   approximately SEK 235m. The standard will be applied as of Q1, 2013 with full retrospective application.
12
                                                                        Consolidated results 2012


Consolidated income statement
SEKm                                                                                  Q4 2012                   Q4 2011                     2012                      2011

Net sales                                                                             29,185                    28,369                  109,994                  101,598
Cost of goods sold                                                                   –22,950                   –23,213                   –87,741                 –82,840
Gross operating income                                                                 6,235                      5,156                  22,253                   18,758
Selling expenses                                                                      –3,214                    –2,938                   –11,625                 –10,821
Administrative expenses                                                               –1,397                     –1,622                   –5,505                  –4,972
Other operating income/expenses                                                             4                        20                        59                    190
Items affecting comparability                                                         –1,032                       –104                   –1,032                    –138
Operating income                                                                         596                        512                    4,150                   3,017
Margin, %                                                                                 2.0                        1.8                      3.8                     3.0
Financial items, net                                                                    –154                       –184                     –672                    –237
Income after financial items                                                             442                        328                    3,478                   2,780
Margin, %                                                                                 1.5                        1.2                      3.2                     2.7
Taxes                                                                                   –150                       –107                     –879                    –716
Income for the period                                                                    292                        221                    2,599                   2,064

Available for sale instruments                                                             32                      –13                        23                      –91
Cash-flow hedges                                                                           37                      –28                        34                      111
Exchange-rate differences on translation of foreign operations                            –71                     –168                    –1,532                     –223
Income tax relating to other comprehensive income                                          –5                       –6                        –2                     –104
Other comprehensive income, net of tax                                                     –7                     –215                    –1,477                    –307
Total comprehensive income for the period                                                 285                        6                     1,122                    1,757

Income for the period attributable to:
Equity holders of the Parent Company                                                      291                      220                     2,596                    2,064
Non-controlling interests                                                                   1                        1                         3                        0
Total                                                                                     292                      221                     2,599                    2,064

Total comprehensive income for the period attributable to:
Equity holders of the Parent Company                                                      286                         5                    1,126                    1,752
Non-controlling interests                                                                  –1                         1                       –4                        5
Total                                                                                     285                         6                    1,122                    1,757

Earnings per share, SEK                                                                   1.02                    0.77                      9.08                     7.25
Diluted, SEK                                                                              1.02                    0.77                      9.06                     7.21
Number of shares after buy-backs, million                                                286.1                   284.7                     286.1                    284.7
Average number of shares after buy-backs, million                                        286.1                   284.7                     285.9                    284.7
Diluted, million                                                                         287.0                   286.0                     286.6                    286.1


Items affecting comparability
SEKm                                                                                  Q4 2012                   Q4 2011                     2012                      2011


Restructuring provisions and write-downs
Major Appliances, Europe, Middle East and Africa, adapting
manufacturing footprint                                                                  –927                          –                    –927                         –
Additional pension costs, appliances plant in L’Assomption,
Canada                                                                                   –105                          –                    –105                         –
Appliances plant in Kinston, USA                                                             –                    –104                          –                    –104
Reduced workforce in Major Appliances, Europe                                                –                         –                        –                     –54
Reversal of unused restructuring provisions                                                 –                        –                         –                       20
Total                                                                                  –1,032                     –104                    –1,032                     –138


Non recurring costs in the fourth quarter and full year of 2011
SEKm                                                                                  Q4 2012                  Q4 2011                      2012                       2011

Reduction of staffing levels, Europe                                                         –                     500                          –                      500
WEEE related costs, Europe                                                                   –                     190                          –                      190
Reduction of staffing levels, North America                                                  –                       15                         –                        15
Reduction of staffing levels, Asia/Pacific                                                   –                       20                         –                        20
Reduction of staffing levels, Small Appliances                                               –                       45                         –                        45
Reduction of staffing levels, Group functions                                                –                      55                          –                       55
Total                                                                                        –                     825                          –                      825

To improve cost efficiency, Electrolux implemented a number of cost-saving activities in the fourth quarter of 2011. Activities to reduce staffing levels in all regions were
initiated. Non-recurring costs for these activities were charged to operating income in the amount of SEK 635m. In addition, non-recurring historical WEEE related costs
in Hungary amounting to SEK 190m were charged to operating income, see table above.

                                      Financial data quarterly and yearly can be downloaded and viewed at www.electrolux.com/ir.
                                         There is a graph section where you can view trends as well as compare financial items.
13
                                                         Consolidated results 2012


Consolidated balance sheet
SEKm                                                                                 Dec. 31, 2012   Dec. 31, 2011

Assets
Property, plant and equipment                                                             16,693         15,613
Goodwill                                                                                   5,541           6,008
Other intangible assets                                                                    5,079           5,146
Investments in associates                                                                     16              18
Deferred tax assets                                                                        3,306           2,980
Financial assets                                                                             552             517
Other non-current assets                                                                   2,356           3,036
Total non-current assets                                                                  33,543         33,318
Inventories                                                                               12,963          11,957
Trade receivables                                                                         18,288         19,226
Tax assets                                                                                   609             666
Derivatives                                                                                  184             252
Other current assets                                                                       3,607           3,662
Short-term investments                                                                       123             337
Cash and cash equivalents                                                                  6,835           6,966
Total current assets                                                                      42,609         43,066
Total assets                                                                              76,152         76,384

Equity and liabilities
Equity attributable to equity holders of the Parent Company
Share capital                                                                               1,545          1,545
Other paid-in capital                                                                       2,905          2,905
Other reserves                                                                             –1,146            324
Retained earnings                                                                          16,479         15,761
Total equity                                                                              19,783         20,535
Non controlling interests                                                                      41            109
Total equity                                                                              19,824         20,644
Long-term borrowings                                                                      10,005           9,639
Deferred tax liabilities                                                                    1,148          1,127
Provisions for post-employment benefits                                                     1,736           2,111
Other provisions                                                                            4,551          5,300
Total non-current liabilities                                                             17,440         18,177
Accounts payable                                                                          20,590         18,490
Tax liabilities                                                                             1,287          1,717
Short-term liabilities                                                                     11,829        10,497
Short-term borrowings                                                                       2,795          4,170
Derivatives                                                                                   241            324
Other provisions                                                                            2,146          2,365
Total current liabilities                                                                 38,888         37,563
Total equity and liabilities                                                              76,152         76,384

Contingent liabilities                                                                      1,610          1,276


Change in consolidated equity
SEKm                                                                                 Dec. 31, 2012   Dec. 31, 2011

Opening balance                                                                           20,644         20,613
Total comprehensive income for the period                                                  1,122          1,757
Share-based payment                                                                         –141             29
Sale of shares                                                                               212              –
Dividend                                                                                  –1,860         –1,850
Dividend to non-controlling interests                                                          –             –1
Acquisition of operations                                                                   –153             96
Total transactions with equity holders                                                    –1,942         –1,726
Closing balance                                                                           19,824         20,644
14
                                                                       Consolidated results 2012


Consolidated cash flow statement
SEKm                                                                               Q4 2012         Q4 2011     2012      2011

Operations
Operating income                                                                        596           512     4,150     3,017
Depreciation and amortization                                                           796           818     3,251     3,173
Capital gain/loss included in operating income                                            –           –33       –52      –207
Restructuring provisions                                                                924           628       457       110
Share-based compensation                                                                 11            12      –141        29
Financial items paid, net                                                              –223          –244      –673      –214
Taxes paid                                                                             –465          –446    –1,564    –1,625
Cash flow from operations, excluding change
in operating assets and liabilities                                                    1,639        1,247     5,428    4,283

Change in operating assets and liabilities
Change in inventories                                                                   993         1,649    –1,710       269
Change in trade receivables                                                            –435         –403       –119       244
Change in other current assets                                                         –113           653      –123       200
Change in accounts payable                                                              296          –232     3,086     1,379
Change in other operating liabilities and provisions                                   –271        –1,204       593      –976
Cash flow from change in operating assets
and liabilities                                                                          470          463     1,727    1,116
Cash flow from operations                                                              2,109        1,710     7,155    5,399

Investments
Acquisition of operations                                                                –         –3,821      –164    –6,377
Divestment of operations                                                                 –             608        –       821
Capital expenditure in property, plant and equipment                                –1,275          –1,025   –4,090    –3,163
Capital expenditure in product development                                            –180             –51     –477      –374
Capital expenditure in software                                                       –177           –230      –574      –744
Other1)                                                                                281            –117      528      –212
Cash flow from investments                                                          –1,351         –4,636    –4,777   –10,049
Cash flow from operations and investments                                              758         –2,926     2,378    –4,650

Financing
Change in short-term investments                                                       366            388       206     1,444
Change in short-term borrowings                                                        148           –519      –325      –619
New long-term borrowings                                                             1,512              –     2,569    3,503
Amortization of long-term borrowings                                                –2,744           –250    –3,063    –1,161
Dividend                                                                                  –             –    –1,868    –1,850
Sale of shares                                                                            –             –       212         –
Cash flow from financing                                                               –718          –381    –2,269     1,317

Total cash flow                                                                           40       –3,307       109   –3,333
Cash and cash equivalents at beginning of period                                       6,836       10,226     6,966   10,389
Exchange-rate differences referring to cash and cash
equivalents                                                                              –41           47      –240      –90
Cash and cash equivalents at end of period                                             6,835        6,966     6,835    6,966


1) 	Includes grants related to investments of SEK 654m for the full year 2012.
15
                                                                   Consolidated results 2012


Key ratios
SEKm unless otherwise stated                                                           Q4 2012             Q4 2011                 2012                 2011

Net sales                                                                              29,185              28,369              109,994              101,598
Organic growth, %                                                                          7.5                 0.0                  5.5                  0.2
Items affecting comparability                                                          –1,032                –104               –1,032                 –138
Operating income                                                                          596                 512                4,150                3,017
Margin, %                                                                                  2.0                 1.8                  3.8                  3.0
Income after financial items                                                              442                 328                3,478                2,780
Income for the period                                                                     292                 221                2,599                2,064
Capital expenditure, property, plant and equipment                                     –1,275              –1,025               –4,090               –3,163
Operating cash flow                                                                     1,446                 977                4,779                2,745
Earnings per share, SEK1)                                                                1.02                0.77                 9.08                  7.25
Equity per share, SEK                                                                        –                   –               69.28                72.52
Capital-turnover rate, times/year                                                            –                   –                  4.1                  4.6
Return on net assets, %                                                                      –                   –                15.6                 13.7
Return on equity, %                                                                          –                   –                13.3                 10.4
Net borrowings                                                                               –                   –               5,685                6,367
Net debt/equity ratio                                                                        –                   –                0.29                 0.31
Average number of shares excluding shares owned by
Electrolux, million                                                                     286.1               284.7                 285.9               284.7
Average number of employees                                                            61,047              56,912                59,478              52,916

Excluding items affecting comparability
Operating income                                                                        1,628                 616                 5,182               3,155
Margin, %                                                                                  5.6                2.2                    4.7                 3.1
Earnings per share, SEK¹)                                                                 4.12               1.01                 12.18                7.55
Capital-turnover rate, times/year                                                            –                  –                   4.0                 4.3
Return on net assets, %                                                                      –                  –                  18.8                13.5


Excluding intems affecting comparability and non-recurring
costs in 2011.
Non-recurring costs in the fourth quarter of 20112)                                          –                 825                      –                825
Operating income                                                                         1,628               1,441                  5,182              3,980
Margin, %                                                                                   5.6                 5.1                   4.7                 3.9

1) Basic, based on average number of shares, excluding shares owned by Electrolux.
2) For more information on non-recurring costs, see page 12.

For definitions, see page 22.


Shares
                                                                                                                                                 Shares held
                                                                         Outstanding         Outstanding      Outstanding     Shares held by        by other
Number of shares                                                            A-shares           B-shares       shares, total       Electrolux    shareholders

Number of shares as of January 1, 2012                                     8,212,725       300,707,583     308,920,308        24,255,085       284,665,223
Conversion of A-shares into B-shares                                               –                 –               –                  –                –
Sale of shares                                                                     –                 –               –         –1,469,595        1,469,595
Number of shares as of December 31 2012
                                       ,                                  8,212,725        300,707,583     308,920,308        22,785,490       286,134,818
As % of total number of shares                                                                                                       7.4%
16
                                                        Consolidated results 2012


Net sales by business area
SEKm                                                                Q4 2012              Q4 2011        2012              2011

Major Appliances Europe, Middle East and Africa                      9,216                9,749       34,278          34,029
Major Appliances North America                                       7,207                6,271       30,684          27,665
Major Appliances Latin America                                       6,411                6,003       22,044           17,810
Major Appliances Asia/Pacific                                        2,259                2,180        8,405            7,852
Small Appliances                                                     2,689                2,579        9,011            8,359
Professional Products                                                1,402                1,587        5,571            5,882
Other                                                                    1                    0            1                1
Total                                                               29,185               28,369      109,994         101,598


Operating income by business area
SEKm                                                                Q4 2012              Q4 2011        2012              2011

Major Appliances Europe, Middle East and Africa                           343               –202       1,142              709
Margin, %                                                                   3.7              –2.1         3.3              2.1
Major Appliances North America                                            367                   76     1,561              250
Margin, %                                                                   5.1                1.2         5.1             0.9
Major Appliances Latin America                                            657                345       1,590              820
Margin, %                                                                 10.2                5.7          7.2             4.6
Major Appliances Asia/Pacific                                              211                213         746             736
Margin, %                                                                  9.3                9.8         8.9              9.4
Small Appliances                                                          223                237         473              543
Margin, %                                                                  8.3                9.2         5.2              6.5
Professional Products                                                      158                191        596              841
Margin, %                                                                 11.3               12.0        10.7            14.3
Common Group costs, etc.                                                 –331               –244        –926             –744
Total Group, excluding items affecting comparability                    1,628                616       5,182            3,155
Margin, %                                                                  5.6                2.2         4.7              3.1

Items affecting comparability                                        –1,032                 –104      –1,032             –138
Operating income                                                        596                  512       4,150            3,017
Margin, %                                                               2.0                  1.8         3.8              3.0


Change in net sales by business area
                                                                                          Q4 2012                         2012
                                                                                    in comparable                in comparable
Year–over–year, %                                                   Q4 2012             currencies      2012         currencies

Major Appliances Europe, Middle East and Africa                           –5.5              –2.5         0.7              3.2
Major Appliances North America                                            14.9              17.7        10.9              6.9
Major Appliances Latin America                                             6.8              19.2        23.8             34.6
Major Appliances Asia/Pacific                                              3.6               3.4         7.0              2.9
Small Appliances                                                           4.3               7.5         7.8              8.4
Professional Products                                                    –11.7              –8.9        –5.3             –3.9
Total change                                                               2.9               7.5         8.3              9.4


Change in operating income by business area
                                                                                          Q4 2012                         2012
                                                                                    in comparable                in comparable
Year–over–year, %                                                   Q4 2012             currencies      2012         currencies

Major Appliances Europe, Middle East and Africa                         269.8              297.6        61.1             71.8
Major Appliances North America                                          382.9              358.9       524.4            483.5
Major Appliances Latin America                                            90.4             108.1        93.9            105.0
Major Appliances Asia/Pacific                                             –0.9              –7.5         1.4             –5.8
Small Appliances                                                          –5.9              –6.1       –12.9             –9.1
Professional Products                                                    –17.3             –13.3       –29.1            –26.9
Total change, excluding items affecting comparability                   164.3              172.4        64.2             64.9
17
                                                                   Consolidated results 2012


Working capital and net assets
                                                                                                            % of annualized                       % of annualized
SEKm                                                                                   Dec. 31, 2012              net sales   Dec. 31, 2011             net sales

Inventories                                                                                 12,963                     11.3        11,957                   10.5
Trade receivables                                                                           18,288                     15.9        19,226                   17.0
Accounts payable                                                                           –20,590                    –17.9       –18,490                  –16.3
Provisions                                                                                  –8,433                                 –9,776
Prepaid and accrued income and expenses                                                      –7,467                                –6,598
Taxes and other assets and liabilities                                                       –1,647                                –1,499
Working capital                                                                             –6,886                    –6.0         –5,180                   –4.6
Property, plant and equipment                                                               16,693                                 15,613
Goodwill                                                                                      5,541                                 6,008
Other non–current assets                                                                      8,003                                 8,717
Deferred tax assets and liabilities                                                           2,158                                 1,853
Net assets                                                                                  25,509                    22.2         27,011                  23.8
Average net assets                                                                          26,543                    24.1         22,091                  21.7
Average net assets, excluding items
affecting comparability                                                                        27,585                  25.1        23,354                   23.0


Net assets by business area
                                                          Assets                         Equity and liabilities                      Net assets
                                                    Dec. 31,           Dec. 31,          Dec. 31,                 Dec. 31,        Dec. 31,               Dec. 31,
SEKm                                                  2012               2011               2012                    2011            2012                   2011

Major Appliances Europe,
Middle East and Africa                              22,826              24,297            14,418                  14,847            8,408                 9,450
Major Appliances North America                      12,377              10,391             6,645                   5,075            5,732                 5,316
Major Appliances Latin America                      13,337              14,075             6,637                   6,607            6,700                 7,468
Major Appliances Asia/Pacific                        4,933               4,630             2,714                   2,590            2,219                 2,040
Small Appliances                                     4,532               4,792             3,013                   2,582            1,519                 2,210
Professional Products                                2,671               2,829             1,775                   1,897              896                   932
Other1)                                              8,127               7,414             6,235                   6,816            1,892                   598
Items affecting comparability                          –54                 117             1,803                   1,120           –1,857                –1,003
Total operating assets and
liabilities                                         68,749             68,545             43,240                  41,534          25,509                 27,011
Liquid funds                                         7,403              7,839                  –                       –               –                      –
Interest-bearing receivables                             –                  –                  –                       –               –                      –
Interest-bearing liabilities                             –                  –             13,088                  14,206               –                      –
Equity                                                   –                  –             19,824                  20,644               –                      –
Total                                               76,152             76,384             76,152                  76,384               –                      –

1) Includes common Group functions and tax items.
18
                                                                    Consolidated results 2012


Net sales and income per quarter
                                                                                                 Full year                                            Full year
SEKm                                               Q1 2011     Q2 2011      Q3 2011    Q4 2011       2011    Q1 2012   Q2 2012   Q3 2012   Q4 2012         2012

Net sales                                          23,436      24,143       25,650     28,369    101,598     25,875    27,763     27,171   29,185     109,994
Operating income                                      696         745        1,064        512      3,017        943     1,150      1,461      596       4,150
Margin, %                                              3.0         3.1          4.1        1.8        3.0        3.6       4.1       5.4       2.0         3.8
Operating income, excluding items
affecting comparability                               696         745        1,098        616      3,155        943     1,150     1,461     1,628       5,182
Margin, %                                              3.0         3.1          4.3        2.2        3.1        3.6       4.1      5.4        5.6         4.7
Income after financial items                          637         696         1,119       328      2,780        792       993     1,251       442       3,478
Income after financial items, excluding items
affecting comparability                               637         696        1,153       432       2,918       792       993      1,251      1,474      4,510
Income for the period                                 457         561          825       221       2,064       559       763        985       292       2,599
Earnings per share, SEK1)                             1.61        1.97        2.90       0.77        7.25      1.96      2.67      3.43       1.02       9.08
Earnings per share, SEK, excluding items
affecting comparability1)                             1.61        1.97        2.96       1.01       7.55       1.96      2.67      3.43       4.12       12.18

Items affecting comparability2)                          –           –         –34       –104       –138          –         –         –    –1,032      –1,032

Number of shares after buy-backs, million            284.7      284.7        284.7      284.7      284.7      286.1     286.1     286.1     286.1       286.1
Average number of shares after buy-backs,
million                                              284.7      284.7        284.7      284.7      284.7      285.4     286.1     286.1     286.1       285.9
1) Basic, based on average number of shares, excluding shares owned by Electrolux.
2) Restructuring provisions, write-downs and capital loss on divestments.


Net sales and operating income by business area per quarter
                                                                                                 Full year                                            Full year
SEKm                                               Q1 2011     Q2 2011      Q3 2011    Q4 2011       2011    Q1 2012   Q2 2012   Q3 2012   Q4 2012         2012

Major Appliances Europe, Middle
East and Africa
Net sales                                            7,656       7,660       8,964      9,749     34,029      8,265     8,216     8,581     9,216      34,278
Operating income                                       311         156         444      –202         709        281       215       303       343       1,142
Margin, %                                               4.1        2.0          5.0       –2.1        2.1       3.4        2.6      3.5        3.7         3.3

Major Appliances North America
Net sales                                            6,728       7,544        7,122     6,271     27,665       7,107    8,599     7,771      7,207     30,684
Operating income                                       –71         138          107        76        250         159      512       523        367      1,561
Margin, %                                              –1.1         1.8          1.5      1.2         0.9        2.2       6.0       6.7        5.1        5.1

Major Appliances Latin America
Net sales                                           3,998       3,708        4,101      6,003     17,810      5,149     5,183     5,301      6,411     22,044
Operating income                                      139         114          222        345        820        278       316       339       657       1,590
Margin, %                                              3.5         3.1          5.4        5.7        4.6       5.4        6.1       6.4      10.2         7.2

Major Appliances Asia/Pacific
Net sales                                            1,746      1,945        1,981      2,180      7,852      1,841     2,198     2,107     2,259       8,405
Operating income                                       174        177          172        213        736        155       172       208       211         746
Margin, %                                             10.0         9.1          8.7       9.8         9.4       8.4        7.8       9.9      9.3          8.9

Small Appliances
Net sales                                            1,930       1,794       2,056      2,579      8,359      2,105     2,105      2,112    2,689        9,011
Operating income                                       114          23         169        237        543         93         31       126      223          473
Margin, %                                               5.9         1.3        8.2        9.2         6.5        4.4       1.5       6.0       8.3         5.2

Professional Products
Net sales                                            1,378       1,491       1,426      1,587      5,882      1,408     1,462     1,299     1,402       5,571
Operating income                                       177         274         199        191        841        132       155       151       158         596
Margin, %                                             12.8        18.4        14.0       12.0       14.3         9.4     10.6       11.6      11.3       10.7

Other
Net sales                                                –          1            –          –          1          –         –         –         1           1
Operating income, common group costs, etc.            –148       –137         –215       –244       –744       –155      –251      –189      –331        –926
Total Group, excluding items affecting
comparability
Net sales                                          23,436      24,143       25,650     28,369    101,598     25,875    27,763     27,171   29,185     109,994
Operating income                                      696         745        1,098        616      3,155        943     1,150      1,461    1,628       5,182
Margin, %                                              3.0         3.1          4.3        2.2        3.1        3.6       4.1       5.4       5.6         4.7

Items affecting comparability                            –           –         –34       –104       –138          –         –         –    –1,032      –1,032
Total Group
Net sales                                          23,436      24,143       25,650     28,369    101,598     25,875    27,763     27,171   29,185     109,994
Operating income                                      696         745        1,064        512      3,017        943     1,150      1,461      596       4,150
Margin, %                                              3.0         3.1          4.1        1.8        3.0        3.6       4.1       5.4       2.0         3.8
19
                                                                       Consolidated results 2012


Exchange rates
SEK                                                                                                                          Dec. 31, 2012                  Dec. 31, 2011

AUD, average                                                                                                                         6.99                           6.72
AUD, end of period                                                                                                                    6.76                          7.02
BRL, average                                                                                                                          3.46                          3.88
BRL, end of period                                                                                                                    3.19                          3.68
CAD, average                                                                                                                          6.74                          6.55
CAD, end of period                                                                                                                   6.55                           6.77
EUR, average                                                                                                                          8.70                          9.02
EUR, end of period                                                                                                                   8.58                           8.93
GBP, average                                                                                                                        10.69                          10.36
GBP, end of period                                                                                                                  10.48                          10.65
HUF, average                                                                                                                       0.0300                        0.0322
HUF, end of period                                                                                                                 0.0295                        0.0287
USD, average                                                                                                                          6.73                          6.48
USD, end of period                                                                                                                    6.52                          6.90


Acquisitions 2011*)
Consideration

SEKm                                                                                                             Olympic Group                   CTI               Total

Cash paid                                                                                                                 2,556               3,804               6,360
Total                                                                                                                     2,556               3,804               6,360


Recognized amounts of identifiable assets acquired and liabilities
assumed at fair value
SEKm

Property, plant and equipment                                                                                               555                 382                  937
Intangible assets                                                                                                           516               1,012               1,528
Inventories                                                                                                                 577                 734                1,311
Trade receivables                                                                                                           195                 763                  958
Other current and non-current assets                                                                                        236                 310                  546
Accounts payable                                                                                                           –223                –189                –412
Other operating liabilities                                                                                                –574                –886              –1,460
Current assets classified as held for sale                                                                                  537                   –                  537
Total identifiable net assets acquired                                                                                    1,819               2,126               3,945
Cash and cash equivalents                                                                                                    34                 114                  148
Borrowings                                                                                                                 –723                –499              –1,222
Assumed net debt                                                                                                           –689                –385              –1,074
Non-controlling interests                                                                                                   –69                 –41                 –110
Goodwill                                                                                                                  1,495               2,104               3,599
Total                                                                                                                     2,556               3,804               6,360

*) Olympic Group and CTI are included in Electrolux consolidated accounts as of September and October 2011, respectively.

CTI group
In Chile, CTI group manufactures refrigerators, stoves, washing machines and heaters, sold under the brands Fensa and Mademsa, and is the leading manufacturer with
a volume market share of 36%. CTI group also holds a leading position in Argentina with the GAFA brand and in Chile, Somela is the largest supplier of small domestic
appliances. CTI group has 2,200 employees and two manufacturing sites in Chile and one site in Argentina. This acquisition is part of Electrolux strategy to grow in emerg-
ing markets and provides significant revenue and growth synergies. The acquisition makes Electrolux the largest supplier of appliances in Chile and Argentina, and further
enhances Electrolux position as a leading appliance company in the fast-growing Latin American markets.

CTI’s and Somela’s shares are listed on the Santiago Stock Exchange in Chile.

Olympic Group
Olympic Group is a leading manufacturer of appliances in the Middle East with a volume market share in Egypt of approximately 30%. The company has 7,100 employees
and manufactures washing machines, refrigerators, cookers and water heaters. The acquisition is part of Electrolux strategy to grow in emerging markets like Middle East
and Africa. Electrolux and Olympic Group have developed a successful commercial partnership in the region for almost 30 years, which today covers technology, supply
of components, distribution and brand licensing.
20
                               Consolidated results 2012


Parent Company, income statement
SEKm                                       Q4 2012         Q4 2011           2012            2011

Net sales                                    1,676          1,754          6,125           6,660
Cost of goods sold                          –1,377         –1,311         –4,638          –5,023
Gross operating income                         299            443          1,487           1,637
Selling expenses                              –415           –333         –1,297          –1,109
Administrative expenses                       –205            113           –469            –295
Other operating income                         122            107            293             298
Other operating expenses                       –37              –            –38             –10
Operating income                             –236             330            –24             521
Financial income                               491          1,417          2,137           2,727
Financial expenses                            –468           –190         –1,001            –344
Financial items, net                            23         1,227           1,136           2,383
Income after financial items                  –213         1,557           1,112           2,904
Appropriations                                   6              9             16              32
Income before taxes                           –207         1,566           1,128           2,936
Taxes                                           46            –65             –9            –191
Income for the period                         –161         1,501           1,119           2,745


Parent Company, balance sheet
SEKm                                                                 Dec. 31, 2012   Dec. 31, 2011

Assets
Non-current assets                                                        33,436         33,247
Current assets                                                            16,008         14,833
Total assets                                                              49,444         48,080

Equity and liabilities
Restricted equity                                                          4,562           4,562
Non-restricted equity                                                     15,269         15,938
Total equity                                                              19,831         20,500
Untaxed reserves                                                             581             597
Provisions                                                                 1,097             732
Non-current liabilities                                                    9,573           9,220
Current liabilities                                                       18,362          17,031
Total equity and liabilities                                              49,444         48,080

Pledged assets                                                                 –               5
Contingent liabilities                                                     1,692           1,428
21
                                                       Consolidated results 2012


Operations by business area yearly
SEKm                                                             2012                2011       2010       2009       2008

Major Appliances Europe, Middle East and Africa
Net sales                                                     34,278               34,029     36,596    40,500      42,952
Operating income                                               1,142                  709      2,297     1,912       –303
Margin, %                                                        3.3                   2.1        6.3       4.7       –0.7

Major Appliances North America
Net sales                                                     30,684               27,665     30,969    32,694      29,836
Operating income                                               1,561                  250      1,442     1,299          85
Margin, %                                                         5.1                  0.9        4.7       4.0         0.3

Major Appliances Latin America
Net sales                                                     22,044               17,810     16,260    13,302      10,485
Operating income                                               1,590                  820        951       809         645
Margin, %                                                         7.2                  4.6        5.8       6.1         6.2

Major Appliances Asia/Pacific
Net sales                                                      8,405                7,852      7,679      7,037      6,049
Operating income                                                 746                  736        793        378         93
Margin, %                                                         8.9                  9.4      10.3         5.4        1.5

Small Appliances
Net sales                                                       9,011               8,359      8,422      8,464      7,987
Operating income                                                  473                 543        802        763        764
Margin, %                                                         5.2                  6.5        9.5        9.0        9.6

Professional Products
Net sales                                                       5,571               5,882      6,389      7,129      7,427
Operating income                                                  596                 841        743        668        774
Margin, %                                                        10.7                14.3        11.6        9.4      10.4

Other
Net sales                                                          1                    1         11         6          56
Operating income, common Group costs, etc.                      –926                 –744       –534      –507        –515

Total Group, excluding items affecting comparability
Net sales                                                    109,994           101,598       106,326    109,132    104,792
Operating income                                                5,182            3,155         6,494      5,322      1,543
Margin, %                                                       4.7%                3.1           6.1        4.9        1.5
Items affecting comparability                                  –1032              –138        –1,064     –1,561      –355

Total Group, including items affecting comparability
Net sales                                                    109,994           101,598       106,326    109,132    104,792
Operating income                                               4,150             3,017         5,430      3,761      1,188
Margin, %                                                      3.8%                 3.0           5.1       3.4         1.1
22
                                                              Consolidated results 2012


Five-year review
SEKm unless otherwise stated                                              2012               2011            2010                2009          2008

Net sales                                                              109,994            101,598         106,326             109,132      104,792
Organic growth, %                                                           5.5                0.2             1.5               –4.8          –0.9
Items affecting comparability                                           –1,032               –138          –1,064              –1,561         –355
Operating income                                                         4,150              3,017           5,430               3,761        1,188
Margin, %                                                                   3.8                3.0             5.1                 3.4           1.1
Income after financial items                                             3,478              2,780           5,306               3,484          653
Income for the period                                                    2,599              2,064           3,997               2,607          366
Capital expenditure, property, plant and equipment                       4,090              3,163           3,221               2,223        3,158
Operating cash flow                                                      4,779              2,745           4,587               6,603        2,875
Earnings per share, SEK                                                   9.08                7.25          14.04                 9.18         1.29
Equity per share, SEK                                                       69                  73              72                  66           58
Dividend per share, SEK                                                  6.501)              6.50            6.50                4.00              –
Capital-turnover rate, times/year                                           4.1                4.6             5.4                 5.6          5.1
Return on net assets, %                                                   15.6               13.7             27.8               19.4           5.8
Return on equity, %                                                       13.3               10.4            20.6                14.9           2.4
Net borrowings                                                           5,685              6,367            –709                 665        4,556
Net debt/equity ratio                                                     0.29               0.31           –0.03                0.04          0.28
Average number of shares excluding shares owned by
Electrolux, million                                                      285.9              284.7           284.6              284.0         283.1
Average number of employees                                             59,478             52,916          51,544             50,633        55,177

Excluding items affecting comparability
Operating income                                                         5,182              3,155           6,494               5,322        1,543
Margin, %                                                                   4.7                3.1             6.1                 4.9          1.5
Earnings per share, SEK                                                   12.2               7.55           16.65               13.56         2.32
Capital-turnover rate, times/year                                          4.0                4.3              5.1                 5.4          4.9
Return on net assets, %                                                   18.8               13.5            31.0                26.2           7.2
1) Proposed by the Board of Directors.

Financial goals over a business cycle
The financial goals set by Electrolux aim to strengthen the Group’s                                          Financial goals
leading, global position in the industry and assist in generating a
                                                                                                             • Operating margin of 6%
healthy total yield for Electrolux shareholders. The objective is
growth with consistent profitability. The key ratios exclude items                                           • Capital-turnover rate 4%
affecting comparability.
                                                                                                             • Return on net assets 20%

                                                                                                             • Average annual growth 4%

Definitions
Capital indicators                                                             Other key ratios
Annualized sales                                                               Organic growth
In computation of key ratios where capital is related to net sales, the        Sales growth, adjusted for acquisitions, divestments and changes in
latter are annualized and converted at year-end-exchange rates and             exchange rates.
adjusted for acquired and divested operations.
                                                                               Operating cash flow
Net assets                                                                     Cash flow from operations and investments excluding financial
Total assets exclusive of liquid funds and interest-bearing financial          items paid, taxes paid and acquisitions and divestment of opera-
receivables less operating liabilities, non-interest-bearing provisions        tions.
and deferred tax liabilities.
                                                                               Earnings per share
Working capital                                                                Income for the period divided by the average number of shares after
Current assets exclusive of liquid funds and interest-bearing finan-           buy-backs.
cial receivables less operating liabilities and non-interest-bearing
provisions.                                                                    Operating margin
                                                                               Operating income expressed as a percentage of net sales.
Total borrowings
Total borrowings consist of interest-bearing liabilities, fair-value           Return on equity
derivatives, accrued interest expenses and prepaid interest                    Income for the period expressed as a percentage of average equity.
income, and trade receivables with recourse.
                                                                               Return on net assets
Net borrowings                                                                 Operating income expressed as a percentage of average net assets.
Total borrowings less liquid funds.
                                                                               Capital-turnover rate
Net debt/equity ratio                                                          Net sales in relation to average net assets.
Net borrowings in relation to equity.

Equity/assets ratio
Equity as a percentage of total assets less liquid funds.
23
                                                                Consolidated results 2012


President and CEO Keith McLoughlin’s ­ omments on the
                                          c
fourth-quarter and full-year results 2012
Today’s press release is available on the Electrolux website
www.electrolux.com/ir


Telephone conference
A telephone conference is held at 15.00 CET on February 1, 2013.
The conference is chaired by Keith McLoughlin, President and
CEO of Electrolux. Mr. McLoughlin is accompanied by Tomas 
Eliasson, CFO, and Peter Nyquist, SVP Investor Relations and
Financial Information.

A slide presentation on the fourth-quarter results and full-year of
2012 will be available on the Electrolux website
www.electrolux.com/ir

Details for participation by telephone are as follows:
Participants in Sweden should call +46 (0)8 505 598 53                           Calendar 2013
Participants in UK/Europe should call +44 (0)20 3043 2436                        Financial reports 2013
Participants in US should call +1 866 458 4087                                   Interim report January – March                    April 25
                                                                                 Interim report January – June                      July 19
You can also listen to the presentation at                                       Interim report January – September             October 25
www.electrolux.com/interim-report-webcast
                                                                                 Annual Report 2012
For further information                                                          Available at the Group’s website                  Week 10
Peter Nyquist, Senior Vice President, Head of Investor Relations
                                                                                 Annual General Meeting 2013                      March 26
and Financial Information: +46 (0)8 738 60 03.
                                                                                 The Annual General Meeting will be held at Stockholm Water-
Financial information from Electrolux is available at                            front Congress Centre, situated at Nils Ericsons Plan 4 in
www.electrolux.com/ir                                                            Stockholm, Sweden.


Factors affecting forward-looking statements
This report contains “forward-looking” statements within the meaning of the US Private Securities Litigation Reform Act of 1995. Such
statements include, among others, the financial goals and targets of Electrolux for future periods and future business and financial plans.
These statements are based on current expectations and are subject to risks and uncertainties that could cause actual results to differ
materially due to a variety of factors. These factors include, but may not be limited to the following; consumer demand and market condi-
tions in the geographical areas and industries in which Electrolux operates, effects of currency fluctuations, competitive pressures to
reduce prices, significant loss of business from major retailers, the success in developing new products and marketing initiatives, devel-
opments in product liability litigation, progress in achieving operational and capital efficiency goals, the success in identifying growth
opportunities and acquisition candidates and the integration of these opportunities with existing businesses, progress in achieving struc-
tural and supply-chain reorganization goals.

Electrolux discloses the information provided herein pursuant to the Securities Market Act and/or the Financial Instruments Trading Act.
The information was submitted for publication at 08.00 CET on February 1, 2013.


AB ELECTROLUX (PUBL)
Postal address 	                             Media hotline	                            Investor Relations	               E-mail
SE-105 45 Stockholm, Sweden	                 +46 8 657 65 07	                          +46 8 738 60 03	                  ir@electrolux.se	
Visiting address	                            Telefax	                                  Website	                          Reg. No.
S:t Göransgatan 143	                         +46 8 738 74 61	                          www.electrolux.com	               556009-4178

Electrolux Consolidated results 2012

  • 1.
    XX Consolidated results 2012 Stockholm,February 1, 2013 Highlights of the fourth quarter of 2012 Read more • Net sales amounted to SEK 29,185m (28,369) and income for the period was SEK 292m (221), or SEK 1.02 (0.77) per share. 2 • Net sales improved by 2.9%, of which 7.5% was organic growth and –4.6% changes in exchange rates. 2 • Strong volume growth, price increases and mix improvements in Latin America and North America contributed to the positive trend in net sales. 4-5 • Market conditions in Europe continued to weaken and Major Appliances, Small Appliances and Professional Products, were negatively impacted. 4-6 • Operations in Latin America showed record earnings. 5 • orth America showed strong earnings growth despite extra costs from plant restructuring N and for entering new distribution channels. 4 • Lower volumes and a weak price/mix development in Europe had a negative impact on results. 4 • Measures to improve manufacturing footprint were initiated and SEK 1,032m was charged to operating income within items affecting comparability, as previously communicated. 8 • The Board proposes a dividend for 2012 of SEK 6.50 (6.50) per share. 9 Financial overview SEKm1) Q4 2012 Q4 2011 Change, % 2012 2011 Change, % Net sales 29,185 28,369 3 109,994 101,598 8 Operating income 1,628 616 164 5,182 3,155 64 Margin, % 5.6 2.2 4.7 3.1 Income after financial items 1,474 432 241 4,510 2,918 55 Income for the period 1,179 286 312 3,486 2,148 62 Earnings per share, SEK 2) 4.12 1.01 12.18 7.55 Operating cash flow3) 1,446 977 48 4,779 2,745 74 1) Key ratios are excluding items affecting comparability. Items affecting comparability amounted to SEK –1,032m (–104) for the fourth quarter of 2012 and SEK –1,032m (–138) for the full year of 2012. Items affecting comparability includes costs for restructuring programs to make the Group’s production competitive in the long term, see pages 8 and 12. 2) asic, based on an average of 286.1 (284.7) million shares for the fourth quarter and 285.9 (284.7) million shares for the full year of 2012, excluding shares held by B Electrolux. 3) Excluding financial items paid, taxes paid and acquisitions and divestments of operations. Nullupid qui voluptiumdilution,di as si 12. For earnings per share after sum see page For definitions, see page 22. For further information, please contact Peter Nyquist, Senior Vice President, Head of Investor Relations and Financial Information, at +46 8 738 60 03. About Electrolux Electrolux is a global leader in household appliances and appliances for professional use, selling more than 40 million products to customers in more than 150 markets every year. The company focuses on innovative solutions that are thoughtfully designed, based on extensive consumer insight, to meet the real needs of consumers and professionals. Electrolux products include refrigerators, dishwashers, washing machines, cookers, air-conditioners and small appliances such as vacuum cleaners sold under esteemed brands like Electrolux, AEG, Eureka and Frigidaire. For more information, go to www.electrolux.com/press and www.electrolux.com/news.
  • 2.
    2 Consolidated results 2012 Market overview Market demand for appliances in some of Electrolux core markets Market demand in Eastern Europe increased by 2% and demand in continued to decline in the fourth quarter of 2012 year-over-year, Latin America and Southeast Asia continued to show strong growth. while demand in emerging markets continued to grow. Market demand for core appliances in Europe in 2013 is expected Market demand for core appliances in Western Europe and North to decline while demand in North America is expected to increase. America declined by 2%. Market demand in Australia is estimated to have declined. Industry shipments of core appliances in Europe* Industry shipments of core appliances in the US* % % 30 5 Western Europe Eastern Europe 20 0 Q1 Q2 Q3 Q4 Q1 Q2 Q3 Q4 10 –5 0 Q1 Q2 Q3 Q4 Q1 Q2 Q3 Q4 –10 –10 2011 2012 –20 2011 2012 * ­­Units, year-over-year, %. * ­­Units, year-over-year, %. Sources: North America: AHAM. Europe: GfK. For other markets there are no comprehensive market statistics. The fourth quarter in summary* SEKm Q4 2012 Q4 2011 Change, % 2012 2011 Change, % Net sales 29,185 28,369 2.9 109,994 101,598 8.3 Change in net sales, %, whereof Acquisitions – 3.9 Organic growth 7.5 5.5 Changes in exchange rates –4.6 –1.1 Operating income Major Appliances Europe, Middle East and Africa 343 –202 270 1,142 709 61 Major Appliances North America 367 76 383 1,561 250 524 Major Appliances Latin America 657 345 90 1,590 820 94 Major Appliances Asia/Pacific 211 213 –1 746 736 1 Small Appliances 223 237 –6 473 543 –13 Professional Products 158 191 –17 596 841 –29 Other, common Group costs, etc. –331 –244 –36 –926 –744 –24 Operating income, excluding items affecting comparability 1,628 616 164 5,182 3,155 64 Margin, % 5.6 2.2 4.7 3.1 Items affecting comparability –1,032 –104 –1,032 –138 Operating income 596 512 16 4,150 3,017 38 Margin, % 2.0 1.8 3.8 3.0 * All comments on operating income are excluding items affecting comparability. For items affecting comparability, see page 12. The fourth quarter of 2011 included non-recurring costs in the amount of SEK 825m. The major part of these costs, SEK 690m, was related to Major Appliances Europe, Middle East and Africa, see page 12. • Organic growth, especially in Latin America and North Net sales for the Electrolux Group in the fourth quarter of 2012 America, contributed to the favorable trend in net sales. improved by 2.9%. Organic growth was 7.5%. Sales growth was • Strong performance for the operations in North America particularly strong in Latin America and North America. Changes in exchange rates had a negative impact of –4.6%. and Latin America. Operating income improved to SEK 1,628m (616), corresponding • Market conditions in Europe deteriorated and adversely to a margin of 5.6% (2.2). Operating income for the fourth quarter of impacted results for appliances, professional products and 2011 included non-recurring costs in the amount of SEK 825m. small domestic appliances in the region. Excluding these non-recurring costs, operating income for the fourth quarter of 2011 was SEK 1,441m and the corresponding mar- gin 5.1%.
  • 3.
    3 Consolidated results 2012 The performances of the operations in Latin America and North Income after financial items amounted to SEK 3,478m (2,780). America were particularly strong in the quarter. Good volume Income for the period was SEK 2,599m (2,064), corresponding to growth, price increases and mix improvements contributed to the SEK 9.08 (7.25) in earnings per share, see page 12. positive trend. Market demand in Europe weakened further in the quarter, which affected sales and operating income for the opera- tions within appliances, professional products and small appliances. Events during the fourth quarter of 2012 Price/mix pressure and weak volumes in Europe negatively impacted operating income. Previous cost-saving activities and November 20. Electrolux issues bond loan ongoing global initiatives to reduce costs continued to contribute to Electrolux has issued a SEK 500m bond loan under its EMTN (Euro the results. Medium Term Note) program. Effects of changes in exchange rates November 14. Electrolux hosts Capital Markets Day Changes in exchange rates had a negative impact year-over-year on In addition to presenting the pillars of the Electrolux strategy, man- operating income of SEK –40m. The impact of transaction effects agement gave a brief overview of the current business environment was SEK –90m, results from hedging operations SEK 70m and and how it could drive the Group’s performance in 2013. Cost sav- ings in 2013 are expected to be greater than SEK 1 billion, compared translation effects SEK –20m. The impact from transaction and to 2012. The raw-material headwinds experienced in previous years hedging operations was mainly attributable to the operations in are expected to turn into tailwinds. Although the demand situation in Latin America and the strengthening of the US dollar against the Europe remains uncertain, Electrolux as a Group expects another Brazilian real. year of positive organic sales growth. The majority of the growth is expected to derive from emerging markets and a positive price/mix development, supported by product launches. In 2013, Electrolux Financial net will continue to step up its investments in product development, Net financial items for the fourth quarter of 2012 improved to design and marketing to support future product launches. SEK –154m (–184). Income for the period Events during the first quarter of 2013 Income for the period amounted to SEK 292m (221), corresponding to SEK 1.02 (0.77) in earnings per share, see page 12. February 1. Electrolux acquires its head office in Stockholm Full year of 2012 Electrolux acquires its head office building with associated grounds Net sales for the Electrolux Group in the full year of 2012 amounted at S:t Göransgatan in Stockholm, Sweden. The purchase price is to SEK 109,994m (101,598). Net sales improved by 8.3%, of which SEK 1,145m and possession will take place today February 1, 2013. Electrolux aim is to find an alternative ownership structure for the real 5.5% referred to organic growth, 3.9% to acquisitions and –1.1% to estate as soon as possible. For more information, see page 10. changes in exchange rates. Operating income, improved to SEK 5,182m (3,155), correspond- ing to a margin of 4.7% (3.1). Excluding the non-recurring costs, operating income for 2011 was SEK 3,980m and the operating mar- gin 3.9%. The negative trend on the core markets in Europe has adversely impacted results for the Group’s operations in the region in 2012. However, strong volume growth particularly in North Amer- ica and Latin America, price increases and extensive product launches contributed to the improvement in operating income for 2012. Costs savings and the ongoing global initiatives to reduce complexity and improve competitiveness within manufacturing also contributed to the income trend. Share of sales by business area in the full year 2012 Operating income and margin* Consumer Durables, 95% SEKm % 2,000 10 Europe, Middle East and Africa, 31% North America, 28% EBIT 1,600 8 Latin America, 20% EBIT margin Asia/Pacific, 8% 1,200 6 * Excluding items Small Appliances, 8% affecting compa- rability. 800 4 Professional Products, 5% 400 2 0 Q1 0 Q2 Q3 Q4 Q1 Q2 Q3 Q4 2011 2012
  • 4.
    4 Consolidated results 2012 Business areas Major Appliances Europe, Middle East and Africa SEKm Q4 2012 Q4 2011* 2012 2011* Net sales 9,216 9,749 34,278 34,029 Operating income 343 –202 1,142 709 Operating margin, % 3.7 –2.1 3.3 2.1 Industry shipments of core appliances in Europe, units, year-over-year, % Western Europe –2 –3 –2 –3 Eastern Europe (excluding Turkey) 2 9 3 9 Total Europe –1 1 –1 0 * Operating income for the fourth quarter of 2011 included non-recurring costs in the amount of SEK 690m, see page 12. Market demand for appliances in Europe decreased year-over-year SEKm % in the fourth quarter of 2012. Western Europe declined by 2% as a 800 8 EBIT result of weak demand in Southern Europe, France, the Nordic and EBIT the Benelux countries. Demand in Eastern Europe rose by 2%, 600 6 margin driven mainly by growth in Russia, while demand declined in the rest 400 4 of Eastern Europe. The market conditions in Europe deteriorated throughout the 200 2 quarter. Sales volumes and prices were negatively impacted and sales and operating income declined, compared to 2011 excluding 0 0 Q1 Q2 Q3 Q4 Q1 Q2 Q3 Q4 non-recurring costs. –200 –2 Group sales increased for the full year of 2012 year-over-year in 2011 2012 comparable currencies as a result of higher sales volumes. The –400 –4 launch of the next generation of high-end appliances under the Electrolux brand, The Inspiration Range, across the markets in Europe, has contributed to the sales development. results in Egypt. However, increased manufacturing efficiency and Full-year operating income for the Group’s European business, costs savings made a positive contribution to the operating income. declined, excluding the non-recurring costs for 2011, as a result of lower sales prices, a deterioration in country mix and negative Major Appliances North America SEKm Q4 2012 Q4 2011* 2012 2011* Net sales 7,207 6,271 30,684 27,665 Operating income 367 76 1,561 250 Operating margin, % 5.1 1.2 5.1 0.9 Industry shipments of appliances in the US, units, year-over-year, % Core appliances –2 –4 –2 –4 Microwave ovens and home comfort products 1 –1 1 7 Total Major Appliances 0 –3 0 –1 * Operating income for the fourth quarter of 2011 included non-recurring costs in the amount of SEK 15m, see page 12. SEKm % Market demand in North America for core appliances declined by 800 8 EBIT 2% during the fourth quarter of 2012 compared with the year-earlier period. Market demand for microwave ovens and home comfort 600 6 EBIT margin products, such as room air-conditioners increased by 1%. In total, demand for major appliances was unchanged in the quarter. 400 4 Group sales in North America increased year-over-year in the 200 2 fourth quarter due to significantly higher volumes of core appliances and improvements in price and mix. Sales volumes rose in several of 0 0 Q1 Q2 Q3 Q4 Q1 Q2 Q3 Q4 the product categories in core appliances and the Group continued to capture market share. –200 –2 2011 2012 Operating income for the fourth quarter and the full year improved substantially year-over-year due to higher volumes and improve- ments in price/mix. Increased marketing spend for launches of new entering new distribution channels. In addition, production costs products, primarily related to the Frigidaire brand, impacted operat- increased due to the consolidation of cooking production, with ing income in the fourth quarter. manufacturing being relocated from L’Assomption in Quebec, Can- During the quarter, operations in North America were impacted ada, to Memphis in Tennessee, USA. These activities will to con- by extra costs totaling approximately SEK  100m. Costs for ware- tinue impact operating income in 2013, although to a lesser degree. housing and transportation were temporarily higher as a result of
  • 5.
    5 Consolidated results 2012 Major Appliances Latin America SEKm Q4 2012 Q4 2011 2012 2011 Net sales 6,411 6,003 22,044 17,810 Operating income 657 345 1,590 820 Operating margin, % 10.2 5.7 7.2 4.6 Market demand for core appliances in Latin America is estimated to SEKm % have continued to increase in the fourth quarter of 2012 year-over- 700 15 EBIT year. Demand for core appliances in Brazil continued to grow mainly 12 EBIT as a result of tax incentives for appliances, a program that has been 560 margin partially extended to June 2013. 420 9 Sales for the Latin American operations rose year-over-year in the quarter and the full year 2012 as a result of continued volume growth 280 6 and an improved mix. Sales in other Latin American markets outside Brazil increased to about 32% (25) of total sales in 2012, primarily as 140 3 a result of the acquisition of CTI in Chile. 0 0 Operating income improved significantly for the quarter and for Q1 Q2 Q3 Q4 Q1 Q2 Q3 Q4 the full year and was the highest ever recorded. Strong volume 2011 2012 growth, higher prices and an improved product and customer mix contributed to the strong results. Currency movements continued to negatively impact the results. The successful integration of the acquired company CTI in Chile also contributed to the strong results for 2012. Major Appliances Asia/Pacific SEKm Q4 2012 Q4 2011* 2012 2011* Net sales 2,259 2,180 8,405 7,852 Operating income 211 213 746 736 Operating margin, % 9.3 9.8 8.9 9.4 * Operating income for the fourth quarter of 2011 included non-recurring costs in the amount of SEK 20m, see page 12. Australia and New Zealand SEKm % Market demand for major appliances in Australia is estimated to have 300 15 EBIT declined in the fourth quarter of 2012 year-over-year. Group sales decreased during the fourth quarter and the full year, primarily as a 240 12 EBIT margin result of lower sales volumes and prices and a negative customer mix. 180 9 Operating income declined for the fourth quarter and full-year 2012, mainly due to declining volumes as a result of a weak market. 120 6 Lower sales prices also had a negative impact on operating income. Cost savings and favorable currency movements contributed posi- 60 3 tively to operating income. 0 0 Q1 Q2 Q3 Q4 Q1 Q2 Q3 Q4 Southeast Asia and China 2011 2012 Market demand in Southeast Asia is estimated to have continued showing growth in the fourth quarter of 2012 year-over-year. Demand in China continued to decline, while Electrolux sales in Southeast Asia and China continued to display strong growth and the Group’s market shares are estimated to have grown. Operations in Southeast Asia demonstrate favorable profitability and the Group’s operation in China made a positive contribution to operating income.
  • 6.
    6 Consolidated results 2012 Small Appliances SEKm Q4 2012 Q4 2011* 2012 2011* Net sales 2,689 2,579 9,011 8,359 Operating income 223 237 473 543 Operating margin, % 8.3 9.2 5.2 6.5 * Operating income for the fourth quarter of 2011 included non-recurring costs in the amount of SEK 45m, see page 12. Market demand for vacuum cleaners in Europe and North America SEKm % declined in the fourth quarter compared with the year-earlier period. 300 15 EBIT Group sales increased year-over-year in the fourth quarter, mainly 240 12 EBIT as a result of strong sales growth for small domestic appliances, margin particularly in Asia/Pacific. Higher sales of vacuum cleaners, mainly 180 9 driven by promotion activities in North America around Black Friday, also contributed to the rise in sales and the Group captured market 120 6 shares. 60 3 Operating income for the fourth quarter and the full year 2012 declined year-over-year. The weak market in Europe and the US had 0 0 a negative impact on prices and product mix and operating income Q1 Q2 Q3 Q4 Q1 Q2 Q3 Q4 declined. In addition, increased costs for sourced products 2011 2012 adversely impacted income in 2012. The acquired company Somela (CTI) in Chile had a positive impact on results. Professional Products SEKm Q4 2012 Q4 2011 2012 2011 Net sales 1,402 1,587 5,571 5,882 Operating income 158 191 596 841 Operating margin, % 11.3 12.0 10.7 14.3 Weak market demand in Europe for both professional food-service SEKm % equipment and laundry equipment had a negative impact on the 350 21 EBIT Group’s sales volumes in the fourth quarter. 300 18 EBIT Sales of food-service equipment declined year-over-year due to margin 250 15 lower volumes. Operating income declined for the fourth quarter 200 12 and for the full year 2012 as a result of lower sales volumes and a negative mix. However, price increases and productivity improve- 150 9 ments partly offset the decline in operating income and margins 100 6 were stable. 50 3 Continued investments related to the launch of the new ultra-lux- 0 0 ury product range Electrolux Grand Cuisine negatively impacted Q1 Q2 Q3 Q4 Q1 Q2 Q3 Q4 operating income for the fourth quarter. 2011 2012 Sales of professional laundry equipment declined in the fourth quarter and the full year as a result of lower volumes. Operating income declined but margins remained solid despite lower volumes. Price increases and a positive development of the product mix con- tributed to operating income.
  • 7.
    7 Consolidated results 2012 Cash flow SEKm Q4 2012 Q4 2011 2012 2011 Operations 2,327 1,937 7,665 6,122 Change in operating assets and liabilities 470 463 1,727 1,116 Capital expenditure –1,351 –1,423 –4,613 –4,493 Operating cash flow 1,446 977 4,779 2,745 Acquisitions and divestments of operations – –3,213 –164 –5,556 Financial items paid, net –223 –244 –673 –214 Taxes paid –465 –446 –1,564 –1,625 Cash flow from operations and investments 758 –2,926 2,378 –4,650 Dividend – – –1,868 –1,850 Sale of shares – – 212 – Total cash flow, excluding change in loans and short-term investments 758 –2,926 722 –6,500 Cash flow from operations and investments in the fourth quarter of Cash flow from operations and investments 2012 amounted to SEK 758m (–2,926). SEKm The trend for the cash flow and working capital in the fourth quar- 4,000 ter of 2012 reflects a normal seasonal pattern with increased sales and declining inventories. The Group’s ongoing structural efforts to 3,000 reduce tied-up capital has contributed to the strong cash flow in the 2,000 quarter. 1,000 The operating cash flow for the full year far exceeded the level in the preceding year. 0 Q1 Q2 Q3 Q4 Q1 Q2 Q3 Q4 Payments for the ongoing restructuring and cost-cutting pro- –1,000 grams amounted to approximately SEK –80m in the quarter. Investments in the fourth quarter mainly related to investments within –2,000 manufacturing facilities for new products and production capacity. –3,000 Major projects include the cooker plant in Memphis, Tennessee, in the 2011 2012 US and the new plant for refrigerators and freezers in Rayong, Thailand, for the Southeast Asian markets. The cooker plant in Memphis is receiving investment support from state authorities. Financial position Net borrowings Dec. 31, Dec. 31, SEKm 2012 2011 Borrowings 13,088 14,206 Liquid funds 7,403 7,839 Net borrowings 5,685 6,367 Net debt/equity ratio 0.29 0.31 Equity 19,824 20,644 Equity per share, SEK 69.28 72.52 Return on equity, % 13.3 10.4 Equity/assets ratio, % 28.8 30.1 Net borrowings declined to SEK 5,685m (6,367). Net borrowings Cash flow and change in net borrowings have been positively impacted by the strong cash flow from opera- Net borrowings December 31, 2011 tions and working capital. During 2012, SEK 3,063m in long-term Operations borrowings were amortized and new long-term borrowings were Operating assets and liabilities raised by SEK 2,569m, whereof SEK 2,744m were amortized and Investments SEK 1,512m were raised in the fourth quarter. Acquisitions/divestments Long-term borrowings as of December 31, 2012, including long- Financial net and tax term borrowings with maturities within 12 months, amounted to Dividend SEK  11,005m with average maturity of 3.1 years, compared to Sale of shares SEK  11,669m and 3.0 years at the end of 2011. During 2013 and Other 2014, long-term borrowings in the amount of approximately Net borrowings December 31, 2012 SEK 2,100m will mature. 0 SEKm 00 0 0 00 00 00 00 0 10 0 00 00 00 00 ,0 ,0 ,0 ,0 ,0 4, 6, 2, 8, –6 –8 –4 –2
  • 8.
    8 Consolidated results 2012 Liquid funds as of December 31, 2012, amounted to SEK 7,403m sitions in the second half of 2011 of Olympic Group in Egypt, and CTI (7,839), excluding short-term back-up facilities. Electrolux has two in Chile. Adjusted for items affecting comparability, i.e., restructuring unused committed back-up facilities. One EUR  500m multi-cur- provisions, average net assets amounted to SEK 27,585m (23,354), rency revolving credit facility, approximately SEK 4,200m, maturing corresponding to 25.1% (23.0) of net sales. 2016 with extension options for up to two more years and a credit Working capital as of December 31, 2012, amounted to facility of SEK 3,400m maturing 2017. SEK –6,886m (–5,180), corresponding to –6.0% (–4.6) of annualized net sales. The return on net assets was 15.6% (13.7), and 18.8% Net assets and working capital­ (13.5), excluding items affecting comparability. Average net assets for the period amounted to SEK 26,543m (22,091). Net assets as of December 31, 2012, amounted to SEK 25,509m (27,011). Net assets have been impacted by the acqui- Structural changes Adapting manufacturing footprint in Europe Electrolux is continuing the work to increase production competi- tiveness by optimizing its industrial production system, as commu- nicated at the Capital Markets Day in November 2011. Several activities have been initiated within the business area Major Appliances Europe, Middle East and Africa. Total costs are estimated to approximately SEK 927m, which have been charged against operating income within items affecting comparability in the fourth quarter of 2012. Additional costs of SEK 105m for pensions related to the closure of the cooking facility in L´Assomption, Canada, have been charged to operating income within items affecting comparability in the fourth quarter of 2012. The decision to discontinue production in L´Assomption was made in the fourth quarter of 2010 and costs were charged as items affecting comparability. Relocation of production, items affecting comparability, restructuring measures 2007–2013 Plant closures and cutbacks Closed Authorized closures Estimated closure Torsvik Sweden Compact appliances Q1 2007 L’Assomption Canada Cookers Q4 2013 Nuremberg Germany Dishwashers, washing Q1 2007 machines and dryers Investment Start Adelaide Australia Dishwashers Q2 2007 Washing Fredericia Denmark Cookers Q4 2007 Porcia Italy machines Q4 2010 Adelaide Australia Washing machines Q1 2008 Memphis USA Cookers Q2 2012 Spennymoor UK Cookers Q4 2008 Changsha China Refrigerators Q1 2009 In 2004, Electrolux initiated a restructuring program to make the Group’s production Scandicci Italy Refrigerators Q2 2009 competitive in the long term. This program is in its final phase and has so far yielded annual savings of about SEK 3.2 billion. In 2011, additional measures were pre- St. Petersburg Russia Washing machines Q2 2010 sented to further adapt capacity in mature markets to lower demand, and savings Motala Sweden Cookers Q1 2011 are estimated to approximately SEK 1.6 billion as of 2016. Total costs for the whole program are approximately SEK 12 billion of which approximately, SEK 9 billion has Webster City USA Washing machines Q1 2011 been charged to operating income. About 35% of manufacturing in high-cost areas Alcalà Spain Washing machines Q1 2011 have been moved, and more than 60% of the Group’s household appliances are currently manufactured in low-cost areas that are near rapidly-growing markets for household appliances. Restructuring provisions and write-downs are reported as items affecting comparability within operating income.
  • 9.
    9 Consolidated results 2012 Annual General Meeting 2013 The Annual General Meeting of AB Electrolux will be held on Tues- day, March 26, 2013, at Stockholm Waterfront Congress Centre, Nomination Committee Nils Ericsons Plan 4, Stockholm, Sweden. In accordance with decision by the Annual General Meeting, Electrolux Nomination Committee shall consist of six members. The Proposed dividend members should be one representative of each of the four largest The Board of Directors proposes a dividend for 2012 of SEK 6.50 shareholders in terms of voting rights that wish to participate in the (6.50) per share, for a total dividend payment of approximately committee, together with the Chairman of the Electrolux Board and SEK  1,860m (1,860). The proposed dividend corresponds to one additional Board member. approximately 55% (85) of income for the period, excluding items The members of the Nomination Committee have been appointed affecting comparability. Tuesday, April 2, 2013, is proposed as based on the ownership structure as of August 31, 2012. Petra record date for the dividend. Hedengran, Investor AB, is the Chairman of the committee. The The Group’s goal is for the dividend to correspond to at least 30% other owner representatives are Kaj Thorén, Alecta, Marianne of income for the period, excluding items affecting comparability. Nilsson, Swedbank Robur funds, and Johan Sidenmark, AMF. The Historically, Electrolux dividend rate has been considerably higher committee also includes Marcus Wallenberg and Torben Ballegaard than 30%. Electrolux has a long tradition of high total distribution to Sørensen, Board Chairman and Board member, respectively, of shareholders that includes repurchases and redemptions of shares Electrolux. as well as dividends. The Nomination Committee will prepare proposals for the Annual General Meeting in 2013 regarding Chairman of the Annual General Proposal for resolution on acquisition of own shares Meeting, Board members, Chairman of the Board, remuneration for Electrolux has previously, on the basis of authorizations by the Board members and, to the extent deemed necessary, proposal Annual General Meetings, acquired own shares. The purpose of the regarding amendments of the current instruction for the Nomination repurchase programs has been to adapt the Group’s capital struc- Committee. ture, thus contributing to increased shareholder value and to use Shareholders who wish to submit proposals to the Nomination these shares to finance potential company acquisitions and as a Committee should send an email to nominationcommittee@electro- hedge for the company’s share-related incentive programs. lux.com. The Board of Directors makes the assessment that it continues to be advantageous for the company to be able to adapt the compa- ny’s capital structure, thereby contributing to increased shareholder value, and to continue to be able to use repurchased shares on account of potential company acquisitions and the company’s share-related incentive programs. The Board of Directors proposes the Annual General Meeting 2013 to authorize the Board of Directors, for the period until the next Annual General Meeting, to resolve on acquisitions of shares in the company and that the company may acquire as a maximum so many B shares that, following each acquisition, the company holds at a maximum 10% of all shares issued by the company. As of January 31, 2013, Electrolux holds 22,785,490 B shares in Electrolux, corresponding to 7.4% of the total number of shares in the company.
  • 10.
    10 Consolidated results 2012 Other items Electrolux acquires its head office in Stockholm and Electrolux cannot provide any assurances that the resolution of Electrolux acquires its head office building with associated grounds these types of lawsuits will not have a material adverse effect on its at S:t Göransgatan in Stockholm, Sweden. The purchase price is business or on results of operations in the future. SEK 1,145m and possession will take place today February 1, 2013. Conversion of shares The purpose of the acquisition is to secure access to office space According to AB Electrolux articles of association, owners of Class in central Stockholm. Electrolux has made extensive investments in A shares have the right to have such shares converted to Class B the building for, e.g., the Group’s design and product development shares. Conversion of shares reduces the total number of votes in operations. the company. In 2012, no shareholder requested conversion The transaction has been initiated by the seller NIAM. Electrolux of shares. aim is to find an alternative ownership structure for the real estate as The total number of registered shares in the company amounts to soon as possible. 308,920,308 shares, of which 8,212,725 are Class A shares and 300,707,583 are Class B shares, see table on page 15. The total Asbestos litigation in the US number of votes amounts to 38 283 483. Litigation and claims related to asbestos are pending against the On December 31, 2012, Electrolux owned 22,785,490, shares of Group in the US. Almost all of the cases refer to externally supplied Class B, corresponding to 7.4% of all outstanding shares. components used in industrial products manufactured by discon- tinued operations prior to the early 1970s. The cases involve plain- tiffs who have made substantially identical allegations against other defendants who are not part of the Electrolux Group. As of December 31, 2012, the Group had a total of 2,864 (2,714) cases pending, representing approximately 2,936 (approximately 2,843) plaintiffs. During the fourth quarter of 2012, 273 new cases with 273 plaintiffs were filed and 324 pending cases with approxi- mately 324 plaintiffs were resolved. It is expected that additional lawsuits will be filed against Electrolux. It is not possible to predict the number of future lawsuits. In addition, the outcome of asbestos lawsuits is difficult to predict Risks and uncertainty factors As an international group with a wide geographic spread, Electrolux management, see the 2011 Annual Report on page 70. No signifi- is exposed to a number of business and financial risks. The busi- cant risks other than the risks described there are judged to have ness risks can be divided into strategic, operational and legal risks. occurred. The financial risks are related to such factors as exchange rates, Risks, risk management and risk exposure are described in more interest rates, liquidity, the giving of credit and financial instruments. detail in the Annual Report 2011, Risk management in Electrolux aims to identify, control and www.electrolux.com/annualreport2011. reduce risks. This work begins with the description of risks and risk Press releases 2012 January 10 Electrolux appoints Stefano Marzano to the new role of July 19 Interim report January-June and CEO Chief Design Officer Keith McLoughlin’s comments February 2 Consolidated results 2011 and CEO September 13 Dow Jones Sustainability World Index names Electrolux Keith McLoughlin’s comments Durable Household Products sector leader February 15 Ronnie Leten and Fredrik Persson proposed new Board September 17 Electrolux launches the first and only professional members of Electrolux cooking system for consumer homes February 17 Notice convening the Annual General Meeting of September 26 Nomination committee appointed for Electrolux Annual AB Electrolux General Meeting 2013 March 2 Electrolux Annual Report 2011 is published October 22 Interim report January-September and CEO March 22 Electrolux issues bond loan Keith McLoughlin’s comments March 27 Bulletin from AB Electrolux Annual General Meeting October 26 Floating air cleaning appliance wins Electrolux Design 2012 Lab 2012 April 25 Interim report January-March and CEO November 14 Electrolux hosts Capital Markets Day 2012 Keith McLoughlin’s comments November 20 Electrolux issues bond loan July 3 Electrolux products to be sold at The Home Depot
  • 11.
    11 Consolidated results 2012 Parent Company AB Electrolux Accounting and valuation principles The Parent Company comprises the functions of the Group’s head Electrolux applies International Financial Reporting Standards (IFRS) office, as well as five companies operating on a commission basis as adopted by the European Union. This report has been prepared for AB Electrolux. in accordance with IAS 34, Interim Financial Reporting, and ÅRL, the Net sales for the Parent Company, AB Electrolux, for the full year Swedish Annual Accounts Act and recommendation RFR 2, of 2012 amounted to SEK 6,125m (6,660), of which SEK 2,959m Accounting for legal entities, issued by the Swedish Financial Reporting Board. There are no changes in the Group’s accounting (3,266) referred to sales to Group companies and SEK 3,166m and valuation principles compared with the accounting and valuation (3,394) to external customers. Income after financial items was principles described in Note 1 of the Annual Report 2011. SEK  1,112m (2,904), including dividends from subsidiaries in the amount of SEK 1,259m (2,150). Income for the period amounted to This report has not been audited. SEK 1,119m (2,745). The Parent Company reports group contribu- tion in the income statement. Corresponding changes have been made in the 2011 financial statements. Capital expenditure in tangible and intangible assets was SEK 320m (483). Liquid funds at the end of the period amounted to SEK 1,986m, as against SEK 2,206m at the start of the year. Undistributed earnings in the Parent Company at the end of the period amounted to SEK 15,269m, as against SEK 15,938m at the start of the year. Dividend payment to shareholders for 2011 amounted to SEK 1,860m. The income statement and balance sheet for the Parent Com- pany are presented on page 20. Stockholm, February 1, 2013 Keith McLoughlin President and CEO New pension accounting standards as of 2013 Employee Benefits (Amendments). IAS 19 prescribes the accounting and disclosure by employers for employee benefits. The amended standard requires an entity to regularly determine the present value of defined benefit obligations and the fair value of plan assets and to recognize the net of those values in the finan- cial statements as a net defined benefit liability. The amended standard removes the option to use the corridor approach (see Note 1 in the Annual Report 2011 for a description) presently used by Electrolux. The standard also requires an entity to apply the discount rate on the net defined benefit liability (asset) in order to calculate the net interest expense (income). The standard thereby removes the use of an expected return on the plan assets. All changes in the net defined benefit liability (asset) will be recognized as they occur, as follows: (i) service cost and net interest in profit or loss; and (ii) remeasurement in other comprehensive income. The standard will have the following preliminary impact on the presentation of Electrolux financial results and position: All historical actuarial gains or losses will be included in the measurement of the net defined benefit liability. This will initially increase the liabilities of Electrolux and reduce the equity (after deduction for deferred tax). Future changes in the net defined benefit liability from changes in, e.g., discount rate will be presented in other com- prehensive income. Electrolux will classify the defined benefit liability as a financial liability and present the net interest on the net liability in the financial net. The removal of the expected return will worsen the net interest with the difference between the expected return and the discount rate applied on the plan assets. For 2012, the changes would have increased the net defined benefit liability by approximately SEK 4,800m and reduced retained earn- ings by SEK 4,100m. The modified net interest calculation and the removal of the amortization of the actuarial losses would have decreased the income for the period by approximately SEK 235m. The standard will be applied as of Q1, 2013 with full retrospective application.
  • 12.
    12 Consolidated results 2012 Consolidated income statement SEKm Q4 2012 Q4 2011 2012 2011 Net sales 29,185 28,369 109,994 101,598 Cost of goods sold –22,950 –23,213 –87,741 –82,840 Gross operating income 6,235 5,156 22,253 18,758 Selling expenses –3,214 –2,938 –11,625 –10,821 Administrative expenses –1,397 –1,622 –5,505 –4,972 Other operating income/expenses 4 20 59 190 Items affecting comparability –1,032 –104 –1,032 –138 Operating income 596 512 4,150 3,017 Margin, % 2.0 1.8 3.8 3.0 Financial items, net –154 –184 –672 –237 Income after financial items 442 328 3,478 2,780 Margin, % 1.5 1.2 3.2 2.7 Taxes –150 –107 –879 –716 Income for the period 292 221 2,599 2,064 Available for sale instruments 32 –13 23 –91 Cash-flow hedges 37 –28 34 111 Exchange-rate differences on translation of foreign operations –71 –168 –1,532 –223 Income tax relating to other comprehensive income –5 –6 –2 –104 Other comprehensive income, net of tax –7 –215 –1,477 –307 Total comprehensive income for the period 285 6 1,122 1,757 Income for the period attributable to: Equity holders of the Parent Company 291 220 2,596 2,064 Non-controlling interests 1 1 3 0 Total 292 221 2,599 2,064 Total comprehensive income for the period attributable to: Equity holders of the Parent Company 286 5 1,126 1,752 Non-controlling interests –1 1 –4 5 Total 285 6 1,122 1,757 Earnings per share, SEK 1.02 0.77 9.08 7.25 Diluted, SEK 1.02 0.77 9.06 7.21 Number of shares after buy-backs, million 286.1 284.7 286.1 284.7 Average number of shares after buy-backs, million 286.1 284.7 285.9 284.7 Diluted, million 287.0 286.0 286.6 286.1 Items affecting comparability SEKm Q4 2012 Q4 2011 2012 2011 Restructuring provisions and write-downs Major Appliances, Europe, Middle East and Africa, adapting manufacturing footprint –927 – –927 – Additional pension costs, appliances plant in L’Assomption, Canada –105 – –105 – Appliances plant in Kinston, USA – –104 – –104 Reduced workforce in Major Appliances, Europe – – – –54 Reversal of unused restructuring provisions – – – 20 Total –1,032 –104 –1,032 –138 Non recurring costs in the fourth quarter and full year of 2011 SEKm Q4 2012 Q4 2011 2012 2011 Reduction of staffing levels, Europe – 500 – 500 WEEE related costs, Europe – 190 – 190 Reduction of staffing levels, North America – 15 – 15 Reduction of staffing levels, Asia/Pacific – 20 – 20 Reduction of staffing levels, Small Appliances – 45 – 45 Reduction of staffing levels, Group functions – 55 – 55 Total – 825 – 825 To improve cost efficiency, Electrolux implemented a number of cost-saving activities in the fourth quarter of 2011. Activities to reduce staffing levels in all regions were initiated. Non-recurring costs for these activities were charged to operating income in the amount of SEK 635m. In addition, non-recurring historical WEEE related costs in Hungary amounting to SEK 190m were charged to operating income, see table above. Financial data quarterly and yearly can be downloaded and viewed at www.electrolux.com/ir. There is a graph section where you can view trends as well as compare financial items.
  • 13.
    13 Consolidated results 2012 Consolidated balance sheet SEKm Dec. 31, 2012 Dec. 31, 2011 Assets Property, plant and equipment 16,693 15,613 Goodwill 5,541 6,008 Other intangible assets 5,079 5,146 Investments in associates 16 18 Deferred tax assets 3,306 2,980 Financial assets 552 517 Other non-current assets 2,356 3,036 Total non-current assets 33,543 33,318 Inventories 12,963 11,957 Trade receivables 18,288 19,226 Tax assets 609 666 Derivatives 184 252 Other current assets 3,607 3,662 Short-term investments 123 337 Cash and cash equivalents 6,835 6,966 Total current assets 42,609 43,066 Total assets 76,152 76,384 Equity and liabilities Equity attributable to equity holders of the Parent Company Share capital 1,545 1,545 Other paid-in capital 2,905 2,905 Other reserves –1,146 324 Retained earnings 16,479 15,761 Total equity 19,783 20,535 Non controlling interests 41 109 Total equity 19,824 20,644 Long-term borrowings 10,005 9,639 Deferred tax liabilities 1,148 1,127 Provisions for post-employment benefits 1,736 2,111 Other provisions 4,551 5,300 Total non-current liabilities 17,440 18,177 Accounts payable 20,590 18,490 Tax liabilities 1,287 1,717 Short-term liabilities 11,829 10,497 Short-term borrowings 2,795 4,170 Derivatives 241 324 Other provisions 2,146 2,365 Total current liabilities 38,888 37,563 Total equity and liabilities 76,152 76,384 Contingent liabilities 1,610 1,276 Change in consolidated equity SEKm Dec. 31, 2012 Dec. 31, 2011 Opening balance 20,644 20,613 Total comprehensive income for the period 1,122 1,757 Share-based payment –141 29 Sale of shares 212 – Dividend –1,860 –1,850 Dividend to non-controlling interests – –1 Acquisition of operations –153 96 Total transactions with equity holders –1,942 –1,726 Closing balance 19,824 20,644
  • 14.
    14 Consolidated results 2012 Consolidated cash flow statement SEKm Q4 2012 Q4 2011 2012 2011 Operations Operating income 596 512 4,150 3,017 Depreciation and amortization 796 818 3,251 3,173 Capital gain/loss included in operating income – –33 –52 –207 Restructuring provisions 924 628 457 110 Share-based compensation 11 12 –141 29 Financial items paid, net –223 –244 –673 –214 Taxes paid –465 –446 –1,564 –1,625 Cash flow from operations, excluding change in operating assets and liabilities 1,639 1,247 5,428 4,283 Change in operating assets and liabilities Change in inventories 993 1,649 –1,710 269 Change in trade receivables –435 –403 –119 244 Change in other current assets –113 653 –123 200 Change in accounts payable 296 –232 3,086 1,379 Change in other operating liabilities and provisions –271 –1,204 593 –976 Cash flow from change in operating assets and liabilities 470 463 1,727 1,116 Cash flow from operations 2,109 1,710 7,155 5,399 Investments Acquisition of operations – –3,821 –164 –6,377 Divestment of operations – 608 – 821 Capital expenditure in property, plant and equipment –1,275 –1,025 –4,090 –3,163 Capital expenditure in product development –180 –51 –477 –374 Capital expenditure in software –177 –230 –574 –744 Other1) 281 –117 528 –212 Cash flow from investments –1,351 –4,636 –4,777 –10,049 Cash flow from operations and investments 758 –2,926 2,378 –4,650 Financing Change in short-term investments 366 388 206 1,444 Change in short-term borrowings 148 –519 –325 –619 New long-term borrowings 1,512 – 2,569 3,503 Amortization of long-term borrowings –2,744 –250 –3,063 –1,161 Dividend – – –1,868 –1,850 Sale of shares – – 212 – Cash flow from financing –718 –381 –2,269 1,317 Total cash flow 40 –3,307 109 –3,333 Cash and cash equivalents at beginning of period 6,836 10,226 6,966 10,389 Exchange-rate differences referring to cash and cash equivalents –41 47 –240 –90 Cash and cash equivalents at end of period 6,835 6,966 6,835 6,966 1) Includes grants related to investments of SEK 654m for the full year 2012.
  • 15.
    15 Consolidated results 2012 Key ratios SEKm unless otherwise stated Q4 2012 Q4 2011 2012 2011 Net sales 29,185 28,369 109,994 101,598 Organic growth, % 7.5 0.0 5.5 0.2 Items affecting comparability –1,032 –104 –1,032 –138 Operating income 596 512 4,150 3,017 Margin, % 2.0 1.8 3.8 3.0 Income after financial items 442 328 3,478 2,780 Income for the period 292 221 2,599 2,064 Capital expenditure, property, plant and equipment –1,275 –1,025 –4,090 –3,163 Operating cash flow 1,446 977 4,779 2,745 Earnings per share, SEK1) 1.02 0.77 9.08 7.25 Equity per share, SEK – – 69.28 72.52 Capital-turnover rate, times/year – – 4.1 4.6 Return on net assets, % – – 15.6 13.7 Return on equity, % – – 13.3 10.4 Net borrowings – – 5,685 6,367 Net debt/equity ratio – – 0.29 0.31 Average number of shares excluding shares owned by Electrolux, million 286.1 284.7 285.9 284.7 Average number of employees 61,047 56,912 59,478 52,916 Excluding items affecting comparability Operating income 1,628 616 5,182 3,155 Margin, % 5.6 2.2 4.7 3.1 Earnings per share, SEK¹) 4.12 1.01 12.18 7.55 Capital-turnover rate, times/year – – 4.0 4.3 Return on net assets, % – – 18.8 13.5 Excluding intems affecting comparability and non-recurring costs in 2011. Non-recurring costs in the fourth quarter of 20112) – 825 – 825 Operating income 1,628 1,441 5,182 3,980 Margin, % 5.6 5.1 4.7 3.9 1) Basic, based on average number of shares, excluding shares owned by Electrolux. 2) For more information on non-recurring costs, see page 12. For definitions, see page 22. Shares Shares held Outstanding Outstanding Outstanding Shares held by by other Number of shares A-shares B-shares shares, total Electrolux shareholders Number of shares as of January 1, 2012 8,212,725 300,707,583 308,920,308 24,255,085 284,665,223 Conversion of A-shares into B-shares – – – – – Sale of shares – – – –1,469,595 1,469,595 Number of shares as of December 31 2012 , 8,212,725 300,707,583 308,920,308 22,785,490 286,134,818 As % of total number of shares 7.4%
  • 16.
    16 Consolidated results 2012 Net sales by business area SEKm Q4 2012 Q4 2011 2012 2011 Major Appliances Europe, Middle East and Africa 9,216 9,749 34,278 34,029 Major Appliances North America 7,207 6,271 30,684 27,665 Major Appliances Latin America 6,411 6,003 22,044 17,810 Major Appliances Asia/Pacific 2,259 2,180 8,405 7,852 Small Appliances 2,689 2,579 9,011 8,359 Professional Products 1,402 1,587 5,571 5,882 Other 1 0 1 1 Total 29,185 28,369 109,994 101,598 Operating income by business area SEKm Q4 2012 Q4 2011 2012 2011 Major Appliances Europe, Middle East and Africa 343 –202 1,142 709 Margin, % 3.7 –2.1 3.3 2.1 Major Appliances North America 367 76 1,561 250 Margin, % 5.1 1.2 5.1 0.9 Major Appliances Latin America 657 345 1,590 820 Margin, % 10.2 5.7 7.2 4.6 Major Appliances Asia/Pacific 211 213 746 736 Margin, % 9.3 9.8 8.9 9.4 Small Appliances 223 237 473 543 Margin, % 8.3 9.2 5.2 6.5 Professional Products 158 191 596 841 Margin, % 11.3 12.0 10.7 14.3 Common Group costs, etc. –331 –244 –926 –744 Total Group, excluding items affecting comparability 1,628 616 5,182 3,155 Margin, % 5.6 2.2 4.7 3.1 Items affecting comparability –1,032 –104 –1,032 –138 Operating income 596 512 4,150 3,017 Margin, % 2.0 1.8 3.8 3.0 Change in net sales by business area Q4 2012 2012 in comparable in comparable Year–over–year, % Q4 2012 currencies 2012 currencies Major Appliances Europe, Middle East and Africa –5.5 –2.5 0.7 3.2 Major Appliances North America 14.9 17.7 10.9 6.9 Major Appliances Latin America 6.8 19.2 23.8 34.6 Major Appliances Asia/Pacific 3.6 3.4 7.0 2.9 Small Appliances 4.3 7.5 7.8 8.4 Professional Products –11.7 –8.9 –5.3 –3.9 Total change 2.9 7.5 8.3 9.4 Change in operating income by business area Q4 2012 2012 in comparable in comparable Year–over–year, % Q4 2012 currencies 2012 currencies Major Appliances Europe, Middle East and Africa 269.8 297.6 61.1 71.8 Major Appliances North America 382.9 358.9 524.4 483.5 Major Appliances Latin America 90.4 108.1 93.9 105.0 Major Appliances Asia/Pacific –0.9 –7.5 1.4 –5.8 Small Appliances –5.9 –6.1 –12.9 –9.1 Professional Products –17.3 –13.3 –29.1 –26.9 Total change, excluding items affecting comparability 164.3 172.4 64.2 64.9
  • 17.
    17 Consolidated results 2012 Working capital and net assets % of annualized % of annualized SEKm Dec. 31, 2012 net sales Dec. 31, 2011 net sales Inventories 12,963 11.3 11,957 10.5 Trade receivables 18,288 15.9 19,226 17.0 Accounts payable –20,590 –17.9 –18,490 –16.3 Provisions –8,433 –9,776 Prepaid and accrued income and expenses –7,467 –6,598 Taxes and other assets and liabilities –1,647 –1,499 Working capital –6,886 –6.0 –5,180 –4.6 Property, plant and equipment 16,693 15,613 Goodwill 5,541 6,008 Other non–current assets 8,003 8,717 Deferred tax assets and liabilities 2,158 1,853 Net assets 25,509 22.2 27,011 23.8 Average net assets 26,543 24.1 22,091 21.7 Average net assets, excluding items affecting comparability 27,585 25.1 23,354 23.0 Net assets by business area Assets Equity and liabilities Net assets Dec. 31, Dec. 31, Dec. 31, Dec. 31, Dec. 31, Dec. 31, SEKm 2012 2011 2012 2011 2012 2011 Major Appliances Europe, Middle East and Africa 22,826 24,297 14,418 14,847 8,408 9,450 Major Appliances North America 12,377 10,391 6,645 5,075 5,732 5,316 Major Appliances Latin America 13,337 14,075 6,637 6,607 6,700 7,468 Major Appliances Asia/Pacific 4,933 4,630 2,714 2,590 2,219 2,040 Small Appliances 4,532 4,792 3,013 2,582 1,519 2,210 Professional Products 2,671 2,829 1,775 1,897 896 932 Other1) 8,127 7,414 6,235 6,816 1,892 598 Items affecting comparability –54 117 1,803 1,120 –1,857 –1,003 Total operating assets and liabilities 68,749 68,545 43,240 41,534 25,509 27,011 Liquid funds 7,403 7,839 – – – – Interest-bearing receivables – – – – – – Interest-bearing liabilities – – 13,088 14,206 – – Equity – – 19,824 20,644 – – Total 76,152 76,384 76,152 76,384 – – 1) Includes common Group functions and tax items.
  • 18.
    18 Consolidated results 2012 Net sales and income per quarter Full year Full year SEKm Q1 2011 Q2 2011 Q3 2011 Q4 2011 2011 Q1 2012 Q2 2012 Q3 2012 Q4 2012 2012 Net sales 23,436 24,143 25,650 28,369 101,598 25,875 27,763 27,171 29,185 109,994 Operating income 696 745 1,064 512 3,017 943 1,150 1,461 596 4,150 Margin, % 3.0 3.1 4.1 1.8 3.0 3.6 4.1 5.4 2.0 3.8 Operating income, excluding items affecting comparability 696 745 1,098 616 3,155 943 1,150 1,461 1,628 5,182 Margin, % 3.0 3.1 4.3 2.2 3.1 3.6 4.1 5.4 5.6 4.7 Income after financial items 637 696 1,119 328 2,780 792 993 1,251 442 3,478 Income after financial items, excluding items affecting comparability 637 696 1,153 432 2,918 792 993 1,251 1,474 4,510 Income for the period 457 561 825 221 2,064 559 763 985 292 2,599 Earnings per share, SEK1) 1.61 1.97 2.90 0.77 7.25 1.96 2.67 3.43 1.02 9.08 Earnings per share, SEK, excluding items affecting comparability1) 1.61 1.97 2.96 1.01 7.55 1.96 2.67 3.43 4.12 12.18 Items affecting comparability2) – – –34 –104 –138 – – – –1,032 –1,032 Number of shares after buy-backs, million 284.7 284.7 284.7 284.7 284.7 286.1 286.1 286.1 286.1 286.1 Average number of shares after buy-backs, million 284.7 284.7 284.7 284.7 284.7 285.4 286.1 286.1 286.1 285.9 1) Basic, based on average number of shares, excluding shares owned by Electrolux. 2) Restructuring provisions, write-downs and capital loss on divestments. Net sales and operating income by business area per quarter Full year Full year SEKm Q1 2011 Q2 2011 Q3 2011 Q4 2011 2011 Q1 2012 Q2 2012 Q3 2012 Q4 2012 2012 Major Appliances Europe, Middle East and Africa Net sales 7,656 7,660 8,964 9,749 34,029 8,265 8,216 8,581 9,216 34,278 Operating income 311 156 444 –202 709 281 215 303 343 1,142 Margin, % 4.1 2.0 5.0 –2.1 2.1 3.4 2.6 3.5 3.7 3.3 Major Appliances North America Net sales 6,728 7,544 7,122 6,271 27,665 7,107 8,599 7,771 7,207 30,684 Operating income –71 138 107 76 250 159 512 523 367 1,561 Margin, % –1.1 1.8 1.5 1.2 0.9 2.2 6.0 6.7 5.1 5.1 Major Appliances Latin America Net sales 3,998 3,708 4,101 6,003 17,810 5,149 5,183 5,301 6,411 22,044 Operating income 139 114 222 345 820 278 316 339 657 1,590 Margin, % 3.5 3.1 5.4 5.7 4.6 5.4 6.1 6.4 10.2 7.2 Major Appliances Asia/Pacific Net sales 1,746 1,945 1,981 2,180 7,852 1,841 2,198 2,107 2,259 8,405 Operating income 174 177 172 213 736 155 172 208 211 746 Margin, % 10.0 9.1 8.7 9.8 9.4 8.4 7.8 9.9 9.3 8.9 Small Appliances Net sales 1,930 1,794 2,056 2,579 8,359 2,105 2,105 2,112 2,689 9,011 Operating income 114 23 169 237 543 93 31 126 223 473 Margin, % 5.9 1.3 8.2 9.2 6.5 4.4 1.5 6.0 8.3 5.2 Professional Products Net sales 1,378 1,491 1,426 1,587 5,882 1,408 1,462 1,299 1,402 5,571 Operating income 177 274 199 191 841 132 155 151 158 596 Margin, % 12.8 18.4 14.0 12.0 14.3 9.4 10.6 11.6 11.3 10.7 Other Net sales – 1 – – 1 – – – 1 1 Operating income, common group costs, etc. –148 –137 –215 –244 –744 –155 –251 –189 –331 –926 Total Group, excluding items affecting comparability Net sales 23,436 24,143 25,650 28,369 101,598 25,875 27,763 27,171 29,185 109,994 Operating income 696 745 1,098 616 3,155 943 1,150 1,461 1,628 5,182 Margin, % 3.0 3.1 4.3 2.2 3.1 3.6 4.1 5.4 5.6 4.7 Items affecting comparability – – –34 –104 –138 – – – –1,032 –1,032 Total Group Net sales 23,436 24,143 25,650 28,369 101,598 25,875 27,763 27,171 29,185 109,994 Operating income 696 745 1,064 512 3,017 943 1,150 1,461 596 4,150 Margin, % 3.0 3.1 4.1 1.8 3.0 3.6 4.1 5.4 2.0 3.8
  • 19.
    19 Consolidated results 2012 Exchange rates SEK Dec. 31, 2012 Dec. 31, 2011 AUD, average 6.99 6.72 AUD, end of period 6.76 7.02 BRL, average 3.46 3.88 BRL, end of period 3.19 3.68 CAD, average 6.74 6.55 CAD, end of period 6.55 6.77 EUR, average 8.70 9.02 EUR, end of period 8.58 8.93 GBP, average 10.69 10.36 GBP, end of period 10.48 10.65 HUF, average 0.0300 0.0322 HUF, end of period 0.0295 0.0287 USD, average 6.73 6.48 USD, end of period 6.52 6.90 Acquisitions 2011*) Consideration SEKm Olympic Group CTI Total Cash paid 2,556 3,804 6,360 Total 2,556 3,804 6,360 Recognized amounts of identifiable assets acquired and liabilities assumed at fair value SEKm Property, plant and equipment 555 382 937 Intangible assets 516 1,012 1,528 Inventories 577 734 1,311 Trade receivables 195 763 958 Other current and non-current assets 236 310 546 Accounts payable –223 –189 –412 Other operating liabilities –574 –886 –1,460 Current assets classified as held for sale 537 – 537 Total identifiable net assets acquired 1,819 2,126 3,945 Cash and cash equivalents 34 114 148 Borrowings –723 –499 –1,222 Assumed net debt –689 –385 –1,074 Non-controlling interests –69 –41 –110 Goodwill 1,495 2,104 3,599 Total 2,556 3,804 6,360 *) Olympic Group and CTI are included in Electrolux consolidated accounts as of September and October 2011, respectively. CTI group In Chile, CTI group manufactures refrigerators, stoves, washing machines and heaters, sold under the brands Fensa and Mademsa, and is the leading manufacturer with a volume market share of 36%. CTI group also holds a leading position in Argentina with the GAFA brand and in Chile, Somela is the largest supplier of small domestic appliances. CTI group has 2,200 employees and two manufacturing sites in Chile and one site in Argentina. This acquisition is part of Electrolux strategy to grow in emerg- ing markets and provides significant revenue and growth synergies. The acquisition makes Electrolux the largest supplier of appliances in Chile and Argentina, and further enhances Electrolux position as a leading appliance company in the fast-growing Latin American markets. CTI’s and Somela’s shares are listed on the Santiago Stock Exchange in Chile. Olympic Group Olympic Group is a leading manufacturer of appliances in the Middle East with a volume market share in Egypt of approximately 30%. The company has 7,100 employees and manufactures washing machines, refrigerators, cookers and water heaters. The acquisition is part of Electrolux strategy to grow in emerging markets like Middle East and Africa. Electrolux and Olympic Group have developed a successful commercial partnership in the region for almost 30 years, which today covers technology, supply of components, distribution and brand licensing.
  • 20.
    20 Consolidated results 2012 Parent Company, income statement SEKm Q4 2012 Q4 2011 2012 2011 Net sales 1,676 1,754 6,125 6,660 Cost of goods sold –1,377 –1,311 –4,638 –5,023 Gross operating income 299 443 1,487 1,637 Selling expenses –415 –333 –1,297 –1,109 Administrative expenses –205 113 –469 –295 Other operating income 122 107 293 298 Other operating expenses –37 – –38 –10 Operating income –236 330 –24 521 Financial income 491 1,417 2,137 2,727 Financial expenses –468 –190 –1,001 –344 Financial items, net 23 1,227 1,136 2,383 Income after financial items –213 1,557 1,112 2,904 Appropriations 6 9 16 32 Income before taxes –207 1,566 1,128 2,936 Taxes 46 –65 –9 –191 Income for the period –161 1,501 1,119 2,745 Parent Company, balance sheet SEKm Dec. 31, 2012 Dec. 31, 2011 Assets Non-current assets 33,436 33,247 Current assets 16,008 14,833 Total assets 49,444 48,080 Equity and liabilities Restricted equity 4,562 4,562 Non-restricted equity 15,269 15,938 Total equity 19,831 20,500 Untaxed reserves 581 597 Provisions 1,097 732 Non-current liabilities 9,573 9,220 Current liabilities 18,362 17,031 Total equity and liabilities 49,444 48,080 Pledged assets – 5 Contingent liabilities 1,692 1,428
  • 21.
    21 Consolidated results 2012 Operations by business area yearly SEKm 2012 2011 2010 2009 2008 Major Appliances Europe, Middle East and Africa Net sales 34,278 34,029 36,596 40,500 42,952 Operating income 1,142 709 2,297 1,912 –303 Margin, % 3.3 2.1 6.3 4.7 –0.7 Major Appliances North America Net sales 30,684 27,665 30,969 32,694 29,836 Operating income 1,561 250 1,442 1,299 85 Margin, % 5.1 0.9 4.7 4.0 0.3 Major Appliances Latin America Net sales 22,044 17,810 16,260 13,302 10,485 Operating income 1,590 820 951 809 645 Margin, % 7.2 4.6 5.8 6.1 6.2 Major Appliances Asia/Pacific Net sales 8,405 7,852 7,679 7,037 6,049 Operating income 746 736 793 378 93 Margin, % 8.9 9.4 10.3 5.4 1.5 Small Appliances Net sales 9,011 8,359 8,422 8,464 7,987 Operating income 473 543 802 763 764 Margin, % 5.2 6.5 9.5 9.0 9.6 Professional Products Net sales 5,571 5,882 6,389 7,129 7,427 Operating income 596 841 743 668 774 Margin, % 10.7 14.3 11.6 9.4 10.4 Other Net sales 1 1 11 6 56 Operating income, common Group costs, etc. –926 –744 –534 –507 –515 Total Group, excluding items affecting comparability Net sales 109,994 101,598 106,326 109,132 104,792 Operating income 5,182 3,155 6,494 5,322 1,543 Margin, % 4.7% 3.1 6.1 4.9 1.5 Items affecting comparability –1032 –138 –1,064 –1,561 –355 Total Group, including items affecting comparability Net sales 109,994 101,598 106,326 109,132 104,792 Operating income 4,150 3,017 5,430 3,761 1,188 Margin, % 3.8% 3.0 5.1 3.4 1.1
  • 22.
    22 Consolidated results 2012 Five-year review SEKm unless otherwise stated 2012 2011 2010 2009 2008 Net sales 109,994 101,598 106,326 109,132 104,792 Organic growth, % 5.5 0.2 1.5 –4.8 –0.9 Items affecting comparability –1,032 –138 –1,064 –1,561 –355 Operating income 4,150 3,017 5,430 3,761 1,188 Margin, % 3.8 3.0 5.1 3.4 1.1 Income after financial items 3,478 2,780 5,306 3,484 653 Income for the period 2,599 2,064 3,997 2,607 366 Capital expenditure, property, plant and equipment 4,090 3,163 3,221 2,223 3,158 Operating cash flow 4,779 2,745 4,587 6,603 2,875 Earnings per share, SEK 9.08 7.25 14.04 9.18 1.29 Equity per share, SEK 69 73 72 66 58 Dividend per share, SEK 6.501) 6.50 6.50 4.00 – Capital-turnover rate, times/year 4.1 4.6 5.4 5.6 5.1 Return on net assets, % 15.6 13.7 27.8 19.4 5.8 Return on equity, % 13.3 10.4 20.6 14.9 2.4 Net borrowings 5,685 6,367 –709 665 4,556 Net debt/equity ratio 0.29 0.31 –0.03 0.04 0.28 Average number of shares excluding shares owned by Electrolux, million 285.9 284.7 284.6 284.0 283.1 Average number of employees 59,478 52,916 51,544 50,633 55,177 Excluding items affecting comparability Operating income 5,182 3,155 6,494 5,322 1,543 Margin, % 4.7 3.1 6.1 4.9 1.5 Earnings per share, SEK 12.2 7.55 16.65 13.56 2.32 Capital-turnover rate, times/year 4.0 4.3 5.1 5.4 4.9 Return on net assets, % 18.8 13.5 31.0 26.2 7.2 1) Proposed by the Board of Directors. Financial goals over a business cycle The financial goals set by Electrolux aim to strengthen the Group’s Financial goals leading, global position in the industry and assist in generating a • Operating margin of 6% healthy total yield for Electrolux shareholders. The objective is growth with consistent profitability. The key ratios exclude items • Capital-turnover rate 4% affecting comparability. • Return on net assets 20% • Average annual growth 4% Definitions Capital indicators Other key ratios Annualized sales Organic growth In computation of key ratios where capital is related to net sales, the Sales growth, adjusted for acquisitions, divestments and changes in latter are annualized and converted at year-end-exchange rates and exchange rates. adjusted for acquired and divested operations. Operating cash flow Net assets Cash flow from operations and investments excluding financial Total assets exclusive of liquid funds and interest-bearing financial items paid, taxes paid and acquisitions and divestment of opera- receivables less operating liabilities, non-interest-bearing provisions tions. and deferred tax liabilities. Earnings per share Working capital Income for the period divided by the average number of shares after Current assets exclusive of liquid funds and interest-bearing finan- buy-backs. cial receivables less operating liabilities and non-interest-bearing provisions. Operating margin Operating income expressed as a percentage of net sales. Total borrowings Total borrowings consist of interest-bearing liabilities, fair-value Return on equity derivatives, accrued interest expenses and prepaid interest Income for the period expressed as a percentage of average equity. income, and trade receivables with recourse. Return on net assets Net borrowings Operating income expressed as a percentage of average net assets. Total borrowings less liquid funds. Capital-turnover rate Net debt/equity ratio Net sales in relation to average net assets. Net borrowings in relation to equity. Equity/assets ratio Equity as a percentage of total assets less liquid funds.
  • 23.
    23 Consolidated results 2012 President and CEO Keith McLoughlin’s ­ omments on the c fourth-quarter and full-year results 2012 Today’s press release is available on the Electrolux website www.electrolux.com/ir Telephone conference A telephone conference is held at 15.00 CET on February 1, 2013. The conference is chaired by Keith McLoughlin, President and CEO of Electrolux. Mr. McLoughlin is accompanied by Tomas  Eliasson, CFO, and Peter Nyquist, SVP Investor Relations and Financial Information. A slide presentation on the fourth-quarter results and full-year of 2012 will be available on the Electrolux website www.electrolux.com/ir Details for participation by telephone are as follows: Participants in Sweden should call +46 (0)8 505 598 53 Calendar 2013 Participants in UK/Europe should call +44 (0)20 3043 2436 Financial reports 2013 Participants in US should call +1 866 458 4087 Interim report January – March April 25 Interim report January – June July 19 You can also listen to the presentation at Interim report January – September October 25 www.electrolux.com/interim-report-webcast Annual Report 2012 For further information Available at the Group’s website Week 10 Peter Nyquist, Senior Vice President, Head of Investor Relations Annual General Meeting 2013 March 26 and Financial Information: +46 (0)8 738 60 03. The Annual General Meeting will be held at Stockholm Water- Financial information from Electrolux is available at front Congress Centre, situated at Nils Ericsons Plan 4 in www.electrolux.com/ir Stockholm, Sweden. Factors affecting forward-looking statements This report contains “forward-looking” statements within the meaning of the US Private Securities Litigation Reform Act of 1995. Such statements include, among others, the financial goals and targets of Electrolux for future periods and future business and financial plans. These statements are based on current expectations and are subject to risks and uncertainties that could cause actual results to differ materially due to a variety of factors. These factors include, but may not be limited to the following; consumer demand and market condi- tions in the geographical areas and industries in which Electrolux operates, effects of currency fluctuations, competitive pressures to reduce prices, significant loss of business from major retailers, the success in developing new products and marketing initiatives, devel- opments in product liability litigation, progress in achieving operational and capital efficiency goals, the success in identifying growth opportunities and acquisition candidates and the integration of these opportunities with existing businesses, progress in achieving struc- tural and supply-chain reorganization goals. Electrolux discloses the information provided herein pursuant to the Securities Market Act and/or the Financial Instruments Trading Act. The information was submitted for publication at 08.00 CET on February 1, 2013. AB ELECTROLUX (PUBL) Postal address Media hotline Investor Relations E-mail SE-105 45 Stockholm, Sweden +46 8 657 65 07 +46 8 738 60 03 ir@electrolux.se Visiting address Telefax Website Reg. No. S:t Göransgatan 143 +46 8 738 74 61 www.electrolux.com 556009-4178