Download to read offline


![19
Interim report January - June 2009
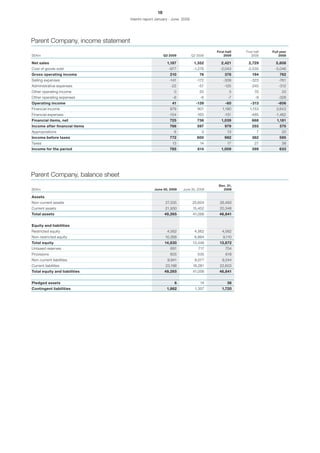
Five-year review
Including Husqvarna
2008 2007 2006 2005 2005 2004¹)
Net sales, SEKm 104,792 104,732 103,848 100,701 129,469 120,651
Operating income, SEKm 1,188 4,475 4,033 1,044 3,942 4,807
Margin, % 1.1 4.3 3.9 1.0 3.0 4.0
Margin, excluding items affecting
comparability, % 1.5 4.6 4.4 4.0 5.4 5.6
Income after financial items, SEKm 653 4,035 3,825 494 3,215 4,452
Margin, % 0.6 3.9 3.7 0.5 2.5 3.7
Margin, excluding items
affecting comparability, % 1.0 4.2 4.2 3.4 4.8 5.3
Income for the period, SEKm 366 2,925 2,648 -142 1,763 3,259
Earnings per share, SEK 1.29 10.41 9.17 -0.49 6.05 10.92
Average number of shares after
buy-backs, million 283.1 281.0 288.8 291.4 291.4 298.3
Dividend, SEK - 4.25 4.00 7.50 7.50 7.00
Value creation, SEKm -1,040 2,053 2,202 1,305 2,913 3,054
Return on equity, % 2.4 20.3 18.7 - 7.0 13.1
Return on net assets, % 5.8 21.7 23.2 5.4 13.0 17.5
Net debt/equity ratio 0.28 0.29 -0.02 - 0.11 0.05
Capital expenditure, SEKm 3,158 3,430 3,152 3,654 4,765 4,515
Average number of employees 55,177 56,898 55,471 57,842 69,523 72,382
1) Restated to comply with IFRS, except for IAS 39. If IAS 39 had been applied in 2004, the volatility in income,
net borrowings and equity would most probably have been higher.
Definitions
Capital indicators Other key ratios
Annualized sales Earnings per share
In computation of key ratios where capital is related to net sales, the Income for the period divided by the average number of shares after
latter are annualized and converted at year-end-exchange rates buy-backs.
and adjusted for acquired and divested operations.
Operating margin
Net assets Operating income expressed as a percentage of net sales.
Total assets exclusive of liquid funds and interest-bearing financial
receivables less operating liabilities, non-interest-bearing provisions EBITDA
and deferred tax liabilities. Operating income before depreciation and amortization.
Working capital Value creation
Current assets exclusive of liquid funds and interest-bearing finan- Operating income excluding items affecting comparability less the
cial receivables less operating liabilities and non-interest-bearing weighted average cost of capital (WACC) on average net assets
provisions. excluding items affecting comparability: [(Net sales – operating
costs = operating income) – (WACC x average net assets)]. The
Net borrowings WACC rate before tax for 2009, 2008 and 2007 is calculated at 12%
Total borrowings less liquid funds. compared to 11% for 2006, 12% for 2005 and 2004.
Net debt/equity ratio Return on equity
Net borrowings in relation to equity. Income for the period expressed as a percentage of average
equity.
Equity/assets ratio
Equity as a percentage of total assets less liquid funds. Return on net assets
Operating income expressed as a percentage of average net
assets.](https://image.slidesharecdn.com/electrolux-2009-q2-report-100712103242-phpapp02/85/Electrolux-Interim-Report-Q2-2009-19-320.jpg)

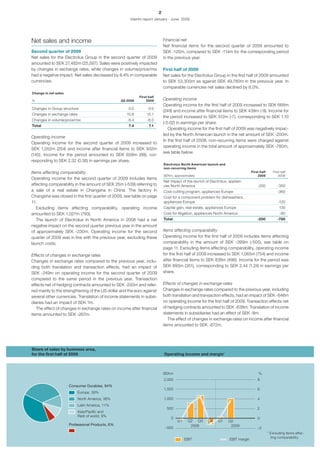
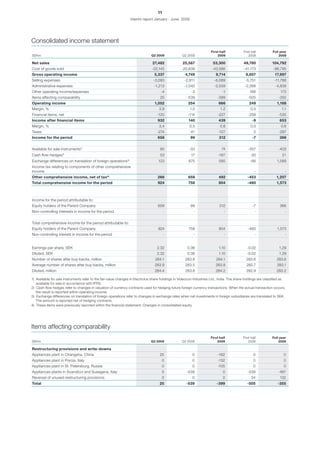
Electrolux reported net sales of SEK 27,482 million for Q2 2009, an increase from SEK 25,587 million in Q2 2008, despite a decline of 8.4% in comparable currencies due to market downturns. Operating income improved to SEK 1,052 million compared to SEK 254 million the previous year, driven by cost reductions and lower raw material costs. The company continues to gain market share in North America and Latin America, although overall market demand for appliances remains weak.


