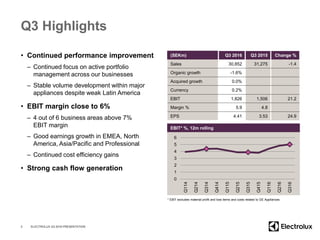
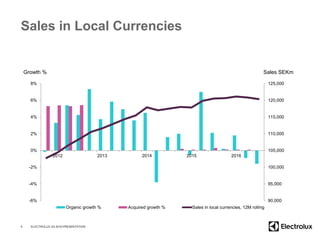
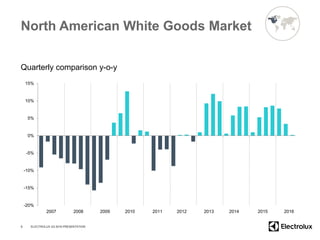
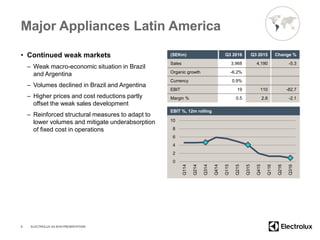
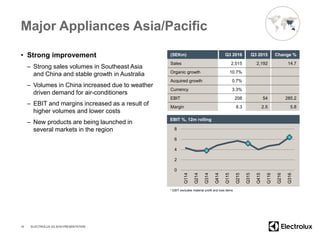
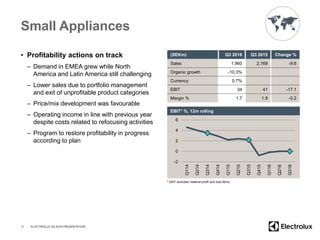
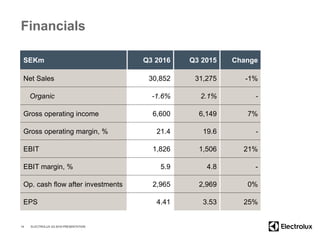
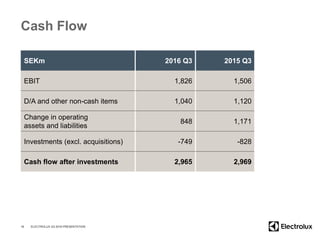
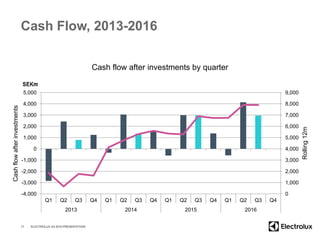
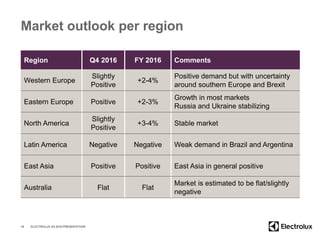
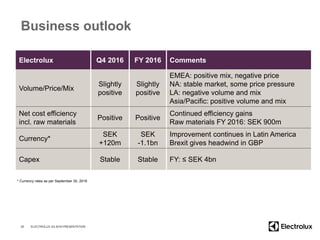
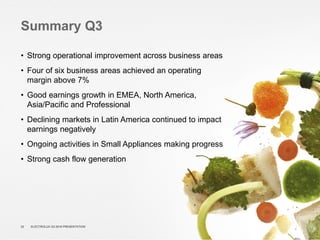
Q3-16 Results
Jonas Samuelson, President and CEO
Anna Ohlsson-Leijon, CFO
(SEKm) Q3 2016 Q3 2015 Change %
Sales 30,852 31,275 -1.4
Organic growth -1.6%
Acquired growth 0.0%
Currency 0.2%
EBIT 1,826 1,506 21.2
Margin % 5.9 4.8
EPS 4.41 3.53 24.9
Q3 Highlights
• Continued performance improvement
– Continued focus on active portfolio
management across our businesses
– Stable volume development within major
appliances despite weak Latin America
• EBIT margin close to 6%
– 4 out of 6 business areas above 7%
EBIT margin
– Good earnings growth in EMEA, North
America, Asia/Pacific and Professional
– Continued cost efficiency gains
• Strong cash flow generation
2
EBIT* %, 12m rolling
0
1
2
3
4
5
6
Q114
Q214
Q314
Q414
Q115
Q215
Q315
Q415
Q116
Q216
Q316
ELECTROLUX Q3 2016 PRESENTATION
* EBIT excludes material profit and loss items and costs related to GE Appliances
Market Highlights
• New launch of the AEG brand at IFA
– The redesigned AEG visual identity unveiled
at the IFA appliance fair in Berlin
– Premium AEG products within kitchen and
laundry introduced in Europe and Asia
– Focus on Consumer Benefits and Taste & Care
• New premium Frigidaire dish models
introduced in North America
– Refresh of two of the best-selling dish products
in the market
– The line-up allows us to gain market share with
Frigidaire and drive mix with Frigidaire Gallery
3 ELECTROLUX Q3 2016 PRESENTATION
Sales in Local Currencies
90,000
95,000
100,000
105,000
110,000
115,000
120,000
125,000
-6%
-4%
-2%
0%
2%
4%
6%
8%
2012 2013 2014 2015 2016
Sales SEKmGrowth %
Organic growth % Acquired growth % Sales in local currencies, 12M rolling
4 ELECTROLUX Q3 2016 PRESENTATION
Major Appliances EMEA
• Profitable growth, higher margins
– Positive market demand in the Nordics,
Germany, Eastern Europe and Benelux
partly offset by weak UK, Italy and Spain
– Organic growth driven by volume growth
and positive mix
– Built-in kitchen and laundry continue to
perform well
– EBIT margin of 7% in the quarter and
above 6.7% in the last 12 months, due to
organic contribution and cost efficiency
– New AEG kitchen and laundry range
launched in Germany and adjacent
markets
5
(SEKm) Q3 2016 Q3 2015 Change %
Sales 9,579 9,540 0.4
Organic growth 2.1%
Currency -1.7%
EBIT 680 605 12.4
Margin % 7.1 6.3 0.8
0
2
4
6
8
Q114
Q214
Q314
Q414
Q115
Q215
Q315
Q415
Q116
Q216
Q316
EBIT %, 12m rolling
ELECTROLUX Q3 2016 PRESENTATION
* EBIT excludes material profit and loss items
European White Goods Market
Total Europe, quarterly comparison y-o-y
-20%
-15%
-10%
-5%
0%
5%
10%
6
2007 2008 2009 2010 2011 2012 2013
W. Eur. +1 +1 -1 -5 -4 -4 -5 -8 -9 -9 -4 -2 +1 0 0 0 -2 -2 -3 -3 -2 -4 -2 -2 -3 0 -1 -1 +2 +1 +1 +3 +4 +4 +5 +3 +3% +5% 0
E. Eur. +14 +5 +5 +10 +6 +5 +4 -15 -31 -30 -26 -17 -7 +1 +5 +13 +13 +12 +7 +9 +5 +3 +2 +2 +3 +2 +1 -2 +4 +1 -4 +1 -10 -23 -15 -24 0 +4% +2%
2014 2015
ELECTROLUX Q3 2016 PRESENTATION
2016
Major Appliances North America
• Continued focus on profitability
– Branded sales growth in overall flat market
– Sales declined mainly due to lower
volumes under private labels
– Sales of air-conditioners up
– Price pressure in the market, driven by
increased promotional activity
– Earnings growth driven by focus on
margins, improved efficiency and
lower raw material costs
7
(SEKm) Q3 2016 Q3 2015 Change %
Sales 11,189 11,610 -3.6
Organic growth -4.6%
Currency 1.0%
EBIT 824 743 10.9
Margin % 7.4 6.4 1.0
0
2
4
6
8
10
Q114
Q214
Q314
Q414
Q115
Q215
Q315
Q415
Q116
Q216
Q316
EBIT* %, 12m rolling
ELECTROLUX Q3 2016 PRESENTATION
* EBIT excludes costs related to GE Appliances
North American White Goods Market
Quarterly comparison y-o-y
-20%
-15%
-10%
-5%
0%
5%
10%
15%
8
2007 2008 2009 2010 2011 2012 2013 2014 2015 2016
ELECTROLUX Q3 2016 PRESENTATION
Major Appliances Latin America
• Continued weak markets
– Weak macro-economic situation in Brazil
and Argentina
– Volumes declined in Brazil and Argentina
– Higher prices and cost reductions partly
offset the weak sales development
– Reinforced structural measures to adapt to
lower volumes and mitigate underabsorption
of fixed cost in operations
9
(SEKm) Q3 2016 Q3 2015 Change %
Sales 3,968 4,190 -5.3
Organic growth -6.2%
Currency 0.9%
EBIT 19 110 -82.7
Margin % 0.5 2.6 -2.1
0
2
4
6
8
10
Q114
Q214
Q314
Q414
Q115
Q215
Q315
Q415
Q116
Q216
Q316
EBIT %, 12m rolling
ELECTROLUX Q3 2016 PRESENTATION
Major Appliances Asia/Pacific
• Strong improvement
– Strong sales volumes in Southeast Asia
and China and stable growth in Australia
– Volumes in China increased due to weather
driven demand for air-conditioners
– EBIT and margins increased as a result of
higher volumes and lower costs
– New products are being launched in
several markets in the region
10
(SEKm) Q3 2016 Q3 2015 Change %
Sales 2,515 2,192 14.7
Organic growth 10.7%
Acquired growth 0.7%
Currency 3.3%
EBIT 208 54 285.2
Margin 8.3 2.5 5.8
0
2
4
6
8
Q114
Q214
Q314
Q414
Q115
Q215
Q315
Q415
Q116
Q216
Q316
EBIT %, 12m rolling
ELECTROLUX Q3 2016 PRESENTATION
* EBIT excludes material profit and loss items
Small Appliances
• Profitability actions on track
– Demand in EMEA grew while North
America and Latin America still challenging
– Lower sales due to portfolio management
and exit of unprofitable product categories
– Price/mix development was favourable
– Operating income in line with previous year
despite costs related to refocusing activities
– Program to restore profitability in progress
according to plan
11
(SEKm) Q3 2016 Q3 2015 Change %
Sales 1,960 2,169 -9.6
Organic growth -10.3%
Currency 0.7%
EBIT 34 41 -17.1
Margin % 1.7 1.9 -0.2
-2
0
2
4
6
Q114
Q214
Q314
Q414
Q115
Q215
Q315
Q415
Q116
Q216
Q316
EBIT* %, 12m rolling
ELECTROLUX Q3 2016 PRESENTATION
* EBIT excludes material profit and loss items
Professional Products
• Solid growth and profitability
– Good organic growth development
– Volumes increased in Western Europe,
the US and Japan
– Continued good performance in both
food-services and laundry equipment
– EBIT and margins improved due to higher
sales volumes and efficiency
– Continued investments in new products
and segments
12
(SEKm) Q3 2016 Q3 2015 Change %
Sales 1,641 1,574 4.3
Organic growth 4.0%
Acquired growth 0.0%
Currency 0.3%
EBIT 234 212 10.4
Margin % 14.3 13.5 0.8
0
2
4
6
8
10
12
14
16
Q114
Q214
Q314
Q414
Q115
Q215
Q315
Q415
Q116
Q216
Q316
EBIT %, 12m rolling
ELECTROLUX Q3 2016 PRESENTATION
Financials
Q3-16
Anna Ohlsson-Leijon, CFO
Financials
SEKm Q3 2016 Q3 2015 Change
Net Sales 30,852 31,275 -1%
Organic -1.6% 2.1% -
Gross operating income 6,600 6,149 7%
Gross operating margin, % 21.4 19.6 -
EBIT 1,826 1,506 21%
EBIT margin, % 5.9 4.8 -
Op. cash flow after investments 2,965 2,969 0%
EPS 4.41 3.53 25%
14 ELECTROLUX Q3 2016 PRESENTATION
Sales and EBIT Bridge
SEKm Q3
Net Cost
Efficiency
Currency* Acq Other** Q3 2016
Net Sales 31,275 -517 78 15 30,852
Growth -1.6% 0.2% 0.0% -1.4%
EBIT 1,506 -211 439 -120 0 213 1,826
EBIT % 4.8% -40.8% -2.7% 5.9%
Accretion -0.6% 1.4% -0.4% 0.0% 0.7%
15 ELECTROLUX Q3 2016 PRESENTATION
* Currency includes SEK -32m of currency translation effect on EBIT. ** Other includes GE transaction + integration costs and China inventory write-down in Q3 2015
Cash Flow
SEKm 2016 Q3 2015 Q3
EBIT 1,826 1,506
D/A and other non-cash items 1,040 1,120
Change in operating
assets and liabilities
848 1,171
Investments (excl. acquisitions) -749 -828
Cash flow after investments 2,965 2,969
16 ELECTROLUX Q3 2016 PRESENTATION
Cash Flow, 2013-2016
Cash flow after investments by quarter
17 ELECTROLUX Q3 2016 PRESENTATION
Cashflowafterinvestments
Rolling12m
0
1,000
2,000
3,000
4,000
5,000
6,000
7,000
8,000
9,000
-4,000
-3,000
-2,000
-1,000
0
1,000
2,000
3,000
4,000
5,000
Q1 Q2 Q3 Q4 Q1 Q2 Q3 Q4 Q1 Q2 Q3 Q4 Q1 Q2 Q3 Q4
2013 2014 2015 2016
Outlook
and
Summary
Jonas Samuelson, President and CEO
Anna Ohlsson-Leijon, CFO
Market outlook per region
Region Q4 2016 FY 2016 Comments
Western Europe
Slightly
Positive
+2-4%
Positive demand but with uncertainty
around southern Europe and Brexit
Eastern Europe Positive +2-3%
Growth in most markets
Russia and Ukraine stabilizing
North America
Slightly
Positive
+3-4% Stable market
Latin America Negative Negative Weak demand in Brazil and Argentina
East Asia Positive Positive East Asia in general positive
Australia Flat Flat
Market is estimated to be flat/slightly
negative
19 ELECTROLUX Q3 2016 PRESENTATION
Business outlook
Electrolux Q4 2016 FY 2016 Comments
Volume/Price/Mix
Slightly
positive
Slightly
positive
EMEA: positive mix, negative price
NA: stable market, some price pressure
LA: negative volume and mix
Asia/Pacific: positive volume and mix
Net cost efficiency
incl. raw materials
Positive Positive
Continued efficiency gains
Raw materials FY 2016: SEK 900m
Currency*
SEK
+120m
SEK
-1.1bn
Improvement continues in Latin America
Brexit gives headwind in GBP
Capex Stable Stable FY: ≤ SEK 4bn
20 ELECTROLUX Q3 2016 PRESENTATION
* Currency rates as per September 30, 2016
21
Summary Q3
• Strong operational improvement across business areas
• Four of six business areas achieved an operating
margin above 7%
• Good earnings growth in EMEA, North America,
Asia/Pacific and Professional
• Declining markets in Latin America continued to impact
earnings negatively
• Ongoing activities in Small Appliances making progress
• Strong cash flow generation
22 ELECTROLUX Q3 2016 PRESENTATION
Factors affecting forward-looking
statements
Factors affecting forward-looking statements
This presentation contains “forward-looking” statements within the meaning of the US Private
Securities Litigation Reform Act of 1995. Such statements include, among others, the financial goals
and targets of Electrolux for future periods and future business and financial plans. These statements
are based on current expectations and are subject to risks and uncertainties that could cause actual
results to differ materially due to a variety of factors. These factors include, but may not be limited to
the following: consumer demand and market conditions in the geographical areas and industries in
which Electrolux operates, effects of currency fluctuations, competitive pressures to reduce prices,
significant loss of business from major retailers, the success in developing new products and
marketing initiatives, developments in product liability litigation, progress in achieving operational and
capital efficiency goals, the success in identifying growth opportunities and acquisition candidates
and the integration of these opportunities with existing businesses, progress in achieving structural
and supply-chain reorganization goals.
23 ELECTROLUX Q3 2016 PRESENTATION

Electrolux Interim Report Q3 2016 - Presentation

  • 1.
    Q3-16 Results Jonas Samuelson,President and CEO Anna Ohlsson-Leijon, CFO
  • 2.
    (SEKm) Q3 2016Q3 2015 Change % Sales 30,852 31,275 -1.4 Organic growth -1.6% Acquired growth 0.0% Currency 0.2% EBIT 1,826 1,506 21.2 Margin % 5.9 4.8 EPS 4.41 3.53 24.9 Q3 Highlights • Continued performance improvement – Continued focus on active portfolio management across our businesses – Stable volume development within major appliances despite weak Latin America • EBIT margin close to 6% – 4 out of 6 business areas above 7% EBIT margin – Good earnings growth in EMEA, North America, Asia/Pacific and Professional – Continued cost efficiency gains • Strong cash flow generation 2 EBIT* %, 12m rolling 0 1 2 3 4 5 6 Q114 Q214 Q314 Q414 Q115 Q215 Q315 Q415 Q116 Q216 Q316 ELECTROLUX Q3 2016 PRESENTATION * EBIT excludes material profit and loss items and costs related to GE Appliances
  • 3.
    Market Highlights • Newlaunch of the AEG brand at IFA – The redesigned AEG visual identity unveiled at the IFA appliance fair in Berlin – Premium AEG products within kitchen and laundry introduced in Europe and Asia – Focus on Consumer Benefits and Taste & Care • New premium Frigidaire dish models introduced in North America – Refresh of two of the best-selling dish products in the market – The line-up allows us to gain market share with Frigidaire and drive mix with Frigidaire Gallery 3 ELECTROLUX Q3 2016 PRESENTATION
  • 4.
    Sales in LocalCurrencies 90,000 95,000 100,000 105,000 110,000 115,000 120,000 125,000 -6% -4% -2% 0% 2% 4% 6% 8% 2012 2013 2014 2015 2016 Sales SEKmGrowth % Organic growth % Acquired growth % Sales in local currencies, 12M rolling 4 ELECTROLUX Q3 2016 PRESENTATION
  • 5.
    Major Appliances EMEA •Profitable growth, higher margins – Positive market demand in the Nordics, Germany, Eastern Europe and Benelux partly offset by weak UK, Italy and Spain – Organic growth driven by volume growth and positive mix – Built-in kitchen and laundry continue to perform well – EBIT margin of 7% in the quarter and above 6.7% in the last 12 months, due to organic contribution and cost efficiency – New AEG kitchen and laundry range launched in Germany and adjacent markets 5 (SEKm) Q3 2016 Q3 2015 Change % Sales 9,579 9,540 0.4 Organic growth 2.1% Currency -1.7% EBIT 680 605 12.4 Margin % 7.1 6.3 0.8 0 2 4 6 8 Q114 Q214 Q314 Q414 Q115 Q215 Q315 Q415 Q116 Q216 Q316 EBIT %, 12m rolling ELECTROLUX Q3 2016 PRESENTATION * EBIT excludes material profit and loss items
  • 6.
    European White GoodsMarket Total Europe, quarterly comparison y-o-y -20% -15% -10% -5% 0% 5% 10% 6 2007 2008 2009 2010 2011 2012 2013 W. Eur. +1 +1 -1 -5 -4 -4 -5 -8 -9 -9 -4 -2 +1 0 0 0 -2 -2 -3 -3 -2 -4 -2 -2 -3 0 -1 -1 +2 +1 +1 +3 +4 +4 +5 +3 +3% +5% 0 E. Eur. +14 +5 +5 +10 +6 +5 +4 -15 -31 -30 -26 -17 -7 +1 +5 +13 +13 +12 +7 +9 +5 +3 +2 +2 +3 +2 +1 -2 +4 +1 -4 +1 -10 -23 -15 -24 0 +4% +2% 2014 2015 ELECTROLUX Q3 2016 PRESENTATION 2016
  • 7.
    Major Appliances NorthAmerica • Continued focus on profitability – Branded sales growth in overall flat market – Sales declined mainly due to lower volumes under private labels – Sales of air-conditioners up – Price pressure in the market, driven by increased promotional activity – Earnings growth driven by focus on margins, improved efficiency and lower raw material costs 7 (SEKm) Q3 2016 Q3 2015 Change % Sales 11,189 11,610 -3.6 Organic growth -4.6% Currency 1.0% EBIT 824 743 10.9 Margin % 7.4 6.4 1.0 0 2 4 6 8 10 Q114 Q214 Q314 Q414 Q115 Q215 Q315 Q415 Q116 Q216 Q316 EBIT* %, 12m rolling ELECTROLUX Q3 2016 PRESENTATION * EBIT excludes costs related to GE Appliances
  • 8.
    North American WhiteGoods Market Quarterly comparison y-o-y -20% -15% -10% -5% 0% 5% 10% 15% 8 2007 2008 2009 2010 2011 2012 2013 2014 2015 2016 ELECTROLUX Q3 2016 PRESENTATION
  • 9.
    Major Appliances LatinAmerica • Continued weak markets – Weak macro-economic situation in Brazil and Argentina – Volumes declined in Brazil and Argentina – Higher prices and cost reductions partly offset the weak sales development – Reinforced structural measures to adapt to lower volumes and mitigate underabsorption of fixed cost in operations 9 (SEKm) Q3 2016 Q3 2015 Change % Sales 3,968 4,190 -5.3 Organic growth -6.2% Currency 0.9% EBIT 19 110 -82.7 Margin % 0.5 2.6 -2.1 0 2 4 6 8 10 Q114 Q214 Q314 Q414 Q115 Q215 Q315 Q415 Q116 Q216 Q316 EBIT %, 12m rolling ELECTROLUX Q3 2016 PRESENTATION
  • 10.
    Major Appliances Asia/Pacific •Strong improvement – Strong sales volumes in Southeast Asia and China and stable growth in Australia – Volumes in China increased due to weather driven demand for air-conditioners – EBIT and margins increased as a result of higher volumes and lower costs – New products are being launched in several markets in the region 10 (SEKm) Q3 2016 Q3 2015 Change % Sales 2,515 2,192 14.7 Organic growth 10.7% Acquired growth 0.7% Currency 3.3% EBIT 208 54 285.2 Margin 8.3 2.5 5.8 0 2 4 6 8 Q114 Q214 Q314 Q414 Q115 Q215 Q315 Q415 Q116 Q216 Q316 EBIT %, 12m rolling ELECTROLUX Q3 2016 PRESENTATION * EBIT excludes material profit and loss items
  • 11.
    Small Appliances • Profitabilityactions on track – Demand in EMEA grew while North America and Latin America still challenging – Lower sales due to portfolio management and exit of unprofitable product categories – Price/mix development was favourable – Operating income in line with previous year despite costs related to refocusing activities – Program to restore profitability in progress according to plan 11 (SEKm) Q3 2016 Q3 2015 Change % Sales 1,960 2,169 -9.6 Organic growth -10.3% Currency 0.7% EBIT 34 41 -17.1 Margin % 1.7 1.9 -0.2 -2 0 2 4 6 Q114 Q214 Q314 Q414 Q115 Q215 Q315 Q415 Q116 Q216 Q316 EBIT* %, 12m rolling ELECTROLUX Q3 2016 PRESENTATION * EBIT excludes material profit and loss items
  • 12.
    Professional Products • Solidgrowth and profitability – Good organic growth development – Volumes increased in Western Europe, the US and Japan – Continued good performance in both food-services and laundry equipment – EBIT and margins improved due to higher sales volumes and efficiency – Continued investments in new products and segments 12 (SEKm) Q3 2016 Q3 2015 Change % Sales 1,641 1,574 4.3 Organic growth 4.0% Acquired growth 0.0% Currency 0.3% EBIT 234 212 10.4 Margin % 14.3 13.5 0.8 0 2 4 6 8 10 12 14 16 Q114 Q214 Q314 Q414 Q115 Q215 Q315 Q415 Q116 Q216 Q316 EBIT %, 12m rolling ELECTROLUX Q3 2016 PRESENTATION
  • 13.
  • 14.
    Financials SEKm Q3 2016Q3 2015 Change Net Sales 30,852 31,275 -1% Organic -1.6% 2.1% - Gross operating income 6,600 6,149 7% Gross operating margin, % 21.4 19.6 - EBIT 1,826 1,506 21% EBIT margin, % 5.9 4.8 - Op. cash flow after investments 2,965 2,969 0% EPS 4.41 3.53 25% 14 ELECTROLUX Q3 2016 PRESENTATION
  • 15.
    Sales and EBITBridge SEKm Q3 Net Cost Efficiency Currency* Acq Other** Q3 2016 Net Sales 31,275 -517 78 15 30,852 Growth -1.6% 0.2% 0.0% -1.4% EBIT 1,506 -211 439 -120 0 213 1,826 EBIT % 4.8% -40.8% -2.7% 5.9% Accretion -0.6% 1.4% -0.4% 0.0% 0.7% 15 ELECTROLUX Q3 2016 PRESENTATION * Currency includes SEK -32m of currency translation effect on EBIT. ** Other includes GE transaction + integration costs and China inventory write-down in Q3 2015
  • 16.
    Cash Flow SEKm 2016Q3 2015 Q3 EBIT 1,826 1,506 D/A and other non-cash items 1,040 1,120 Change in operating assets and liabilities 848 1,171 Investments (excl. acquisitions) -749 -828 Cash flow after investments 2,965 2,969 16 ELECTROLUX Q3 2016 PRESENTATION
  • 17.
    Cash Flow, 2013-2016 Cashflow after investments by quarter 17 ELECTROLUX Q3 2016 PRESENTATION Cashflowafterinvestments Rolling12m 0 1,000 2,000 3,000 4,000 5,000 6,000 7,000 8,000 9,000 -4,000 -3,000 -2,000 -1,000 0 1,000 2,000 3,000 4,000 5,000 Q1 Q2 Q3 Q4 Q1 Q2 Q3 Q4 Q1 Q2 Q3 Q4 Q1 Q2 Q3 Q4 2013 2014 2015 2016
  • 18.
    Outlook and Summary Jonas Samuelson, Presidentand CEO Anna Ohlsson-Leijon, CFO
  • 19.
    Market outlook perregion Region Q4 2016 FY 2016 Comments Western Europe Slightly Positive +2-4% Positive demand but with uncertainty around southern Europe and Brexit Eastern Europe Positive +2-3% Growth in most markets Russia and Ukraine stabilizing North America Slightly Positive +3-4% Stable market Latin America Negative Negative Weak demand in Brazil and Argentina East Asia Positive Positive East Asia in general positive Australia Flat Flat Market is estimated to be flat/slightly negative 19 ELECTROLUX Q3 2016 PRESENTATION
  • 20.
    Business outlook Electrolux Q42016 FY 2016 Comments Volume/Price/Mix Slightly positive Slightly positive EMEA: positive mix, negative price NA: stable market, some price pressure LA: negative volume and mix Asia/Pacific: positive volume and mix Net cost efficiency incl. raw materials Positive Positive Continued efficiency gains Raw materials FY 2016: SEK 900m Currency* SEK +120m SEK -1.1bn Improvement continues in Latin America Brexit gives headwind in GBP Capex Stable Stable FY: ≤ SEK 4bn 20 ELECTROLUX Q3 2016 PRESENTATION * Currency rates as per September 30, 2016
  • 21.
  • 22.
    Summary Q3 • Strongoperational improvement across business areas • Four of six business areas achieved an operating margin above 7% • Good earnings growth in EMEA, North America, Asia/Pacific and Professional • Declining markets in Latin America continued to impact earnings negatively • Ongoing activities in Small Appliances making progress • Strong cash flow generation 22 ELECTROLUX Q3 2016 PRESENTATION
  • 23.
    Factors affecting forward-looking statements Factorsaffecting forward-looking statements This presentation contains “forward-looking” statements within the meaning of the US Private Securities Litigation Reform Act of 1995. Such statements include, among others, the financial goals and targets of Electrolux for future periods and future business and financial plans. These statements are based on current expectations and are subject to risks and uncertainties that could cause actual results to differ materially due to a variety of factors. These factors include, but may not be limited to the following: consumer demand and market conditions in the geographical areas and industries in which Electrolux operates, effects of currency fluctuations, competitive pressures to reduce prices, significant loss of business from major retailers, the success in developing new products and marketing initiatives, developments in product liability litigation, progress in achieving operational and capital efficiency goals, the success in identifying growth opportunities and acquisition candidates and the integration of these opportunities with existing businesses, progress in achieving structural and supply-chain reorganization goals. 23 ELECTROLUX Q3 2016 PRESENTATION