Download as PDF, PPTX
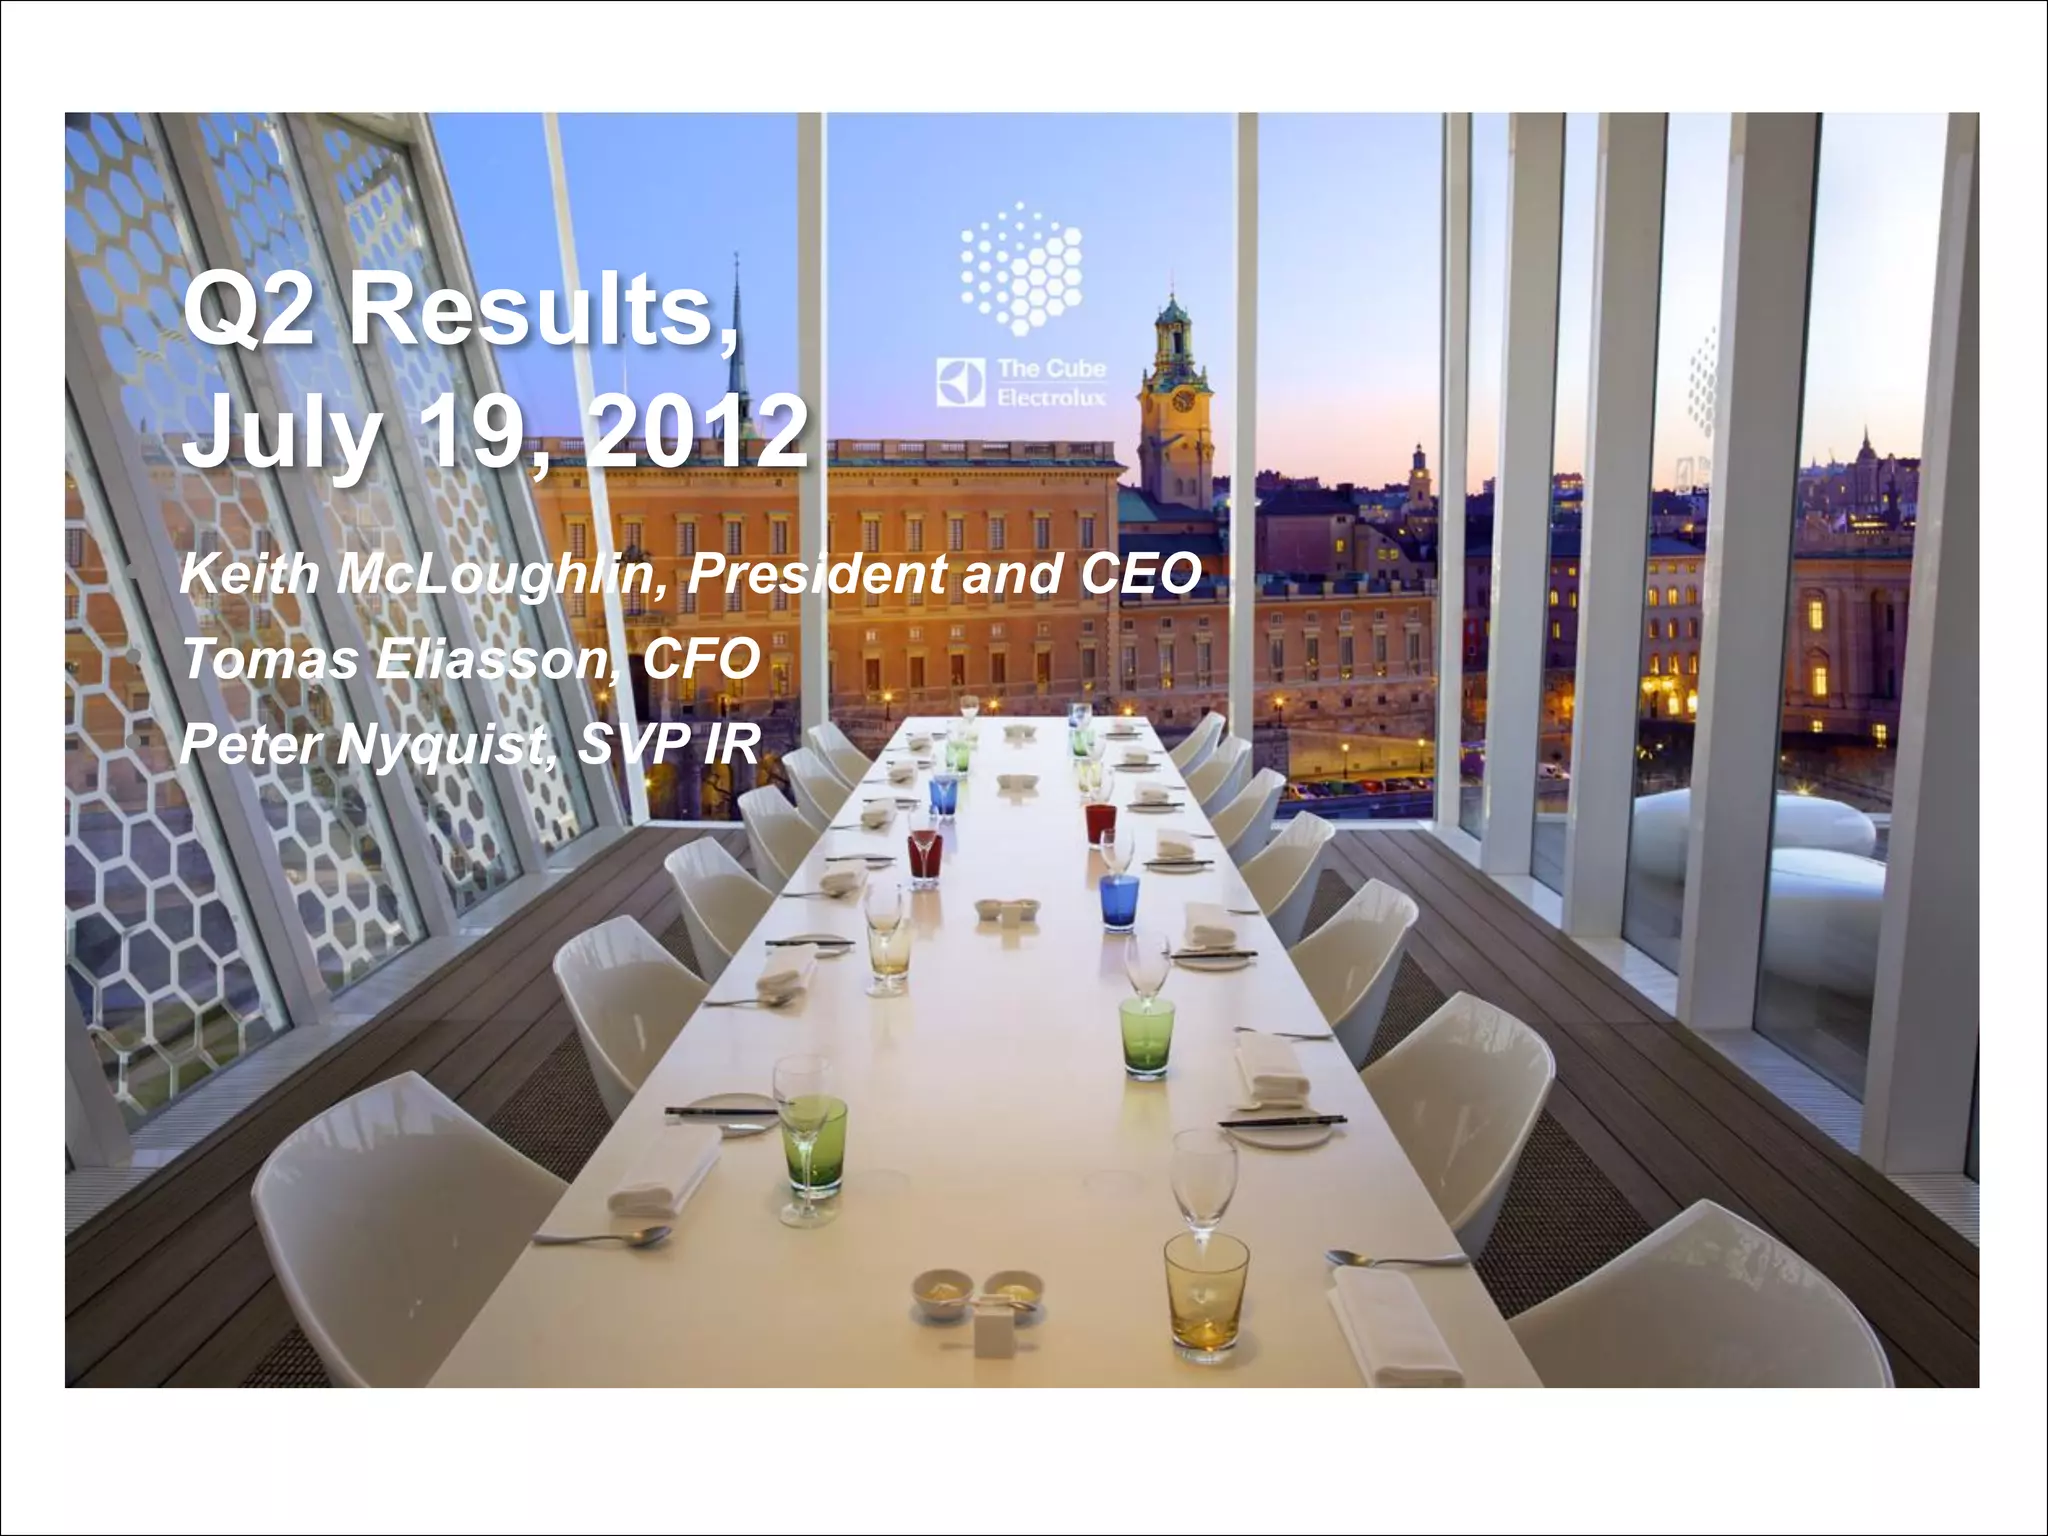
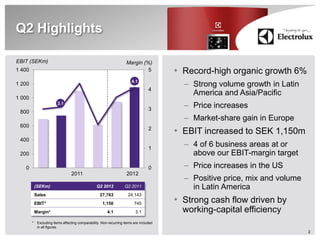
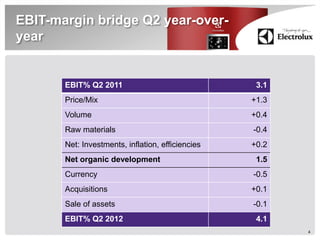
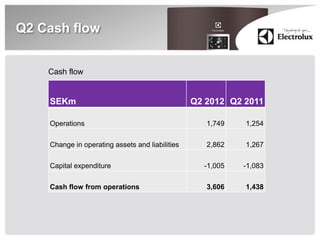
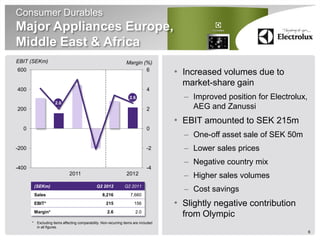
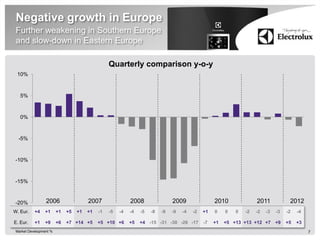


In Q2 2012, Electrolux reported a record-high organic growth of 6%, with EBIT increasing to SEK 1,150 million and a margin of 4.1%. Strong sales growth was observed in Latin America and North America, despite challenges in Europe, where negative trends persisted. Overall, the transformation initiatives are yielding positive results, driving improved cash flow and operational efficiency.


