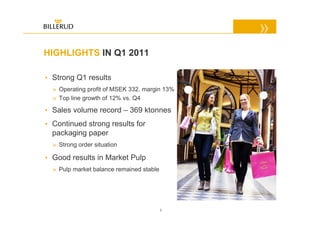
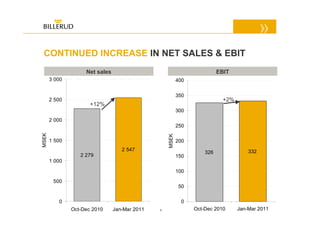
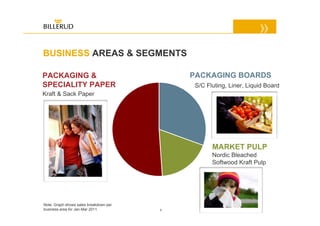
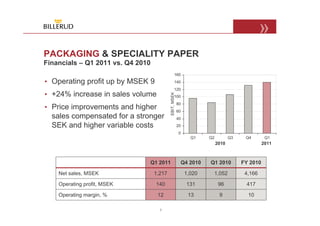
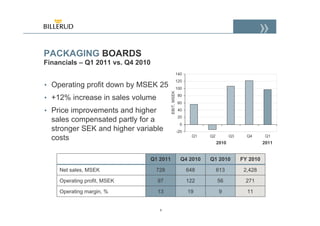
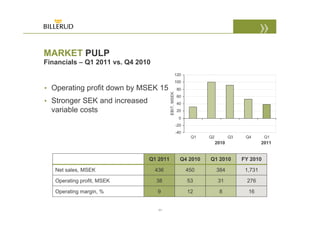
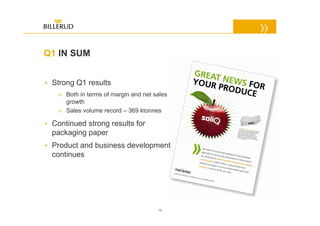
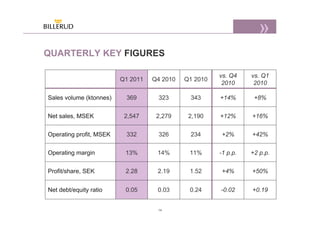
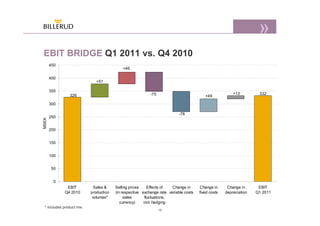
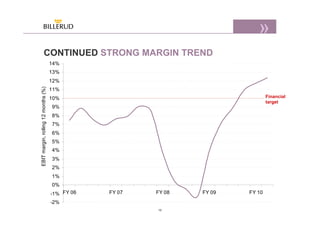
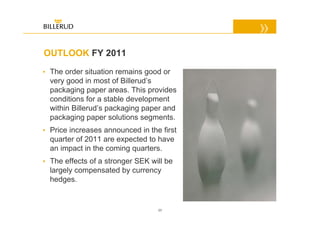
BillerudKorsnäs reported strong first quarter results for 2011, with operating profit of MSEK 332, a 12% increase in net sales, and record sales volume of 369 ktonnes. Packaging paper continued strong results due to good order situation and price increases. Market pulp results were lower due to stronger SEK and higher costs, though price increases were announced. Outlook remains positive with announced price increases expected to impact future quarters and currency hedges compensating SEK strength.
Highlights of the second quarter of 2011. Net sales amounted to SEK 24,143m (27,311) and income for the period was SEK 561m (1,028) or SEK 1.97 (3.61) per share. Net sales decreased by 2% in comparable currencies mainly as a result of lower prices.
Highlights of the second quarter of 2009. Net sales amounted to SEK 27,482m (25,587) and income for the period to SEK 658m (99), or SEK 2.32 (0.36) per share. Net sales declined by 8.4%, in comparable currencies, due to continued sharp market downturn in Electrolux main markets.
Highlights of the first quarter of 2011. Net sales amounted to SEK 23,436m (25,133) and income for the period was SEK 457m (911), or SEK 1.61 (3.20) per share. Net sales increased by 1% in comparable currencies.
Highlights of the fourth quarter of 2010. Net sales amounted to SEK 27,556m (28,215) and income for the period was SEK 677m (664), or SEK 2.38 (2.34) per share. Net sales increased by 1.6% in comparable currencies.
Highlights of the fourth quarter of 2009. Net sales amounted to SEK 28,215m (28,663) and income for the period was SEK 664m (-474), or SEK 2.34 (-1.68) per share. Net sales declined by 1% in comparable currencies, due to continued weak markets.
The Nest Report (1Q 2012), an honest look at what's happening in the New River Valley real estate market.
Created and published by Nest Realty Group, www.NestRealty.com. Licensed real estate brokers in the Commonwealth of Virginia.
Highlights of the first quarter of 2010. Net sales amounted to SEK 25,133m (25,818) and income for the period was SEK 911m (-346), or SEK 3.20 (-1.22) per share. Net sales increased by 4.1% in comparable currencies, due to higher sales volumes.
Highlights of the third quarter of 2012. Net sales amounted to SEK 27,171m (25,650) and income for the period was SEK 985m (825), or SEK 3.43 (2.90) per share. Net sales improved by 5.9%, of which 4.6% was organic growth, 5.1% acquisitions and –3.8% changes in exchange rates.
Highlights of the second quarter of 2010. Net sales amounted to SEK 27,311m (27,482) and income for the period was SEK 1,028m (658), or SEK 3.61 (2.32) per share. Net sales increased by 2.8% in comparable currencies, due to higher sales volumes.
Highlights of the first quarter of 2012. Net sales amounted to SEK 25,875m (23,436) and income for the period was SEK 559m (457), or SEK 1.96 (1.61) per share. Net sales improved by 10.4%, of which 3.5% was organic growth. The acquisitions of CTI and Olympic Group impacted sales by 5.8%.
USDA Loans in California: A Comprehensive Overview.pptxmarketing367770
USDA Loans in California: A Comprehensive Overview
If you're dreaming of owning a home in California's rural or suburban areas, a USDA loan might be the perfect solution. The U.S. Department of Agriculture (USDA) offers these loans to help low-to-moderate-income individuals and families achieve homeownership.
Key Features of USDA Loans:
Zero Down Payment: USDA loans require no down payment, making homeownership more accessible.
Competitive Interest Rates: These loans often come with lower interest rates compared to conventional loans.
Flexible Credit Requirements: USDA loans have more lenient credit score requirements, helping those with less-than-perfect credit.
Guaranteed Loan Program: The USDA guarantees a portion of the loan, reducing risk for lenders and expanding borrowing options.
Eligibility Criteria:
Location: The property must be located in a USDA-designated rural or suburban area. Many areas in California qualify.
Income Limits: Applicants must meet income guidelines, which vary by region and household size.
Primary Residence: The home must be used as the borrower's primary residence.
Application Process:
Find a USDA-Approved Lender: Not all lenders offer USDA loans, so it's essential to choose one approved by the USDA.
Pre-Qualification: Determine your eligibility and the amount you can borrow.
Property Search: Look for properties in eligible rural or suburban areas.
Loan Application: Submit your application, including financial and personal information.
Processing and Approval: The lender and USDA will review your application. If approved, you can proceed to closing.
USDA loans are an excellent option for those looking to buy a home in California's rural and suburban areas. With no down payment and flexible requirements, these loans make homeownership more attainable for many families. Explore your eligibility today and take the first step toward owning your dream home.
2. Elemental Economics - Mineral demand.pdfNeal Brewster
After this second you should be able to: Explain the main determinants of demand for any mineral product, and their relative importance; recognise and explain how demand for any product is likely to change with economic activity; recognise and explain the roles of technology and relative prices in influencing demand; be able to explain the differences between the rates of growth of demand for different products.
US Economic Outlook - Being Decided - M Capital Group August 2021.pdfpchutichetpong
The U.S. economy is continuing its impressive recovery from the COVID-19 pandemic and not slowing down despite re-occurring bumps. The U.S. savings rate reached its highest ever recorded level at 34% in April 2020 and Americans seem ready to spend. The sectors that had been hurt the most by the pandemic specifically reduced consumer spending, like retail, leisure, hospitality, and travel, are now experiencing massive growth in revenue and job openings.
Could this growth lead to a “Roaring Twenties”? As quickly as the U.S. economy contracted, experiencing a 9.1% drop in economic output relative to the business cycle in Q2 2020, the largest in recorded history, it has rebounded beyond expectations. This surprising growth seems to be fueled by the U.S. government’s aggressive fiscal and monetary policies, and an increase in consumer spending as mobility restrictions are lifted. Unemployment rates between June 2020 and June 2021 decreased by 5.2%, while the demand for labor is increasing, coupled with increasing wages to incentivize Americans to rejoin the labor force. Schools and businesses are expected to fully reopen soon. In parallel, vaccination rates across the country and the world continue to rise, with full vaccination rates of 50% and 14.8% respectively.
However, it is not completely smooth sailing from here. According to M Capital Group, the main risks that threaten the continued growth of the U.S. economy are inflation, unsettled trade relations, and another wave of Covid-19 mutations that could shut down the world again. Have we learned from the past year of COVID-19 and adapted our economy accordingly?
“In order for the U.S. economy to continue growing, whether there is another wave or not, the U.S. needs to focus on diversifying supply chains, supporting business investment, and maintaining consumer spending,” says Grace Feeley, a research analyst at M Capital Group.
While the economic indicators are positive, the risks are coming closer to manifesting and threatening such growth. The new variants spreading throughout the world, Delta, Lambda, and Gamma, are vaccine-resistant and muddy the predictions made about the economy and health of the country. These variants bring back the feeling of uncertainty that has wreaked havoc not only on the stock market but the mindset of people around the world. MCG provides unique insight on how to mitigate these risks to possibly ensure a bright economic future.
Turin Startup Ecosystem 2024 - Ricerca sulle Startup e il Sistema dell'Innov...Quotidiano Piemontese
Turin Startup Ecosystem 2024
Una ricerca de il Club degli Investitori, in collaborazione con ToTeM Torino Tech Map e con il supporto della ESCP Business School e di Growth Capital
1. Elemental Economics - Introduction to mining.pdfNeal Brewster
After this first you should: Understand the nature of mining; have an awareness of the industry’s boundaries, corporate structure and size; appreciation the complex motivations and objectives of the industries’ various participants; know how mineral reserves are defined and estimated, and how they evolve over time.
How to get verified on Coinbase Account?_.docxBuy bitget
t's important to note that buying verified Coinbase accounts is not recommended and may violate Coinbase's terms of service. Instead of searching to "buy verified Coinbase accounts," follow the proper steps to verify your own account to ensure compliance and security.
when will pi network coin be available on crypto exchange.DOT TECH
There is no set date for when Pi coins will enter the market.
However, the developers are working hard to get them released as soon as possible.
Once they are available, users will be able to exchange other cryptocurrencies for Pi coins on designated exchanges.
But for now the only way to sell your pi coins is through verified pi vendor.
Here is the telegram contact of my personal pi vendor
@Pi_vendor_247
The European Unemployment Puzzle: implications from population agingGRAPE
We study the link between the evolving age structure of the working population and unemployment. We build a large new Keynesian OLG model with a realistic age structure, labor market frictions, sticky prices, and aggregate shocks. Once calibrated to the European economy, we quantify the extent to which demographic changes over the last three decades have contributed to the decline of the unemployment rate. Our findings yield important implications for the future evolution of unemployment given the anticipated further aging of the working population in Europe. We also quantify the implications for optimal monetary policy: lowering inflation volatility becomes less costly in terms of GDP and unemployment volatility, which hints that optimal monetary policy may be more hawkish in an aging society. Finally, our results also propose a partial reversal of the European-US unemployment puzzle due to the fact that the share of young workers is expected to remain robust in the US.
Yes of course, you can easily start mining pi network coin today and sell to legit pi vendors in the United States.
Here the telegram contact of my personal vendor.
@Pi_vendor_247
#pi network #pi coins #legit #passive income
#US
how to sell pi coins effectively (from 50 - 100k pi)DOT TECH
Anywhere in the world, including Africa, America, and Europe, you can sell Pi Network Coins online and receive cash through online payment options.
Pi has not yet been launched on any exchange because we are currently using the confined Mainnet. The planned launch date for Pi is June 28, 2026.
Reselling to investors who want to hold until the mainnet launch in 2026 is currently the sole way to sell.
Consequently, right now. All you need to do is select the right pi network provider.
Who is a pi merchant?
An individual who buys coins from miners on the pi network and resells them to investors hoping to hang onto them until the mainnet is launched is known as a pi merchant.
debuts.
I'll provide you the Telegram username
@Pi_vendor_247
how can I sell pi coins after successfully completing KYCDOT TECH
Pi coins is not launched yet in any exchange 💱 this means it's not swappable, the current pi displaying on coin market cap is the iou version of pi. And you can learn all about that on my previous post.
RIGHT NOW THE ONLY WAY you can sell pi coins is through verified pi merchants. A pi merchant is someone who buys pi coins and resell them to exchanges and crypto whales. Looking forward to hold massive quantities of pi coins before the mainnet launch.
This is because pi network is not doing any pre-sale or ico offerings, the only way to get my coins is from buying from miners. So a merchant facilitates the transactions between the miners and these exchanges holding pi.
I and my friends has sold more than 6000 pi coins successfully with this method. I will be happy to share the contact of my personal pi merchant. The one i trade with, if you have your own merchant you can trade with them. For those who are new.
Message: @Pi_vendor_247 on telegram.
I wouldn't advise you selling all percentage of the pi coins. Leave at least a before so its a win win during open mainnet. Have a nice day pioneers ♥️
#kyc #mainnet #picoins #pi #sellpi #piwallet
#pinetwork
3. HIGHLIGHTS IN Q1 2011
• Strong Q1 results
» Operating profit of MSEK 332, margin 13%
» Top line growth of 12% vs. Q4
• Sales volume record – 369 ktonnes
• Continued strong results for
packaging paper
» Strong order situation
• Good results in Market Pulp
» Pulp market balance remained stable
3
5. BUSINESS AREAS & SEGMENTS
PACKAGING & PACKAGING BOARDS
SPECIALITY PAPER S/C Fluting, Liner, Liquid Board
Kraft & Sack Paper
MARKET PULP
Nordic Bleached
Softwood Kraft Pulp
Note: Graph shows sales breakdown per
business area for Jan-Mar 2011. 5
6. PACKAGING & SPECIALITY PAPER
Market situation in Q1 2011
• Continued very good order
situation for the season for sack
paper and slightly below Q1 2010
Consumer
level for kraft paper Building &
construction
• Increased price level in local
currency for most products vs. Q4
Food
• Additional price increases have
been announced
6
7. PACKAGING & SPECIALITY PAPER
Financials – Q1 2011 vs. Q4 2010
160
• Operating profit up by MSEK 9 140
120
• +24% increase in sales volume
EBIT, MSEK
100
• Price improvements and higher
80
60
sales compensated for a stronger 40
SEK and higher variable costs 20
0
Q1 Q2 Q3 Q4 Q1
2010 2011
Q1 2011 Q4 2010 Q1 2010 FY 2010
Net sales, MSEK 1,217 1,020 1,052 4,166
Operating profit, MSEK 140 131 96 417
Operating margin, % 12 13 9 10
7
8. PACKAGING BOARDS
Market situation in Q1 2011
• Continued stable order situation
throughout the quarter
• Increased price level in local
currency for most products vs. Q4
• Additional price increases have
been announced
8
9. PACKAGING BOARDS
Financials – Q1 2011 vs. Q4 2010
140
• Operating profit down by MSEK 25
120
100
EBIT, MSEK
• +12% increase in sales volume 80
60
• Price improvements and higher 40
20
sales compensated partly for a
0
stronger SEK and higher variable -20
Q1 Q2 Q3 Q4 Q1
costs
2010 2011
Q1 2011 Q4 2010 Q1 2010 FY 2010
Net sales, MSEK 728 648 613 2,428
Operating profit, MSEK 97 122 56 271
Operating margin, % 13 19 9 11
9
10. MARKET PULP
Market situation in Q1 2011
• Pulp market balance remained
stable
• Price level in Europe increased
during Q1
» 980 USD/ton end of Q1 vs. 950
USD/ton end of Q4
• An additional price increase has
been announced
» 1 010 USD/ton as of April 1, 2011
10
12. Q1 IN SUM
• Strong Q1 results
» Both in terms of margin and net sales
growth
» Sales volume record – 369 ktonnes
• Continued strong results for
packaging paper
• Product and business development
continues
12
17. CASH FLOW
MSEK
Q1 2011 Q1 2010
Operating surplus, etc 481 379
Change in working capital, etc. -301 -88
Net financial items, taxes, etc. -181 -30
Cash flow from operating activities -1 261
Current net investments -82 -50
Business combinations - -
Operating cash flow -83 211
Dividend - -
Other items, not affecting cash flow -6 -35
Change in net debt 1) -89 176
1) Minus equals increase in net debt
17
20. CURRENCY EFFECT OF A STRONGER SEK
Average rate Average rate Spot rate vs. vs.
Q1 2011 Q4 2010 17 Apr 2011 Q4 2010 17 Apr 2011
EUR 8.87 9.22 8.96 -4% -1%
USD 6.48 6.78 6.26 -4% +4%
GBP 10.39 10.72 10.21 -3% +2%
How do we manage?
• Price increases
• Hedging in the short-run
• Customer and market mix to some extent
20
21. CURRENCY SITUATION
• Profit effect of net flow hedging
MSEK 99 for Q1 2011 (117) Apr-Jun Jul-Sep Oct-Dec Jan-Mar Total 12
2011 2011 2011 2012 months
• Market value of outstanding
Average Average Average Average Average
contracts not relating to hedged hedged hedged hedged hedged
accounts receivables was currency currency currency currency currency
rates rates rates rates rates
MSEK 132 (as of 31/3-11) (hedged net (hedged net (hedged net (hedged net (hedged net
• Hedge level 12 months
flows) flows) flows) flows) flows)
forward:
9.23 9.19 9.41 9.48 9.31
EUR 58%
(85%) (51%) (49%) (47%) (58%)
7.12 7.50 6.82 6.60 7.14
USD 50%
(88%) (61%) (35%) (16%) (50%)
10.79 10.77 10.74 10.64 10.76
GBP 51%
(86%) (54%) (42%) (20%) (51%)
Note: Data in table and graph are as of 31 March 2011
21
23. OUTLOOK FY 2011
• The order situation remains good or
very good in most of Billerud’s
packaging paper areas. This provides
conditions for a stable development
within Billerud’s packaging paper and
packaging paper solutions segments.
• Price increases announced in the first
quarter of 2011 are expected to have
an impact in the coming quarters.
• The effects of a stronger SEK will be
largely compensated by currency
hedges.
23