Download as PDF, PPTX
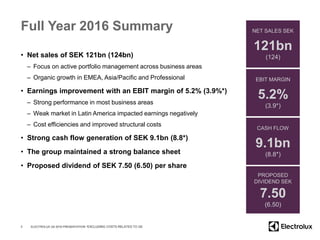
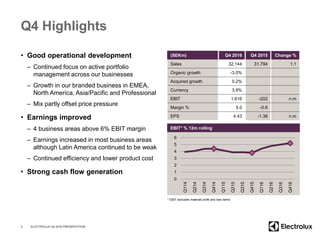

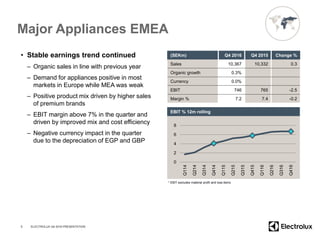
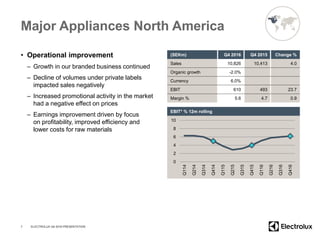

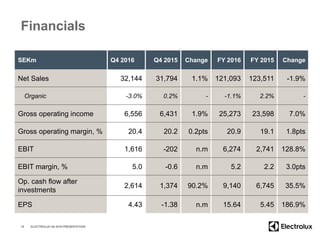
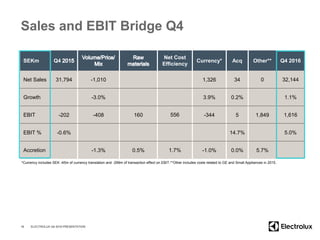
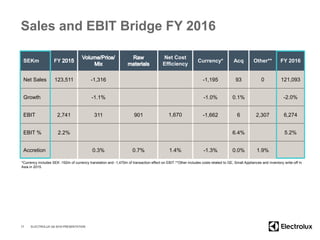
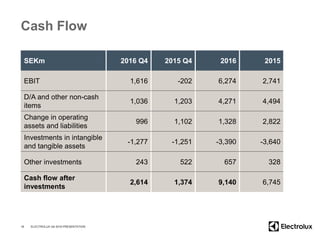
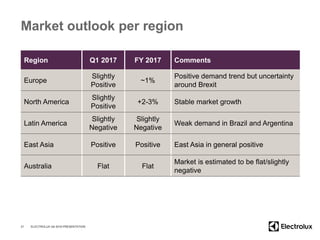
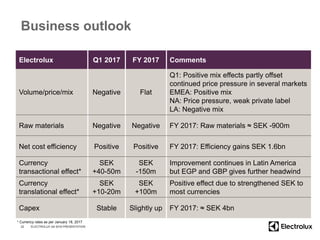

- Electrolux reported net sales of SEK 121 billion for full year 2016, with an EBIT margin of 5.2%. - The company saw organic growth in EMEA, Asia/Pacific, and Professional, while Latin America was negatively impacted by weak market conditions. - Earnings improved due to cost efficiencies, improved structural costs, and strong performance in most business areas, though Latin America continued to struggle. - For Q1 2017, Electrolux expects negative impact from volume/price/mix and raw materials, but positive impact from net cost efficiency and currency. The outlook for full year 2017 is flat volume/price/mix and negative impact from raw materials.


