Download as PDF, PPTX

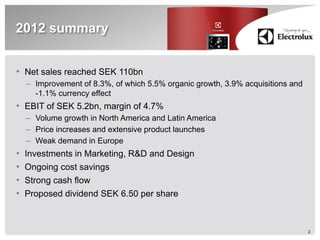
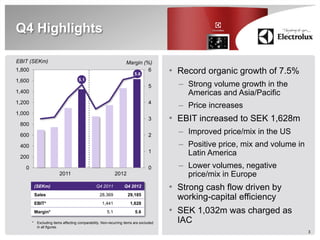
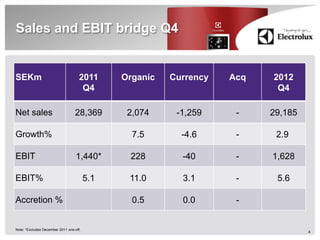
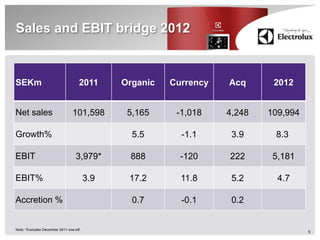

- Net sales for Electrolux reached SEK 110 billion in 2012, an improvement of 8.3% driven by 5.5% organic growth, 3.9% from acquisitions, and a 1.1% currency effect. EBIT was SEK 5.2 billion with a margin of 4.7%. - In Q4 2012, organic sales growth was a record 7.5% with strong growth in the Americas and Asia/Pacific. EBIT increased to SEK 1,628 million with improved price/mix in the US and positive price, mix, and volume in Latin America. - For 2013, the company expects slight organic sales growth with price increases in North America, growth in emerging


