Download to read offline

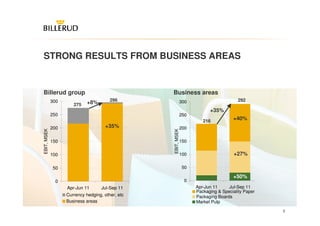
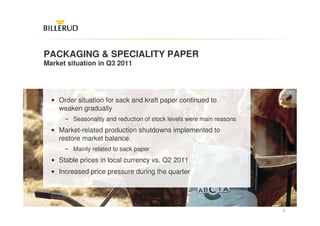
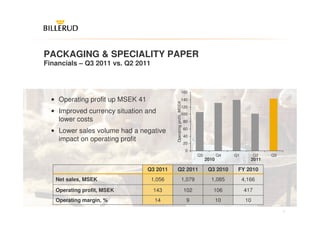
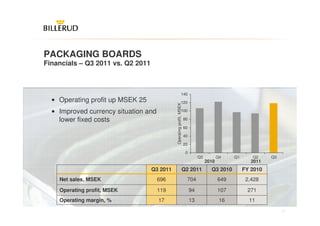
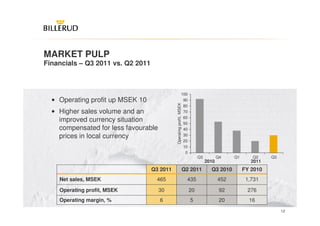
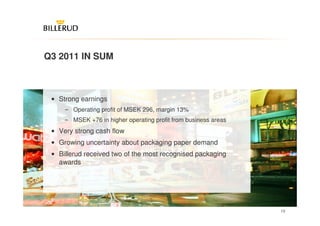
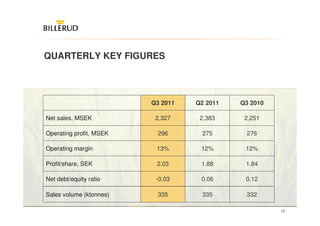
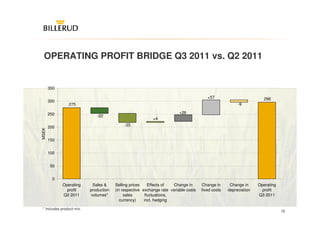
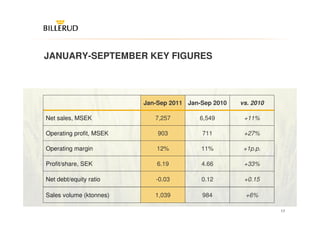
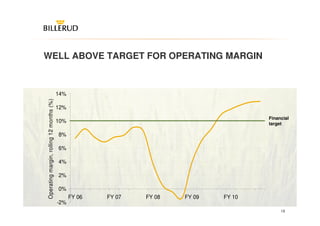
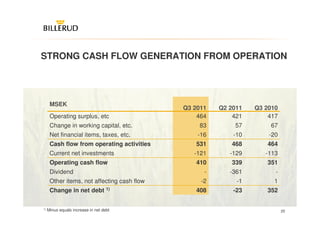


The interim report summarizes Billerud's financial performance for the first three quarters of 2011. Key highlights include strong earnings with an operating profit of MSEK 296 and margin of 13%. Cash flow from operating activities was very strong at MSK 531. All three business areas - Packaging & Speciality Paper, Packaging Boards, and Market Pulp - saw increases in operating profit compared to the previous quarter. However, order situations weakened for packaging paper and boards due to seasonal reductions in customer stock levels and growing uncertainty in demand. Billerud received two major packaging design awards. Overall results were above target operating margin of 12% despite price pressures and weaker demand outlook for the remainder of the year.


![[ls머트리얼즈]LS Materials 417200 Algorithm Investment Report](https://cdn.slidesharecdn.com/ss_thumbnails/lsmaterials417200algorithminvestmentreport-260202182715-66072c7b-thumbnail.jpg?width=640&height=640&fit=bounds)

