Download to read offline

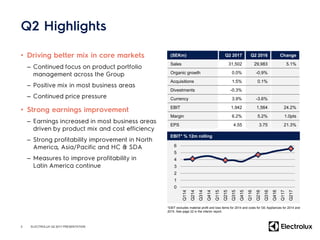
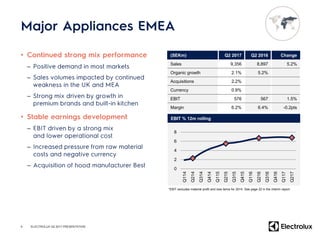
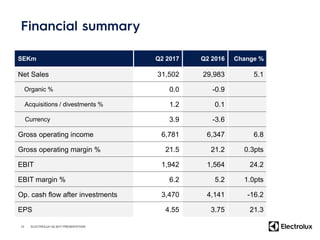
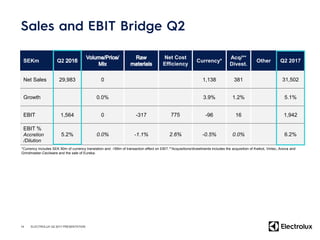
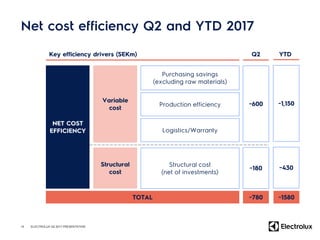
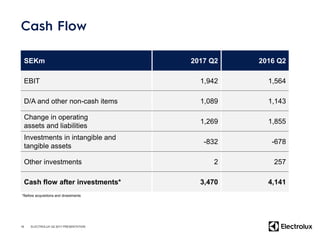

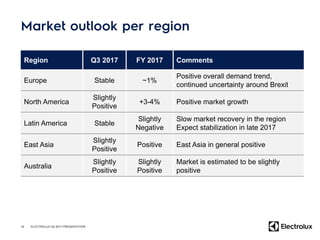
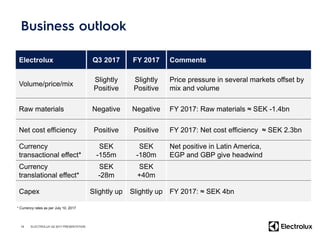
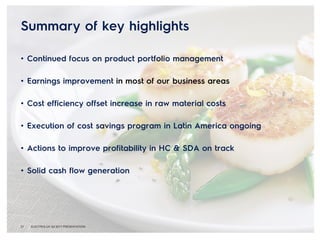

In Q2 2017, Electrolux reported sales of 31.5 billion SEK, a 5.1% increase from Q2 2016, with significant improvements in EBIT and margins. The report highlighted mixed organic growth across various regions, with notable positive trends in North America and East Asia, while Latin America remained stable. Additionally, the company emphasized cost efficiency and its impact on operating cash flow and earnings per share.


