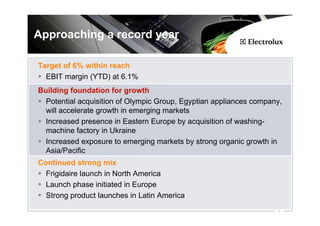
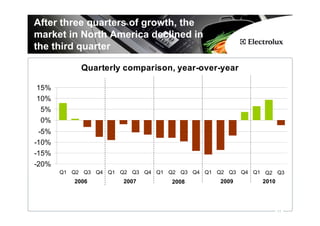
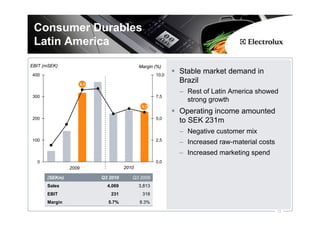
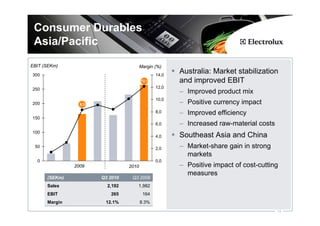
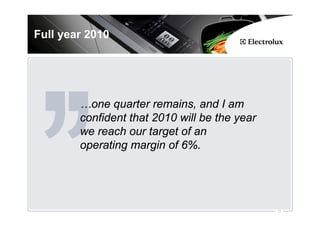
Q3 Results,
October 27, 2010
Hans Stråberg,
President and CEO
Jonas Samuelson, CFO
Peter Nyquist, SVP IR
Approaching a record year

Target of 6% within reach
  EBIT margin (YTD) at 6.1%
Building foundation for growth
  Potential acquisition of Olympic Group, Egyptian appliances company,
  will accelerate growth in emerging markets
  Increased presence in Eastern Europe by acquisition of washing-
  machine factory in Ukraine
  Increased exposure to emerging markets by strong organic growth in
  Asia/Pacific
Continued strong mix
  Frigidaire launch in North America
  Launch phase initiated in Europe
  Strong product launches in Latin America
                                                                    2
Q3 Highlights

EBIT (SEKm)                                                              Margin (%)
2500                                                                            10    Net sales decreased by
                                  8,1
                                                                          7,5
                                                                                8     2.3% in comparable
2000
                                                                                6
                                                                                      currencies
1500
                                                                                4     EBIT amounted to
                                                                                2
                                                                                      SEK 1,977m
1000

                                                                                0
                                                                                      – Raw-material headwinds
500
                                                                                -2
                                                                                      – Increased marketing
                                                                                        spend
   0                                                                            -4
                          2009                                  2010
                                                                                      – Mix improvement
        (SEKm)                                   Q3 2010          Q3 2009
        Sales                                      26,326              27,617
                                                                                      – Cost savings
        EBIT*                                        1,977              2,234         – Price promotions
        Margin                                           7.5%           8.1%
       *) EBIT excluding items affecting comparability
                                                                                                               3
Q3 Operating cash flow

                                 4 000

 Q3 cash flow reflects normal    3 500

 seasonal pattern                3 000


 Stronger second half            2 500


   – Increased production        2 000


                                 1 500
   – Build-up of inventories
                                 1 000
   – Higher sales
                                   500
 Q309 reflected low production
                                     0
 and low inventory levels
                                  -500

 Higher level of investments     -1 000

 compared to last year           -1 500
                                          Operations (excl.   Change in      Investments   Operating cash
                                          assets and liab.)   assets and                        flow
                                                               liabilities

                                                                 Q3, 2009    Q3, 2010

                                                                                                     4
Olympic Group – accelerating
growth in emerging markets

 Increase our presence in emerging markets
 Improve ability to grow in North Africa and
 the Middle East
 OG is currently licensing our brands
 Cost-competitive sourcing base
  Olympic Group

  Sales                  ~SEK 2.5bn

  EBITDA (adj.)               >13%

  Market share, Egypt         ~30%

  Market growth, Egypt        >10%
                                               5
Consumer Durables
 Europe
EBIT (SEKm)                         Margin (%)
1500                                          12
                                                   Lower sales
                                        9,9        – Decline in private label sales
                 9,0                          10
                                                   – Price pressure
1000                                          8    Strong EBIT improvement
                                              6
                                                   – Strong mix – increased sales
                                                     within built-in segment
 500                                          4
                                                   – Cost savings – previous cost
                                                     measures
                                              2
                                                   – Positive one-off effect
   0                                          0
                2009             2010              Increased marketing spend
       (SEKm)          Q3 2010   Q3 2009           – Launch of AEG-branded
       Sales            10,210    11,322             products in Europe
       EBIT              1,014     1,014
                                                   Strong results for floor-care
       Margin            9.9%      9.0%
                                                   products – mix improvement
                                                                                      6
Flat market in Europe; but Eastern
 Europe has started growing

                     Quarterly comparison, year over year

    10%

     5%

     0%

    -5%

   -10%

   -15%
                2006               2007               2008             2009                2010

           Q1   Q2   Q3 Q4    Q1   Q2   Q3   Q4   Q1 Q2   Q3 Q4   Q1   Q2   Q3   Q4   Q1   Q2 Q3

West. Europe 4% 1%    1% 5%   1% 1%     -1% -5% -4% -4% -5% -8%   -9% -9% -4% -2%     1% 0% 0%

East. Europe 1% 9%    6% 7% 14% 5%      5% 10% 6%    5%   4% -15% -31% -30% -26%-17% -7% 1% 5%

                                                                                                   7
Consumer Durables
North America
EBIT (SEKm)                                Margin (%)
800
                   7,9
                                                   8
                                                        Market-demand decline
                                                        – Incentive program ended in Q2
600                                          5,3   6    Net sales decreased by 4%
                                                        – Exited unprofitable volumes
400                                                4
                                                        EBIT amounted to
200                                                2    SEK 439m
                                                        – Higher raw-material costs
  0                                                0    – Price promotions
                                                        Lower sales and operating
-200                                               -2
                2009               2010                 income for floor-care
       (SEKm)            Q3 2010    Q3 2009
                                                        products
       Sales               8,353          8,869
       EBIT                 439            705
       Margin              5.3%           7.9%
                                                                                        10
After three quarters of growth, the
market in North America declined in
the third quarter

            Quarterly comparison, year-over-year

15%
10%
 5%
 0%
-5%
-10%
-15%
-20%
       Q1 Q2 Q3 Q4 Q1 Q2 Q3 Q4 Q1 Q2 Q3 Q4 Q1 Q2 Q3 Q4 Q1 Q2 Q3
          2006        2007         2008        2009      2010


                                                                11
Consumer Durables
 Latin America
EBIT (mSEK)                                  Margin (%)
400                                                  10,0
                                                            Stable market demand in
                      8,3
                                                            Brazil
                                                            – Rest of Latin America showed
300                                                  7,5
                                                              strong growth
                                              5,7
                                                            Operating income amounted
200                                                  5,0
                                                            to SEK 231m
                                                            – Negative customer mix
100                                                  2,5
                                                            – Increased raw-material costs
                                                            – Increased marketing spend
  0                                                  0,0
               2009                   2010

      (SEKm)                Q3 2010      Q3 2009
      Sales                   4,069          3,813
      EBIT                     231            318
      Margin                  5.7%           8.3%
                                                                                             12
Consumer Durables
 Asia/Pacific
EBIT (SEKm)                             Margin (%)
300                                            14,0
                                                      Australia: Market stabilization
                                        12,1          and improved EBIT
250                                            12,0
                                                      – Improved product mix
                                               10,0
200              8,3                                  – Positive currency impact
                                               8,0    – Improved efficiency
150
                                               6,0    – Increased raw-material costs
100
                                               4,0    Southeast Asia and China
 50                                            2,0    – Market-share gain in strong
                                                        markets
  0                                            0,0
               2009              2010                 – Positive impact of cost-cutting
                                                        measures
      (SEKm)           Q3 2010    Q3 2009
      Sales              2,192      1,982
      EBIT                265            164
      Margin            12.1%           8.3%
                                                                                       14
Professional Products

EBIT (SEKm)                              Margin (%)

 250                                            15,0
                                                       Food-service
                                         13,5
                                                       – Increased market demand
 200                                            12,0
                 10,6
                                                       – Higher capacity utilization
 150                                            9,0    – Improved customer mix
                                                       – Cost savings
 100                                            6,0
                                                       Laundry products
  50                                            3,0    – Stabilization of market demand

   0                                            0,0
                                                       – Improved cost efficiency
                2009              2010                 – Price increases

       (SEKm)           Q3 2010    Q3 2009
       Sales              1,501      1,629
       EBIT                202            173
       Margin            13.5%       10.6%
                                                                                       15
Fourth quarter

Top line development
  Product mix; continues to have a positive impact
  Market volumes; flat year-over-year
  Electrolux volumes; still impacted from exiting low-profit business in NA
  Price pressure; temporary price cuts driven by promotion in NA
Cost development
  Cost savings; positive impact from the restructuring program
  Raw-material prices; still a negative year-over-year effect
  Increased marketing and brand spend

Take into account
  Similar seasonal pattern as last year; slightly weaker Q4


                                                                        16
Full year 2010


        …one quarter remains, and I am
        confident that 2010 will be the year
        we reach our target of an
        operating margin of 6%.


                                               17
18
Factors affecting forward-
looking statements
Factors affecting forward-looking statements
This presentation contains “forward-looking” statements within the meaning
of the US Private Securities Litigation Reform Act of 1995. Such statements
include, among others, the financial goals and targets of Electrolux for
future periods and future business and financial plans. These statements
are based on current expectations and are subject to risks and uncertainties
that could cause actual results to differ materially due to a variety of factors.
These factors include, but may not be limited to the following: consumer
demand and market conditions in the geographical areas and industries in
which Electrolux operates, effects of currency fluctuations, competitive
pressures to reduce prices, significant loss of business from major retailers,
the success in developing new products and marketing initiatives,
developments in product liability litigation, progress in achieving operational
and capital efficiency goals, the success in identifying growth opportunities
and acquisition candidates and the integration of these opportunities with
existing businesses, progress in achieving structural and supply-chain
reorganization goals.

                                                                                    19

Electrolux Interim Report Q3 2010 Presentation

  • 1.
    Q3 Results, October 27,2010 Hans Stråberg, President and CEO Jonas Samuelson, CFO Peter Nyquist, SVP IR
  • 2.
    Approaching a recordyear Target of 6% within reach EBIT margin (YTD) at 6.1% Building foundation for growth Potential acquisition of Olympic Group, Egyptian appliances company, will accelerate growth in emerging markets Increased presence in Eastern Europe by acquisition of washing- machine factory in Ukraine Increased exposure to emerging markets by strong organic growth in Asia/Pacific Continued strong mix Frigidaire launch in North America Launch phase initiated in Europe Strong product launches in Latin America 2
  • 3.
    Q3 Highlights EBIT (SEKm) Margin (%) 2500 10 Net sales decreased by 8,1 7,5 8 2.3% in comparable 2000 6 currencies 1500 4 EBIT amounted to 2 SEK 1,977m 1000 0 – Raw-material headwinds 500 -2 – Increased marketing spend 0 -4 2009 2010 – Mix improvement (SEKm) Q3 2010 Q3 2009 Sales 26,326 27,617 – Cost savings EBIT* 1,977 2,234 – Price promotions Margin 7.5% 8.1% *) EBIT excluding items affecting comparability 3
  • 4.
    Q3 Operating cashflow 4 000 Q3 cash flow reflects normal 3 500 seasonal pattern 3 000 Stronger second half 2 500 – Increased production 2 000 1 500 – Build-up of inventories 1 000 – Higher sales 500 Q309 reflected low production 0 and low inventory levels -500 Higher level of investments -1 000 compared to last year -1 500 Operations (excl. Change in Investments Operating cash assets and liab.) assets and flow liabilities Q3, 2009 Q3, 2010 4
  • 5.
    Olympic Group –accelerating growth in emerging markets Increase our presence in emerging markets Improve ability to grow in North Africa and the Middle East OG is currently licensing our brands Cost-competitive sourcing base Olympic Group Sales ~SEK 2.5bn EBITDA (adj.) >13% Market share, Egypt ~30% Market growth, Egypt >10% 5
  • 6.
    Consumer Durables Europe EBIT(SEKm) Margin (%) 1500 12 Lower sales 9,9 – Decline in private label sales 9,0 10 – Price pressure 1000 8 Strong EBIT improvement 6 – Strong mix – increased sales within built-in segment 500 4 – Cost savings – previous cost measures 2 – Positive one-off effect 0 0 2009 2010 Increased marketing spend (SEKm) Q3 2010 Q3 2009 – Launch of AEG-branded Sales 10,210 11,322 products in Europe EBIT 1,014 1,014 Strong results for floor-care Margin 9.9% 9.0% products – mix improvement 6
  • 7.
    Flat market inEurope; but Eastern Europe has started growing Quarterly comparison, year over year 10% 5% 0% -5% -10% -15% 2006 2007 2008 2009 2010 Q1 Q2 Q3 Q4 Q1 Q2 Q3 Q4 Q1 Q2 Q3 Q4 Q1 Q2 Q3 Q4 Q1 Q2 Q3 West. Europe 4% 1% 1% 5% 1% 1% -1% -5% -4% -4% -5% -8% -9% -9% -4% -2% 1% 0% 0% East. Europe 1% 9% 6% 7% 14% 5% 5% 10% 6% 5% 4% -15% -31% -30% -26%-17% -7% 1% 5% 7
  • 10.
    Consumer Durables North America EBIT(SEKm) Margin (%) 800 7,9 8 Market-demand decline – Incentive program ended in Q2 600 5,3 6 Net sales decreased by 4% – Exited unprofitable volumes 400 4 EBIT amounted to 200 2 SEK 439m – Higher raw-material costs 0 0 – Price promotions Lower sales and operating -200 -2 2009 2010 income for floor-care (SEKm) Q3 2010 Q3 2009 products Sales 8,353 8,869 EBIT 439 705 Margin 5.3% 7.9% 10
  • 11.
    After three quartersof growth, the market in North America declined in the third quarter Quarterly comparison, year-over-year 15% 10% 5% 0% -5% -10% -15% -20% Q1 Q2 Q3 Q4 Q1 Q2 Q3 Q4 Q1 Q2 Q3 Q4 Q1 Q2 Q3 Q4 Q1 Q2 Q3 2006 2007 2008 2009 2010 11
  • 12.
    Consumer Durables LatinAmerica EBIT (mSEK) Margin (%) 400 10,0 Stable market demand in 8,3 Brazil – Rest of Latin America showed 300 7,5 strong growth 5,7 Operating income amounted 200 5,0 to SEK 231m – Negative customer mix 100 2,5 – Increased raw-material costs – Increased marketing spend 0 0,0 2009 2010 (SEKm) Q3 2010 Q3 2009 Sales 4,069 3,813 EBIT 231 318 Margin 5.7% 8.3% 12
  • 14.
    Consumer Durables Asia/Pacific EBIT(SEKm) Margin (%) 300 14,0 Australia: Market stabilization 12,1 and improved EBIT 250 12,0 – Improved product mix 10,0 200 8,3 – Positive currency impact 8,0 – Improved efficiency 150 6,0 – Increased raw-material costs 100 4,0 Southeast Asia and China 50 2,0 – Market-share gain in strong markets 0 0,0 2009 2010 – Positive impact of cost-cutting measures (SEKm) Q3 2010 Q3 2009 Sales 2,192 1,982 EBIT 265 164 Margin 12.1% 8.3% 14
  • 15.
    Professional Products EBIT (SEKm) Margin (%) 250 15,0 Food-service 13,5 – Increased market demand 200 12,0 10,6 – Higher capacity utilization 150 9,0 – Improved customer mix – Cost savings 100 6,0 Laundry products 50 3,0 – Stabilization of market demand 0 0,0 – Improved cost efficiency 2009 2010 – Price increases (SEKm) Q3 2010 Q3 2009 Sales 1,501 1,629 EBIT 202 173 Margin 13.5% 10.6% 15
  • 16.
    Fourth quarter Top linedevelopment Product mix; continues to have a positive impact Market volumes; flat year-over-year Electrolux volumes; still impacted from exiting low-profit business in NA Price pressure; temporary price cuts driven by promotion in NA Cost development Cost savings; positive impact from the restructuring program Raw-material prices; still a negative year-over-year effect Increased marketing and brand spend Take into account Similar seasonal pattern as last year; slightly weaker Q4 16
  • 17.
    Full year 2010 …one quarter remains, and I am confident that 2010 will be the year we reach our target of an operating margin of 6%. 17
  • 18.
  • 19.
    Factors affecting forward- lookingstatements Factors affecting forward-looking statements This presentation contains “forward-looking” statements within the meaning of the US Private Securities Litigation Reform Act of 1995. Such statements include, among others, the financial goals and targets of Electrolux for future periods and future business and financial plans. These statements are based on current expectations and are subject to risks and uncertainties that could cause actual results to differ materially due to a variety of factors. These factors include, but may not be limited to the following: consumer demand and market conditions in the geographical areas and industries in which Electrolux operates, effects of currency fluctuations, competitive pressures to reduce prices, significant loss of business from major retailers, the success in developing new products and marketing initiatives, developments in product liability litigation, progress in achieving operational and capital efficiency goals, the success in identifying growth opportunities and acquisition candidates and the integration of these opportunities with existing businesses, progress in achieving structural and supply-chain reorganization goals. 19