Download as PDF, PPTX
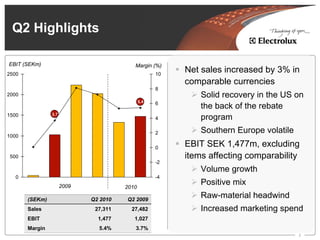
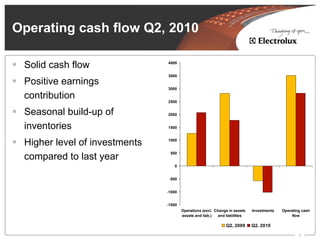
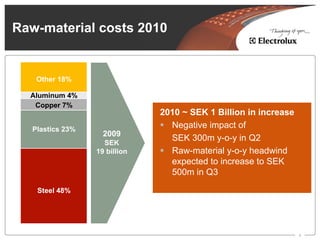
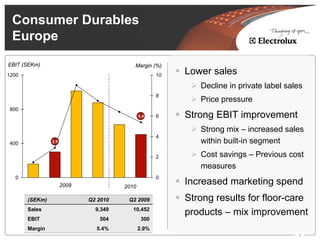
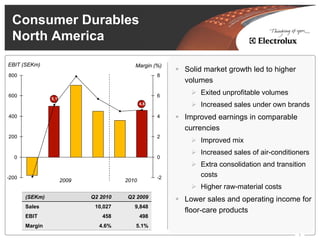
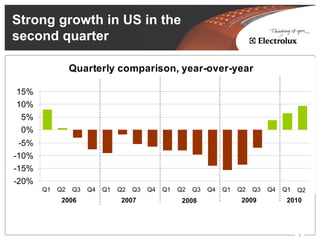
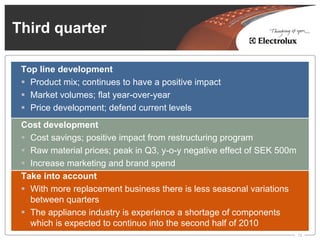


The Q2 2010 results report a 3% increase in net sales in comparable currencies, driven by strong recovery in the US and improved EBIT margin of 5.4%. However, raw material costs have increased significantly, impacting profitability. The outlook for the coming quarters suggests ongoing challenges with component shortages and rising material prices, but a potential goal of reaching a 6% operating margin for the full year is anticipated.


