Download to read offline

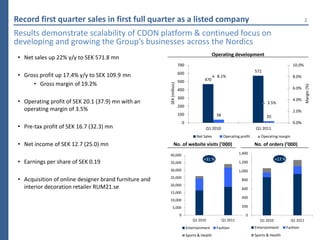
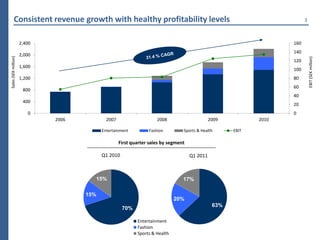

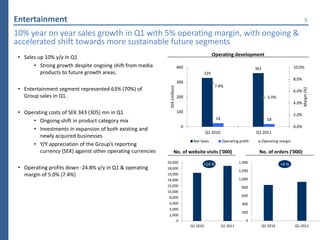
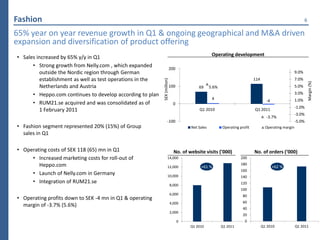
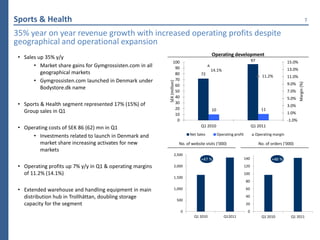

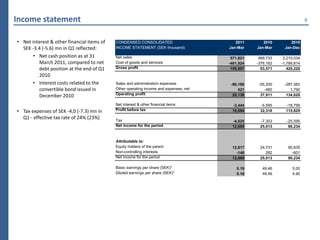
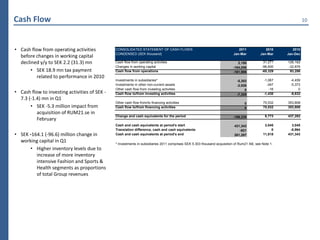
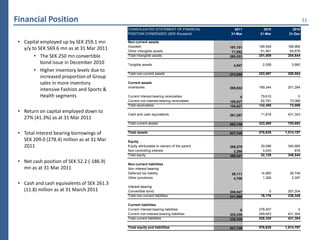


CDON Group reported strong financial results for the first quarter of 2011, with net sales up 22% to SEK 571.8 million and operating profit of SEK 20.1 million. Gross profit increased 17.4% to SEK 109.9 million. The company saw sales growth across all business segments, with the entertainment segment representing 63% of total sales. Operating costs increased due to investments in expanding existing and newly acquired businesses.


