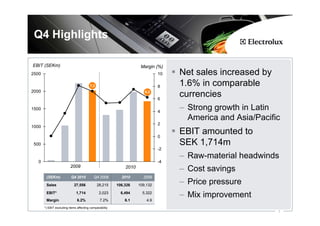
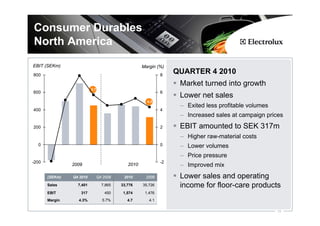
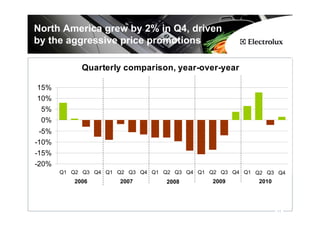
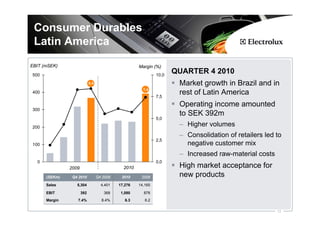
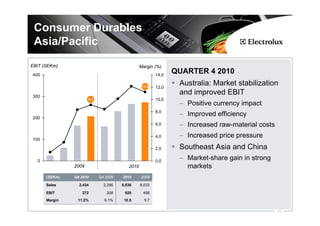
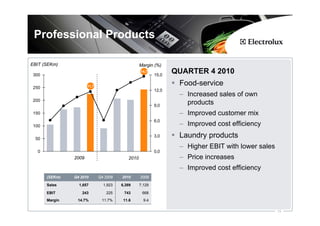
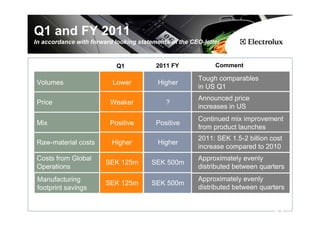
2010 Results
February 2, 2011
Keith McLoughlin,
President and CEO
Jonas Samuelson, CFO
Peter Nyquist, SVP IR
EBIT Target


              2
Q4 Highlights

EBIT (SEKm)                                                          Margin (%)
2500                                                                          10   Net sales increased by
                                        7,2                                   8    1.6% in comparable
2000                                                                   6,2

                                                                              6
                                                                                   currencies
1500
                                                                              4
                                                                                   – Strong growth in Latin
                                                                                     America and Asia/Pacific
                                                                              2
1000

                                                                              0
                                                                                   EBIT amounted to
500                                                                                SEK 1,714m
                                                                              -2
                                                                                   – Raw-material headwinds
   0                                                                          -4
                          2009                               2010
                                                                                   – Cost savings
        (SEKm)            Q4 2010          Q4 2009         2010       2009

        Sales                27,556           28,215     106,326    109,132
                                                                                   – Price pressure
        EBIT*
        Margin
                              1,714
                               6.2%
                                               2,023
                                                7.2%
                                                           6,494
                                                             6.1
                                                                      5,322
                                                                        4.9
                                                                                   – Mix improvement
       *) EBIT excluding items affecting comparability
                                                                                                            3
Q4 Operating cash flow


 Q4 cash flow reflects normal seasonal pattern
  – Increased sales
  – Declining inventories
 Low sales and production in Q409
 Extra contributions to pension funds in Q409
 Higher level of investments compared to last year
 Continued underlying improvement of net operating working
 capital


                                                        4
Olympic acquisition
- Temporarily on hold


  Platform for further growth   Synergies within three areas
     Egypt – Industrial hub       Utilize Electrolux technology
     Olympic Group – Market       and platforms
     leader in Egypt              Increase sales outside Egypt
     Strong industrial and        Use cost-efficient sourcing
     management capabilities      base
     Strong alliance with
     Electrolux
      – Speed up the regional
        growth plans


                                                                  5
Consumer Durables
 Europe, Middle East & Africa
EBIT (SEKm)                                         Margin (%)
1500                                                            12
                                                                     QUARTER 4 2010
                                                                      Lower sales as a result of lower
                                                                10    volumes and prices
1000
                          7,5
                                                                8
                                                                      Lower EBIT
                                                                      – Lower volumes
                                                         5,3    6     – Price pressure
                                                                      – Higher marketing investments
 500                                                            4     – Cost-reduction measures continue to
                                                                        generate savings
                                                                2
                                                                      Good market acceptance for
   0                                                            0
                                                                      newly launched AEG products
                  2009                            2010
                                                                      Lower operating income for floor-
       (SEKm)   Q4 2010     Q4 2009       2010           2009         care products due to cost
       Sales     10,760         11,731   40,038     44,073            increases
       EBIT        565            875     2,703      2,349
       Margin     5.3%           7.5%       6.8           5.3

                                                                                                              6
Increased growth in Eastern
 Europe

                          Quarterly comparison, year over year

     10%

      5%

      0%

      -5%

    -10%

    -15%
                    2006                  2007                2008                 2009                   2010

               Q1   Q2   Q3   Q4   Q1    Q2   Q3   Q4   Q1   Q2    Q3   Q4   Q1    Q2    Q3    Q4    Q1   Q2   Q3   Q4

West. Europe 4%     1%   1%   5%   1%    1%   -1% -5% -4%    -4%   -5% -8%   -9%   -9%   -4%   -2%   1%   0%   0%   0%

East. Europe   1%   9%   6%   7%   14%   5%   5% 10%    6%   5%    4% -15% -31% -30% -26% -17% -7%        1%   5%   13%

                                                                                                                         7
8
9
Consumer Durables
North America
EBIT (SEKm)                                         Margin (%)
800                                                          8
                                                                  QUARTER 4 2010
                                                                   Market turned into growth
                          5,7
600                                                          6
                                                                   Lower net sales
                                                      4,3
                                                                   – Exited less profitable volumes
400                                                          4
                                                                   – Increased sales at campaign prices
200                                                          2     EBIT amounted to SEK 317m
                                                                   – Higher raw-material costs
  0                                                          0     – Lower volumes
                                                                   – Price pressure
-200                                                         -2
                2009                         2010                  – Improved mix
       (SEKm)   Q4 2010         Q4 2009    2010      2009          Lower sales and operating
       Sales      7,401           7,865   33,776    35,726         income for floor-care products
       EBIT        317             450     1,574     1,476
       Margin     4.3%            5.7%       4.7       4.1

                                                                                                      10
North America grew by 2% in Q4, driven
by the aggressive price promotions

            Quarterly comparison, year-over-year

15%
10%
 5%
 0%
 -5%
-10%
-15%
-20%
       Q1 Q2 Q3 Q4 Q1 Q2 Q3 Q4 Q1 Q2 Q3 Q4 Q1 Q2 Q3 Q4 Q1 Q2 Q3 Q4
          2006        2007        2008         2009        2010


                                                                  11
Consumer Durables
 Latin America
EBIT (mSEK)                                          Margin (%)
500                                                           10,0
                                                                     QUARTER 4 2010
                            8,4                                       Market growth in Brazil and in
                                                       7,4
400
                                                              7,5
                                                                      rest of Latin America
                                                                      Operating income amounted
300
                                                                      to SEK 392m
                                                              5,0

200
                                                                      – Higher volumes
                                                                      – Consolidation of retailers led to
                                                              2,5
100                                                                     negative customer mix
                                                                      – Increased raw-material costs
  0                                                           0,0
               2009                           2010                    High market acceptance for
      (SEKm)    Q4 2010           Q4 2009    2010     2009            new products
      Sales       5,304             4,401   17,276   14,165

      EBIT            392            368     1,080     878
      Margin      7.4%              8.4%       6.3      6.2

                                                                                                       12
13
Consumer Durables
 Asia/Pacific
EBIT (SEKm)                                     Margin (%)
400                                                     14,0
                                                               QUARTER 4 2010
                                                 11,2   12,0
                                                                Australia: Market stabilization
300
                                                                and improved EBIT
                      9,1                               10,0
                                                                – Positive currency impact
                                                        8,0
200
                                                                – Improved efficiency
                                                        6,0     – Increased raw-material costs

100
                                                        4,0     – Increased price pressure
                                                        2,0     Southeast Asia and China
  0                                                     0,0
                                                                – Market-share gain in strong
               2009                      2010                     markets
      (SEKm)   Q4 2010      Q4 2009   2010      2009

      Sales      2,434        2,295   8,836     8,033

      EBIT        272          208     928       458
      Margin    11.2%         9.1%     10.5       5.7

                                                                                                 14
Professional Products

EBIT (SEKm)                                       Margin (%)

 300
                                                  14,7
                                                          15,0
                                                                 QUARTER 4 2010

 250                   11,7
                                                                  Food-service
                                                          12,0
                                                                  – Increased sales of own
 200
                                                          9,0
                                                                    products
 150                                                              – Improved customer mix
                                                          6,0
 100                                                              – Improved cost efficiency

  50
                                                          3,0     Laundry products
                                                                  – Higher EBIT with lower sales
   0                                                      0,0
                2009                       2010                   – Price increases
                                                                  – Improved cost efficiency
       (SEKm)   Q4 2010       Q4 2009   2010      2009

       Sales      1,657         1,923   6,389     7,129

       EBIT        243           225     743       668
       Margin    14.7%         11.7%     11.6       9.4

                                                                                                   15
Q1 and FY 2011
In accordance with forward looking statements in the CEO-letter


                            Q1           2011 FY             Comment

                                                       Tough comparables
Volumes                   Lower           Higher
                                                       in US Q1
                                                       Announced price
Price                    Weaker             ?
                                                       increases in US
                                                       Continued mix improvement
Mix                      Positive        Positive
                                                       from product launches
                                                       2011: SEK 1.5-2 billion cost
Raw-material costs        Higher          Higher
                                                       increase compared to 2010
Costs from Global                                      Approximately evenly
                        SEK 125m       SEK 500m
Operations                                             distributed between quarters
 Manufacturing                                         Approximately evenly
                        SEK 125m       SEK 500m
 footprint savings                                     distributed between quarters


                                                                                 16
17
Factors affecting forward-
looking statements
Factors affecting forward-looking statements
This presentation contains “forward-looking” statements within the meaning
of the US Private Securities Litigation Reform Act of 1995. Such statements
include, among others, the financial goals and targets of Electrolux for
future periods and future business and financial plans. These statements
are based on current expectations and are subject to risks and uncertainties
that could cause actual results to differ materially due to a variety of factors.
These factors include, but may not be limited to the following: consumer
demand and market conditions in the geographical areas and industries in
which Electrolux operates, effects of currency fluctuations, competitive
pressures to reduce prices, significant loss of business from major retailers,
the success in developing new products and marketing initiatives,
developments in product liability litigation, progress in achieving operational
and capital efficiency goals, the success in identifying growth opportunities
and acquisition candidates and the integration of these opportunities with
existing businesses, progress in achieving structural and supply-chain
reorganization goals.

                                                                                    18

Electrolux Interim Report Q4 2010 Presentation

  • 1.
    2010 Results February 2,2011 Keith McLoughlin, President and CEO Jonas Samuelson, CFO Peter Nyquist, SVP IR
  • 2.
  • 3.
    Q4 Highlights EBIT (SEKm) Margin (%) 2500 10 Net sales increased by 7,2 8 1.6% in comparable 2000 6,2 6 currencies 1500 4 – Strong growth in Latin America and Asia/Pacific 2 1000 0 EBIT amounted to 500 SEK 1,714m -2 – Raw-material headwinds 0 -4 2009 2010 – Cost savings (SEKm) Q4 2010 Q4 2009 2010 2009 Sales 27,556 28,215 106,326 109,132 – Price pressure EBIT* Margin 1,714 6.2% 2,023 7.2% 6,494 6.1 5,322 4.9 – Mix improvement *) EBIT excluding items affecting comparability 3
  • 4.
    Q4 Operating cashflow Q4 cash flow reflects normal seasonal pattern – Increased sales – Declining inventories Low sales and production in Q409 Extra contributions to pension funds in Q409 Higher level of investments compared to last year Continued underlying improvement of net operating working capital 4
  • 5.
    Olympic acquisition - Temporarilyon hold Platform for further growth Synergies within three areas Egypt – Industrial hub Utilize Electrolux technology Olympic Group – Market and platforms leader in Egypt Increase sales outside Egypt Strong industrial and Use cost-efficient sourcing management capabilities base Strong alliance with Electrolux – Speed up the regional growth plans 5
  • 6.
    Consumer Durables Europe,Middle East & Africa EBIT (SEKm) Margin (%) 1500 12 QUARTER 4 2010 Lower sales as a result of lower 10 volumes and prices 1000 7,5 8 Lower EBIT – Lower volumes 5,3 6 – Price pressure – Higher marketing investments 500 4 – Cost-reduction measures continue to generate savings 2 Good market acceptance for 0 0 newly launched AEG products 2009 2010 Lower operating income for floor- (SEKm) Q4 2010 Q4 2009 2010 2009 care products due to cost Sales 10,760 11,731 40,038 44,073 increases EBIT 565 875 2,703 2,349 Margin 5.3% 7.5% 6.8 5.3 6
  • 7.
    Increased growth inEastern Europe Quarterly comparison, year over year 10% 5% 0% -5% -10% -15% 2006 2007 2008 2009 2010 Q1 Q2 Q3 Q4 Q1 Q2 Q3 Q4 Q1 Q2 Q3 Q4 Q1 Q2 Q3 Q4 Q1 Q2 Q3 Q4 West. Europe 4% 1% 1% 5% 1% 1% -1% -5% -4% -4% -5% -8% -9% -9% -4% -2% 1% 0% 0% 0% East. Europe 1% 9% 6% 7% 14% 5% 5% 10% 6% 5% 4% -15% -31% -30% -26% -17% -7% 1% 5% 13% 7
  • 8.
  • 9.
  • 10.
    Consumer Durables North America EBIT(SEKm) Margin (%) 800 8 QUARTER 4 2010 Market turned into growth 5,7 600 6 Lower net sales 4,3 – Exited less profitable volumes 400 4 – Increased sales at campaign prices 200 2 EBIT amounted to SEK 317m – Higher raw-material costs 0 0 – Lower volumes – Price pressure -200 -2 2009 2010 – Improved mix (SEKm) Q4 2010 Q4 2009 2010 2009 Lower sales and operating Sales 7,401 7,865 33,776 35,726 income for floor-care products EBIT 317 450 1,574 1,476 Margin 4.3% 5.7% 4.7 4.1 10
  • 11.
    North America grewby 2% in Q4, driven by the aggressive price promotions Quarterly comparison, year-over-year 15% 10% 5% 0% -5% -10% -15% -20% Q1 Q2 Q3 Q4 Q1 Q2 Q3 Q4 Q1 Q2 Q3 Q4 Q1 Q2 Q3 Q4 Q1 Q2 Q3 Q4 2006 2007 2008 2009 2010 11
  • 12.
    Consumer Durables LatinAmerica EBIT (mSEK) Margin (%) 500 10,0 QUARTER 4 2010 8,4 Market growth in Brazil and in 7,4 400 7,5 rest of Latin America Operating income amounted 300 to SEK 392m 5,0 200 – Higher volumes – Consolidation of retailers led to 2,5 100 negative customer mix – Increased raw-material costs 0 0,0 2009 2010 High market acceptance for (SEKm) Q4 2010 Q4 2009 2010 2009 new products Sales 5,304 4,401 17,276 14,165 EBIT 392 368 1,080 878 Margin 7.4% 8.4% 6.3 6.2 12
  • 13.
  • 14.
    Consumer Durables Asia/Pacific EBIT(SEKm) Margin (%) 400 14,0 QUARTER 4 2010 11,2 12,0 Australia: Market stabilization 300 and improved EBIT 9,1 10,0 – Positive currency impact 8,0 200 – Improved efficiency 6,0 – Increased raw-material costs 100 4,0 – Increased price pressure 2,0 Southeast Asia and China 0 0,0 – Market-share gain in strong 2009 2010 markets (SEKm) Q4 2010 Q4 2009 2010 2009 Sales 2,434 2,295 8,836 8,033 EBIT 272 208 928 458 Margin 11.2% 9.1% 10.5 5.7 14
  • 15.
    Professional Products EBIT (SEKm) Margin (%) 300 14,7 15,0 QUARTER 4 2010 250 11,7 Food-service 12,0 – Increased sales of own 200 9,0 products 150 – Improved customer mix 6,0 100 – Improved cost efficiency 50 3,0 Laundry products – Higher EBIT with lower sales 0 0,0 2009 2010 – Price increases – Improved cost efficiency (SEKm) Q4 2010 Q4 2009 2010 2009 Sales 1,657 1,923 6,389 7,129 EBIT 243 225 743 668 Margin 14.7% 11.7% 11.6 9.4 15
  • 16.
    Q1 and FY2011 In accordance with forward looking statements in the CEO-letter Q1 2011 FY Comment Tough comparables Volumes Lower Higher in US Q1 Announced price Price Weaker ? increases in US Continued mix improvement Mix Positive Positive from product launches 2011: SEK 1.5-2 billion cost Raw-material costs Higher Higher increase compared to 2010 Costs from Global Approximately evenly SEK 125m SEK 500m Operations distributed between quarters Manufacturing Approximately evenly SEK 125m SEK 500m footprint savings distributed between quarters 16
  • 17.
  • 18.
    Factors affecting forward- lookingstatements Factors affecting forward-looking statements This presentation contains “forward-looking” statements within the meaning of the US Private Securities Litigation Reform Act of 1995. Such statements include, among others, the financial goals and targets of Electrolux for future periods and future business and financial plans. These statements are based on current expectations and are subject to risks and uncertainties that could cause actual results to differ materially due to a variety of factors. These factors include, but may not be limited to the following: consumer demand and market conditions in the geographical areas and industries in which Electrolux operates, effects of currency fluctuations, competitive pressures to reduce prices, significant loss of business from major retailers, the success in developing new products and marketing initiatives, developments in product liability litigation, progress in achieving operational and capital efficiency goals, the success in identifying growth opportunities and acquisition candidates and the integration of these opportunities with existing businesses, progress in achieving structural and supply-chain reorganization goals. 18