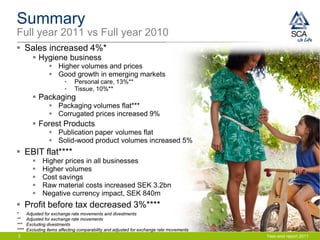
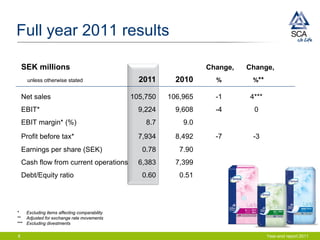
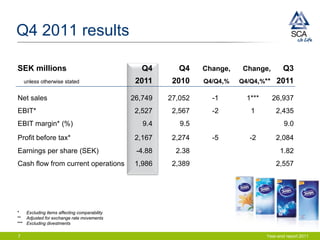
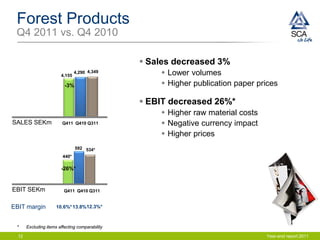
Year-end report 2011
1 January – 31 December 2011


                               Year-end report 2011
Key events
 Binding offer to acquire Georgia-Pacific’s European tissue
  operations
 Divesting the Packaging business, excluding the two
  kraftliner mills
 Acquisitions in emerging markets
 Established joint venture in Australasia
 Efficiency program
 New hygiene organization
 Wind power joint venture with Fred.Olsen Renewables


2                                                    Year-end report 2011
Summary
Full year 2011 vs Full year 2010
 Sales increased 4%*
           Hygiene business
                  Higher volumes and prices
                  Good growth in emerging markets
                         •    Personal care, 13%**
                         •    Tissue, 10%**
           Packaging
                  Packaging volumes flat***
                  Corrugated prices increased 9%
           Forest Products
                  Publication paper volumes flat
                  Solid-wood product volumes increased 5%
 EBIT flat****
             Higher prices in all businesses
             Higher volumes
             Cost savings
             Raw material costs increased SEK 3.2bn
             Negative currency impact, SEK 840m
 Profit before tax decreased 3%****
*      Adjusted for exchange rate movements and divestments
**     Adjusted for exchange rate movements
***    Excluding divestments
****   Excluding items affecting comparability and adjusted for exchange rate movements
 3                                                                                        Year-end report 2011
Summary
Q4 2011 vs Q4 2010
 Sales increased 1%*
           Hygiene business
                  Higher volumes in Personal Care and flat volumes in Tissue
                  Higher prices
                  Good growth in emerging markets
                         •    Personal care, 16%**
                         •    Tissue, 10%**
           Packaging
                  Packaging volumes decreased 3%***
                  Corrugated prices increased 6%
           Forest Products
                  Publication paper volumes decreased 2%
                  Solid-wood product volumes flat
 EBIT increased 1%****
           Higher prices in all businesses
           Raw material costs increased SEK 220m
           Negative currency impact, SEK 110m
 Profit before tax decreased 2%****
*      Adjusted for exchange rate movements and divestments
**     Adjusted for exchange rate movements
***    Excluding divestments
****   Excluding items affecting comparability and adjusted for exchange rate movements
4                                                                                         Year-end report 2011
Items affecting comparability
Full year 2011 vs Full year 2010

 Items affecting comparability amounted to SEK 5,676m
  (931)
     Write-down of assets in the packaging operations: SEK 3,949m
     Write-down in connection with the divestment of 50% of the
      hygiene operations in Australasia: SEK 654m
     Transaction costs in connection with acquisitions and
      divestments: SEK 118m
     Restructuring costs: SEK 955m (931)


5                                                           Year-end report 2011
Full year 2011 results

    SEK millions                                                  Change,   Change,
      unless otherwise stated                   2011      2010      %        %**

    Net sales                                 105,750   106,965     -1      4***
    EBIT*                                       9,224     9,608     -4        0
    EBIT margin* (%)                              8.7       9.0
    Profit before tax*                          7,934     8,492     -7       -3
    Earnings per share (SEK)                     0.78      7.90
    Cash flow from current operations           6,383     7,399
    Debt/Equity ratio                            0.60      0.51


*   Excluding items affecting comparability
** Adjusted for exchange rate movements
*** Excluding divestments

6                                                                                  Year-end report 2011
Q4 2011 results

SEK millions                                     Q4       Q4    Change,    Change,        Q3
    unless otherwise stated                    2011     2010    Q4/Q4,%   Q4/Q4,%**    2011

Net sales                                     26,749   27,052     -1        1***      26,937
EBIT*                                          2,527    2,567     -2         1         2,435
EBIT margin* (%)                                 9.4      9.5                              9.0
Profit before tax*                             2,167    2,274     -5         -2        2,084
Earnings per share (SEK)                       -4.88     2.38                            1.82
Cash flow from current operations              1,986    2,389                          2,557


*   Excluding items affecting comparability
** Adjusted for exchange rate movements
*** Excluding divestments

7                                                                                  Year-end report 2011
Q4 2011 vs. Q3 2011
Summary
 Group
        Sales flat
        EBIT increased 4%*
        Profit before tax increased 4%*
 Business areas
        Personal Care, EBIT increased 15%*
               • Improved price/mix
               • Higher volumes
               • Lower raw material costs
        Tissue, EBIT increased 29%*
               • Higher prices and volumes
               • Lower raw material costs
        Packaging, EBIT decreased 20%*
               • Seasonally lower containerboard volumes
               • Lower prices
               • Lower raw material costs
        Forest Products, EBIT decreased 18%*
               • Lower prices
*   Excluding items affecting comparability
8                                                          Year-end report 2011
Personal Care
 Q4 2011 vs. Q4 2010

                       6,529 6,375 6,310
                                                               Sales increased 2% (4%*)
                                                                          Incontinence care increased 5%*
                        2%
                                                                          Baby diapers increased 5%*
                                                                          Feminine care increased 1%*
                                                                          Emerging markets increased 16%*
SALES SEKm             Q411 Q410 Q311
                                                               EBIT increased by 8%** (12%***)
                                                                           Higher volumes
                      792** 735
                                                                           Higher prices
                                688**
                       8%**
                                                                           Cost savings
                                                                           Higher raw material cost
                                                                           Negative currency impact
EBIT SEKm             Q411 Q410 Q311


EBIT margin        12.1%** 11.5% 10.9%**

 *   Adjusted for exchange rate movements
 ** Excluding items affecting comparability
 *** Excluding items affecting comparability and adjusted for exchange rate movements

  9                                                                                                    Year-end report 2011
Tissue
 Q4 2011 vs. Q4 2010

                     10,280 10,154 9,951
                                                             Sales increased 1% (3%*)
                        1%
                                                                        Consumer tissue flat*
                                                                        AFH tissue increased 6%*
                                                                        Emerging markets increased 10%*


SALES SEKm             Q411 Q410 Q311                        EBIT increased 33%** (37%***)
                                                                        Higher prices
                                                                        Improved product mix
                      1,046**

                                787 809**
                                                                        Lower raw material costs
                      33%**
                                                                        Negative currency impact


EBIT SEKm              Q411 Q410 Q311

EBIT margin        10.2%** 7.8% 8.1%**

 *   Adjusted for exchange rate movements
 ** Excluding items affecting comparability
 *** Excluding items affecting comparability and adjusted for exchange rate movements

  10                                                                                                Year-end report 2011
Packaging
 Q4 2011 vs. Q4 2010

                                                              Sales decreased 6% (flat*)
                                                                        Higher prices
                               6,704 6,810
                                                                        Lower volumes
                       6,287


                        -6%
                                                              EBIT decreased 25%** (23%***)
                                                                        Higher prices
                                                                        Cost savings
SALES SEKm             Q411 Q410 Q311
                                                                        Higher raw material costs
                                                                        Lower volumes
                               567
                                     534**                              Negative currency impact
                       428**

                      -25%**


EBIT SEKm              Q411 Q410 Q311


EBIT margin          6.8%** 8.5% 7.8%**
 *   Adjusted for exchange rate movements and divestments
 ** Excluding items affecting comparability
 *** Excluding items affecting comparability and adjusted for exchange rate movements

  11                                                                                                 Year-end report 2011
Forest Products
 Q4 2011 vs. Q4 2010

                                                  Sales decreased 3%
                        4,155
                                4,290 4,349           Lower volumes
                          -3%                         Higher publication paper prices

                                                  EBIT decreased 26%*
                                                      Higher raw material costs
SALES SEKm               Q411 Q410 Q311               Negative currency impact
                                                      Higher prices
                                592 534*
                         440*

                        -26%*


EBIT SEKm                 Q411 Q410 Q311


EBIT margin           10.6%* 13.8%12.3%*


 *     Excluding items affecting comparability

  12                                                                               Year-end report 2011
Dividend


 Proposed 5% increase of the dividend
     to SEK 4.20 (4.00) per share


13                                       Year-end report 2011
Binding offer for Georgia-Pacific’s
European tissue operations
 Creates a leading European tissue
  company
 Strengthens our product offering and
  geographic reach
 Offered price: EUR 1.32bn
 Sales: EUR 1.25bn
 Annual synergies: EUR 125m
 With fully realized synergies earnings per
  share are expected to increase with
  approx. SEK 1.70


14                                             Year-end report 2011
Divestment of Packaging
Supports SCA’s strategy

 Divestment of Packaging to DS Smith
 Enables increased growth in the hygiene business
 SCA’s two kraftliner mills in Sweden are not included
 Purchase price: EUR 1.7bn on a debt free basis
 Earnings per share decrease by SEK 0.73*
 The hygiene business will account for approx. 80%**
  of SCA’s net sales
 Debt/Equity ratio will decrease to approx. 0.5**
* Based on the net profit for 2011
** Provided that the Packaging divestment and the previously announced binding offer for
    Georgia-Pacific’s European tissue business are closed according to plan.
15                                                                                         Year-end report 2011
Strategic focus areas


16                      Year-end report 2011
Efficiency
 Restructuring program in baby diapers in
  Europe finalized
 Efficiency program
      Mainly related to Personal Care and Tissue
      Annual cost savings: SEK 700m
      Gradual impact during 2012-2013
      Annualized savings in Q4 2011: SEK 200m
 New hygiene organization
 Investments in new capacity and upgrades


17                                                  Year-end report 2011
Innovation
Strengthens market positions and profitability


18                                               Year-end report 2011
Growth
 Binding offer for Georgia-Pacific´s European
  tissue operations
 High growth in emerging markets
 Acquisition in Brazil
      Pro Descart, No. 2 in incontinence care products
 Acquisitions in Turkey
      San Saglik 95%, No. 2 in incontinence care products
      Komili 50%, No. 4 in baby diapers and feminine care
       products
 New hygiene organization
 Wind power joint venture with Fred.Olsen
  Renewables
 Investments in new capacity and upgrades

19                                                           Year-end report 2011
Q&A


20         Year-end report 2011
IR Contacts:
     Johan Karlsson, VP Investor Relations      Jessica Ölvestad, Manager Investor Relations
     Tel: +46 8 788 51 30                       Tel: +46 8 788 52 82
                      Email: ir@sca.com      Website: www.sca.com


21                                                                                Year-end report 2011

SCA presentation year-end report Q4 2011

  • 1.
    Year-end report 2011 1January – 31 December 2011 Year-end report 2011
  • 2.
    Key events  Bindingoffer to acquire Georgia-Pacific’s European tissue operations  Divesting the Packaging business, excluding the two kraftliner mills  Acquisitions in emerging markets  Established joint venture in Australasia  Efficiency program  New hygiene organization  Wind power joint venture with Fred.Olsen Renewables 2 Year-end report 2011
  • 3.
    Summary Full year 2011vs Full year 2010  Sales increased 4%*  Hygiene business  Higher volumes and prices  Good growth in emerging markets • Personal care, 13%** • Tissue, 10%**  Packaging  Packaging volumes flat***  Corrugated prices increased 9%  Forest Products  Publication paper volumes flat  Solid-wood product volumes increased 5%  EBIT flat****  Higher prices in all businesses  Higher volumes  Cost savings  Raw material costs increased SEK 3.2bn  Negative currency impact, SEK 840m  Profit before tax decreased 3%**** * Adjusted for exchange rate movements and divestments ** Adjusted for exchange rate movements *** Excluding divestments **** Excluding items affecting comparability and adjusted for exchange rate movements 3 Year-end report 2011
  • 4.
    Summary Q4 2011 vsQ4 2010  Sales increased 1%*  Hygiene business  Higher volumes in Personal Care and flat volumes in Tissue  Higher prices  Good growth in emerging markets • Personal care, 16%** • Tissue, 10%**  Packaging  Packaging volumes decreased 3%***  Corrugated prices increased 6%  Forest Products  Publication paper volumes decreased 2%  Solid-wood product volumes flat  EBIT increased 1%****  Higher prices in all businesses  Raw material costs increased SEK 220m  Negative currency impact, SEK 110m  Profit before tax decreased 2%**** * Adjusted for exchange rate movements and divestments ** Adjusted for exchange rate movements *** Excluding divestments **** Excluding items affecting comparability and adjusted for exchange rate movements 4 Year-end report 2011
  • 5.
    Items affecting comparability Fullyear 2011 vs Full year 2010  Items affecting comparability amounted to SEK 5,676m (931)  Write-down of assets in the packaging operations: SEK 3,949m  Write-down in connection with the divestment of 50% of the hygiene operations in Australasia: SEK 654m  Transaction costs in connection with acquisitions and divestments: SEK 118m  Restructuring costs: SEK 955m (931) 5 Year-end report 2011
  • 6.
    Full year 2011results SEK millions Change, Change, unless otherwise stated 2011 2010 % %** Net sales 105,750 106,965 -1 4*** EBIT* 9,224 9,608 -4 0 EBIT margin* (%) 8.7 9.0 Profit before tax* 7,934 8,492 -7 -3 Earnings per share (SEK) 0.78 7.90 Cash flow from current operations 6,383 7,399 Debt/Equity ratio 0.60 0.51 * Excluding items affecting comparability ** Adjusted for exchange rate movements *** Excluding divestments 6 Year-end report 2011
  • 7.
    Q4 2011 results SEKmillions Q4 Q4 Change, Change, Q3 unless otherwise stated 2011 2010 Q4/Q4,% Q4/Q4,%** 2011 Net sales 26,749 27,052 -1 1*** 26,937 EBIT* 2,527 2,567 -2 1 2,435 EBIT margin* (%) 9.4 9.5 9.0 Profit before tax* 2,167 2,274 -5 -2 2,084 Earnings per share (SEK) -4.88 2.38 1.82 Cash flow from current operations 1,986 2,389 2,557 * Excluding items affecting comparability ** Adjusted for exchange rate movements *** Excluding divestments 7 Year-end report 2011
  • 8.
    Q4 2011 vs.Q3 2011 Summary  Group  Sales flat  EBIT increased 4%*  Profit before tax increased 4%*  Business areas  Personal Care, EBIT increased 15%* • Improved price/mix • Higher volumes • Lower raw material costs  Tissue, EBIT increased 29%* • Higher prices and volumes • Lower raw material costs  Packaging, EBIT decreased 20%* • Seasonally lower containerboard volumes • Lower prices • Lower raw material costs  Forest Products, EBIT decreased 18%* • Lower prices * Excluding items affecting comparability 8 Year-end report 2011
  • 9.
    Personal Care Q42011 vs. Q4 2010 6,529 6,375 6,310  Sales increased 2% (4%*)  Incontinence care increased 5%* 2%  Baby diapers increased 5%*  Feminine care increased 1%*  Emerging markets increased 16%* SALES SEKm Q411 Q410 Q311  EBIT increased by 8%** (12%***)  Higher volumes 792** 735  Higher prices 688** 8%**  Cost savings  Higher raw material cost  Negative currency impact EBIT SEKm Q411 Q410 Q311 EBIT margin 12.1%** 11.5% 10.9%** * Adjusted for exchange rate movements ** Excluding items affecting comparability *** Excluding items affecting comparability and adjusted for exchange rate movements 9 Year-end report 2011
  • 10.
    Tissue Q4 2011vs. Q4 2010 10,280 10,154 9,951  Sales increased 1% (3%*) 1%  Consumer tissue flat*  AFH tissue increased 6%*  Emerging markets increased 10%* SALES SEKm Q411 Q410 Q311  EBIT increased 33%** (37%***)  Higher prices  Improved product mix 1,046** 787 809**  Lower raw material costs 33%**  Negative currency impact EBIT SEKm Q411 Q410 Q311 EBIT margin 10.2%** 7.8% 8.1%** * Adjusted for exchange rate movements ** Excluding items affecting comparability *** Excluding items affecting comparability and adjusted for exchange rate movements 10 Year-end report 2011
  • 11.
    Packaging Q4 2011vs. Q4 2010  Sales decreased 6% (flat*)  Higher prices 6,704 6,810  Lower volumes 6,287 -6%  EBIT decreased 25%** (23%***)  Higher prices  Cost savings SALES SEKm Q411 Q410 Q311  Higher raw material costs  Lower volumes 567 534**  Negative currency impact 428** -25%** EBIT SEKm Q411 Q410 Q311 EBIT margin 6.8%** 8.5% 7.8%** * Adjusted for exchange rate movements and divestments ** Excluding items affecting comparability *** Excluding items affecting comparability and adjusted for exchange rate movements 11 Year-end report 2011
  • 12.
    Forest Products Q42011 vs. Q4 2010  Sales decreased 3% 4,155 4,290 4,349  Lower volumes -3%  Higher publication paper prices  EBIT decreased 26%*  Higher raw material costs SALES SEKm Q411 Q410 Q311  Negative currency impact  Higher prices 592 534* 440* -26%* EBIT SEKm Q411 Q410 Q311 EBIT margin 10.6%* 13.8%12.3%* * Excluding items affecting comparability 12 Year-end report 2011
  • 13.
    Dividend  Proposed 5%increase of the dividend to SEK 4.20 (4.00) per share 13 Year-end report 2011
  • 14.
    Binding offer forGeorgia-Pacific’s European tissue operations  Creates a leading European tissue company  Strengthens our product offering and geographic reach  Offered price: EUR 1.32bn  Sales: EUR 1.25bn  Annual synergies: EUR 125m  With fully realized synergies earnings per share are expected to increase with approx. SEK 1.70 14 Year-end report 2011
  • 15.
    Divestment of Packaging SupportsSCA’s strategy  Divestment of Packaging to DS Smith  Enables increased growth in the hygiene business  SCA’s two kraftliner mills in Sweden are not included  Purchase price: EUR 1.7bn on a debt free basis  Earnings per share decrease by SEK 0.73*  The hygiene business will account for approx. 80%** of SCA’s net sales  Debt/Equity ratio will decrease to approx. 0.5** * Based on the net profit for 2011 ** Provided that the Packaging divestment and the previously announced binding offer for Georgia-Pacific’s European tissue business are closed according to plan. 15 Year-end report 2011
  • 16.
    Strategic focus areas 16 Year-end report 2011
  • 17.
    Efficiency  Restructuring programin baby diapers in Europe finalized  Efficiency program  Mainly related to Personal Care and Tissue  Annual cost savings: SEK 700m  Gradual impact during 2012-2013  Annualized savings in Q4 2011: SEK 200m  New hygiene organization  Investments in new capacity and upgrades 17 Year-end report 2011
  • 18.
    Innovation Strengthens market positionsand profitability 18 Year-end report 2011
  • 19.
    Growth  Binding offerfor Georgia-Pacific´s European tissue operations  High growth in emerging markets  Acquisition in Brazil  Pro Descart, No. 2 in incontinence care products  Acquisitions in Turkey  San Saglik 95%, No. 2 in incontinence care products  Komili 50%, No. 4 in baby diapers and feminine care products  New hygiene organization  Wind power joint venture with Fred.Olsen Renewables  Investments in new capacity and upgrades 19 Year-end report 2011
  • 20.
    Q&A 20 Year-end report 2011
  • 21.
    IR Contacts: Johan Karlsson, VP Investor Relations Jessica Ölvestad, Manager Investor Relations Tel: +46 8 788 51 30 Tel: +46 8 788 52 82 Email: ir@sca.com Website: www.sca.com 21 Year-end report 2011