Download to read offline
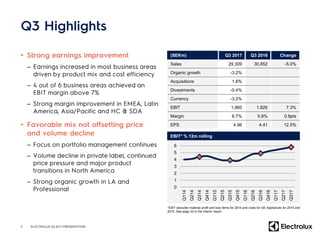
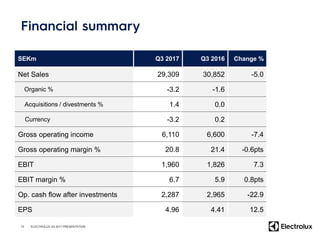
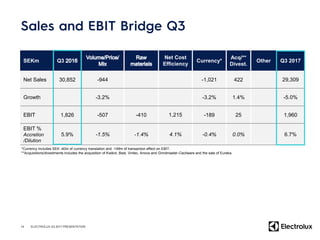
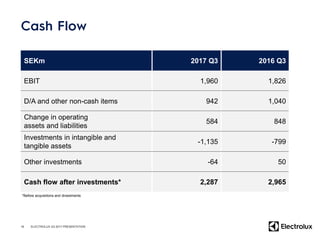


Electrolux reported a 5.0% decline in sales for Q3 2017 compared to Q3 2016, with organic growth at -3.2% and a notable increase in EBIT of 7.3% to 1,960 million SEK. The overall performance reflects a challenging market, particularly in Europe and North America, despite positive trends in some regions like Latin America and East Asia. Earnings per share also improved by 12.5% to 4.96 SEK, highlighting increased operational efficiency.


