SlideShare a Scribd company logo
Chapter 9
Electrical conductivity
1 Introduction
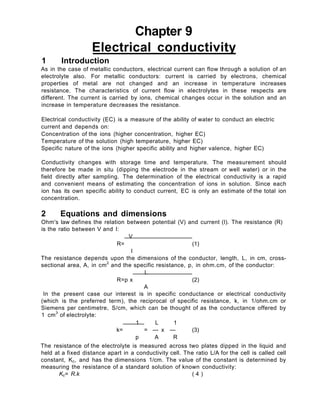
As in the case of metallic conductors, electrical current can flow through a solution of an
electrolyte also. For metallic conductors: current is carried by electrons, chemical
properties of metal are not changed and an increase in temperature increases
resistance. The characteristics of current flow in electrolytes in these respects are
different. The current is carried by ions, chemical changes occur in the solution and an
increase in temperature decreases the resistance.
Electrical conductivity (EC) is a measure of the ability of water to conduct an electric
current and depends on:
Concentration of the ions (higher concentration, higher EC)
Temperature of the solution (high temperature, higher EC)
Specific nature of the ions (higher specific ability and higher valence, higher EC)
Conductivity changes with storage time and temperature. The measurement should
therefore be made in situ (dipping the electrode in the stream or well water) or in the
field directly after sampling. The determination of the electrical conductivity is a rapid
and convenient means of estimating the concentration of ions in solution. Since each
ion has its own specific ability to conduct current, EC is only an estimate of the total ion
concentration.
2 Equations and dimensions
Ohm's law defines the relation between potential (V) and current (I). The resistance (R)
is the ratio between V and I:
V
R= (1)
I
The resistance depends upon the dimensions of the conductor, length, L, in cm, cross-
sectional area, A, in cm2
and the specific resistance, p, in ohm.cm, of the conductor:
L
R=p x (2)
A
In the present case our interest is in specific conductance or electrical conductivity
(which is the preferred term), the reciprocal of specific resistance, k, in 1/ohm.cm or
Siemens per centimetre, S/cm, which can be thought of as the conductance offered by
1 cm3
of electrolyte:
1 L 1
k= = — x — (3)
p A R
The resistance of the electrolyte is measured across two plates dipped in the liquid and
held at a fixed distance apart in a conductivity cell. The ratio L/A for the cell is called cell
constant, Kc, and has the dimensions 1/cm. The value of the constant is determined by
measuring the resistance of a standard solution of known conductivity:
Kc= R.k ( 4 )
3 Unit of measurement and reporting
In the international system of units (SI) the electrical conductivity is expressed in
Siemens which is the reciprocal of resistance in ohm. The older unit for conductance
was mho. Report conductivity as milli Siemens per meter at 25°C (mS.m"1
). See table
for conversions.
4 Apparatus
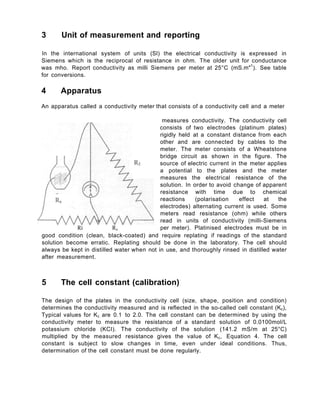
An apparatus called a conductivity meter that consists of a conductivity cell and a meter
measures conductivity. The conductivity cell
consists of two electrodes (platinum plates)
rigidly held at a constant distance from each
other and are connected by cables to the
meter. The meter consists of a Wheatstone
bridge circuit as shown in the figure. The
source of electric current in the meter applies
a potential to the plates and the meter
measures the electrical resistance of the
solution. In order to avoid change of apparent
resistance with time due to chemical
reactions (polarisation effect at the
electrodes) alternating current is used. Some
meters read resistance (ohm) while others
read in units of conductivity (milli-Siemens
Ri R2 per meter). Platinised electrodes must be in
good condition (clean, black-coated) and require replating if readings of the standard
solution become erratic. Replating should be done in the laboratory. The cell should
always be kept in distilled water when not in use, and thoroughly rinsed in distilled water
after measurement.
5 The cell constant (calibration)
The design of the plates in the conductivity cell (size, shape, position and condition)
determines the conductivity measured and is reflected in the so-called cell constant (Kc),
Typical values for Kc are 0.1 to 2.0. The cell constant can be determined by using the
conductivity meter to measure the resistance of a standard solution of 0.0100mol/L
potassium chloride (KCI). The conductivity of the solution (141.2 mS/m at 25°C)
multiplied by the measured resistance gives the value of Kc, Equation 4. The cell
constant is subject to slow changes in time, even under ideal conditions. Thus,
determination of the cell constant must be done regularly.
6 Temperature correction
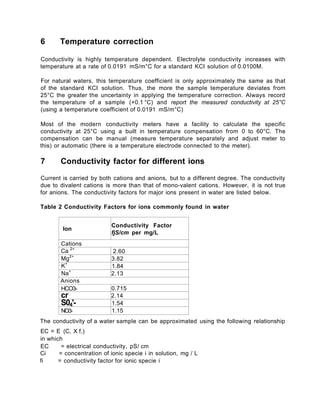
Conductivity is highly temperature dependent. Electrolyte conductivity increases with
temperature at a rate of 0.0191 mS/m°C for a standard KCI solution of 0.0100M.
For natural waters, this temperature coefficient is only approximately the same as that
of the standard KCI solution. Thus, the more the sample temperature deviates from
25°C the greater the uncertainty in applying the temperature correction. Always record
the temperature of a sample (+0.1 °C) and report the measured conductivity at 25°C
(using a temperature coefficient of 0.0191 mS/m°C)
Most of the modern conductivity meters have a facility to calculate the specific
conductivity at 25°C using a built in temperature compensation from 0 to 60°C. The
compensation can be manual (measure temperature separately and adjust meter to
this) or automatic (there is a temperature electrode connected to the meter).
7 Conductivity factor for different ions
Current is carried by both cations and anions, but to a different degree. The conductivity
due to divalent cations is more than that of mono-valent cations. However, it is not true
for anions. The conductivity factors for major ions present in water are listed below.
Table 2 Conductivity Factors for ions commonly found in water
Ion
Conductivity Factor
fjS/cm per mg/L
Cations
Ca 2+
2.60
Mg2+
3.82
K+
1.84
Na+
2.13
Anions
HCO3- 0.715
cr 2.14
S04'- 1.54
NO3- 1.15
The conductivity of a water sample can be approximated using the following relationship
EC = E (C, X f,)
in which
EC = electrical conductivity, pS/ cm
Ci = concentration of ionic specie i in solution, mg / L
fi = conductivity factor for ionic specie i
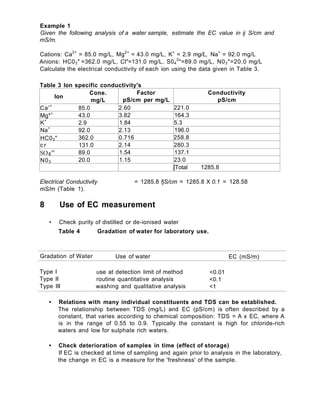
Example 1
Given the following analysis of a water sample, estimate the EC value in ij S/cm and
mS/m.
Cations: Ca2+
= 85.0 mg/L, Mg2+
= 43.0 mg/L, K+
= 2.9 mg/L, Na+
= 92.0 mg/L
Anions: HC03" =362.0 mg/L, Cl"=131.0 mg/L, S04
2
"=89.0 mg/L, N03"=20.0 mg/L
Calculate the electrical conductivity of each ion using the data given in Table 3.
Table 3 Ion specific conductivity's
Ion
Cone.
mg/L
Factor
pS/cm per mg/L
Conductivity
pS/cm
Ca'+
85.0 2.60 221.0
Mg*+
43.0 3.82 164.3
K+
2.9 1.84 5.3
Na+
92.0 2.13 196.0
HC03" 362.0 0.716 258.8
c r 131.0 2.14 280.3
SO42
" 89.0 1.54 137.1
N03 20.0 1.15 23.0
[Total 1285.8
Electrical Conductivity = 1285.8 fjS/cm = 1285.8 X 0.1 = 128.58
mS/m (Table 1).
8 Use of EC measurement
• Check purity of distilled or de-ionised water
Table 4 Gradation of water for laboratory use.
Gradation of Water Use of water EC (mS/m)
Type I use at detection limit of method <0.01
Type II routine quantitative analysis <0.1
Type III washing and qualitative analysis <1
• Relations with many individual constituents and TDS can be established.
The relationship between TDS (mg/L) and EC (pS/cm) is often described by a
constant, that varies according to chemical composition: TDS = A x EC, where A
is in the range of 0.55 to 0.9. Typically the constant is high for chloride-rich
waters and low for sulphate rich waters.
• Check deterioration of samples in time (effect of storage)
If EC is checked at time of sampling and again prior to analysis in the laboratory,
the change in EC is a measure for the 'freshness' of the sample.
Example 2
For the water sample given in the example 1, calculate TDS and the corresponding
constant 'A'.
Ion
Cone.
Ion
Mg/L
Ca^+
85.0
43.0
K+
2.9
Na+
92.0
HC03 362.0
CI 131.0
S04"- 89.0
N03" 20.0
I = 824.9
TDS in the sample = 824.9 mg/L. EC value = 1285.8 pS/cm.
TDS
824.9
= A x EC
= Ax 1285.8
= 0.64
OPERATION OF CONDUCTIVITY METER
Measurement of the conductivity
1 .Connect the conductivity electrode to the measuring instrument.
2.Press the < 0>key. (display test appears briefly on the display, after this, the
measuring instrument automatically switches to the measuring mode.)
3.Select the parameter (TDS, Salinity, Conductivity) by pressing <M>key.
4. Immerse the electrode in the water sample.
5. Press <AR> Key to activate auto read.
6. Press <Run/Enter> Key to start the auto read measurement, AR flashes on the
display until a stable measured value is reached, this can be terminated at any time with
<Run/Enter> Key.
Storing the data
1.Press the <STO>key in the measuring mode (display number with the number of the
next free memory location).
2. Press <Run/Enter>key.
3. Enter the ID number with <V >< A>.
4.Terminate the save with <Run/Enter>key.
To see the data memory
1 Press <RCL>Key.(display SEr disp)
2.Press <Run/Enter>key (display number at which data store)
3.Press <Run/Enter>key (display identification number).
4.Press <Run/Enter>key (display day, month)
5.Press <Run/Enter>key (display time)
6.Press <M>key to return in measuring mode.
Calibration
1.Connect the conductivity Electrode to the measuring instrument.
2.Immerse the electrode in the electrolyte solution provided with the instrument.
2.Press the <Cal>in the measuring mode (display Cell).
3. Press <Run/Enter>key (display CAL and cell constant value ,it should be 0.450-
0.500Cm"1
)
note :- At this point ,this procedure can be terminated with<M>.
Precautions
1. Always keep the electrode dry before and after use with absorbent paper.
Need to Calibrate after a fixed interval.

More Related Content

What's hot

Solutions and electrochemistry
Solutions and electrochemistrySolutions and electrochemistry
Solutions and electrochemistry
Fateh Eltaboni
 
Coulometry and Electrogravimetry
Coulometry and ElectrogravimetryCoulometry and Electrogravimetry
Coulometry and Electrogravimetry
MelakuMetto
 
Electrochemistry chapter 1
Electrochemistry chapter 1Electrochemistry chapter 1
Electrochemistry chapter 1
Brhane Amha Tesfahunegn
 
Statistical analysis in analytical chemistry
Statistical analysis in analytical chemistryStatistical analysis in analytical chemistry
Statistical analysis in analytical chemistry
Jethro Masangkay
 
Conductometric titrations (1)
Conductometric titrations (1)Conductometric titrations (1)
Conductometric titrations (1)
chemnidhi
 
Ch # 9 Electrode Polarization.pptx
Ch # 9 Electrode Polarization.pptxCh # 9 Electrode Polarization.pptx
Ch # 9 Electrode Polarization.pptx
HassanShah396906
 
Introduction to electrochemistry by t. hara
Introduction to electrochemistry by t. haraIntroduction to electrochemistry by t. hara
Introduction to electrochemistry by t. haraToru Hara
 
Surface chemistry
Surface chemistry Surface chemistry
Surface chemistry
RaguM6
 
Chronopotentiometry
ChronopotentiometryChronopotentiometry
Chronopotentiometry
Discover for new
 
Water hardness edta
Water hardness edtaWater hardness edta
Water hardness edta6samy
 
Electrochemical cells
Electrochemical cellsElectrochemical cells
Electrochemical cells
AlemuMekonnen3
 
Valence bond theory class 11
Valence bond theory class 11Valence bond theory class 11
Valence bond theory class 11
neelusharma39
 
Introduction to Chemistry
Introduction to ChemistryIntroduction to Chemistry
Introduction to Chemistry
Kev R
 
Aromatic Comp. Lec.2
Aromatic Comp. Lec.2Aromatic Comp. Lec.2
Aromatic Comp. Lec.2
Muhammad Talaat
 
Electrochemistry
ElectrochemistryElectrochemistry
Electrochemistry
wadhava gurumeet
 
Electrochemistry
ElectrochemistryElectrochemistry
Physical chemistry practical
Physical chemistry practicalPhysical chemistry practical
Physical chemistry practical
Rupal Agarwal
 

What's hot (20)

Solutions and electrochemistry
Solutions and electrochemistrySolutions and electrochemistry
Solutions and electrochemistry
 
Coulometry and Electrogravimetry
Coulometry and ElectrogravimetryCoulometry and Electrogravimetry
Coulometry and Electrogravimetry
 
Electrochemistry chapter 1
Electrochemistry chapter 1Electrochemistry chapter 1
Electrochemistry chapter 1
 
Statistical analysis in analytical chemistry
Statistical analysis in analytical chemistryStatistical analysis in analytical chemistry
Statistical analysis in analytical chemistry
 
Conductometric titrations (1)
Conductometric titrations (1)Conductometric titrations (1)
Conductometric titrations (1)
 
Ch # 9 Electrode Polarization.pptx
Ch # 9 Electrode Polarization.pptxCh # 9 Electrode Polarization.pptx
Ch # 9 Electrode Polarization.pptx
 
Electrochemistry
ElectrochemistryElectrochemistry
Electrochemistry
 
Introduction to electrochemistry by t. hara
Introduction to electrochemistry by t. haraIntroduction to electrochemistry by t. hara
Introduction to electrochemistry by t. hara
 
Surface chemistry
Surface chemistry Surface chemistry
Surface chemistry
 
Chronopotentiometry
ChronopotentiometryChronopotentiometry
Chronopotentiometry
 
Electrochemistry
ElectrochemistryElectrochemistry
Electrochemistry
 
Electrochemistry
ElectrochemistryElectrochemistry
Electrochemistry
 
Water hardness edta
Water hardness edtaWater hardness edta
Water hardness edta
 
Electrochemical cells
Electrochemical cellsElectrochemical cells
Electrochemical cells
 
Valence bond theory class 11
Valence bond theory class 11Valence bond theory class 11
Valence bond theory class 11
 
Introduction to Chemistry
Introduction to ChemistryIntroduction to Chemistry
Introduction to Chemistry
 
Aromatic Comp. Lec.2
Aromatic Comp. Lec.2Aromatic Comp. Lec.2
Aromatic Comp. Lec.2
 
Electrochemistry
ElectrochemistryElectrochemistry
Electrochemistry
 
Electrochemistry
ElectrochemistryElectrochemistry
Electrochemistry
 
Physical chemistry practical
Physical chemistry practicalPhysical chemistry practical
Physical chemistry practical
 

Similar to Electrical conductivity

Potentiometry
PotentiometryPotentiometry
Potentiometry
Kalsoom Mohammed
 
Electrochemistry, electrophoresis, ise
Electrochemistry, electrophoresis, iseElectrochemistry, electrophoresis, ise
Electrochemistry, electrophoresis, iseAngelica Nhoj Gemora
 
application-data-sheet-theory-application-of-conductivity-rosemount-en-68442.pdf
application-data-sheet-theory-application-of-conductivity-rosemount-en-68442.pdfapplication-data-sheet-theory-application-of-conductivity-rosemount-en-68442.pdf
application-data-sheet-theory-application-of-conductivity-rosemount-en-68442.pdf
LinhNguyenTien3
 
voltammetry basics.pptx
voltammetry basics.pptxvoltammetry basics.pptx
voltammetry basics.pptx
IslamMohsenDarwish
 
Conductometry titration
Conductometry titrationConductometry titration
Conductometry titration
Krishna Kumar
 
conductometry-170513191040.pdf
conductometry-170513191040.pdfconductometry-170513191040.pdf
conductometry-170513191040.pdf
sarika953774
 
potentiometery
potentiometerypotentiometery
potentiometery
NaumanAltaf4
 
Electrical conductivity
Electrical conductivityElectrical conductivity
Electrical conductivity
Vishal Chaudhari
 
Experiment 4 Electropolymerized Conducting Polymers. In.docx
Experiment 4 Electropolymerized Conducting Polymers.         In.docxExperiment 4 Electropolymerized Conducting Polymers.         In.docx
Experiment 4 Electropolymerized Conducting Polymers. In.docx
gitagrimston
 
Guide_Conductivity_EN_30099121B.pdf
Guide_Conductivity_EN_30099121B.pdfGuide_Conductivity_EN_30099121B.pdf
Guide_Conductivity_EN_30099121B.pdf
LinhNguyenTien3
 
Cyclic voltammetry
Cyclic voltammetryCyclic voltammetry
Cyclic voltammetry
Halavath Ramesh
 
Jk
JkJk
Metodos electroanaliticos (conductimetria)
Metodos electroanaliticos (conductimetria)Metodos electroanaliticos (conductimetria)
Metodos electroanaliticos (conductimetria)
Cristhian Hilasaca Zea
 
Coulometry.pptx presentation assignment copy
Coulometry.pptx presentation assignment   copyCoulometry.pptx presentation assignment   copy
Coulometry.pptx presentation assignment copy
KibetDerrick
 
ELECTROGRAVIMETRY
ELECTROGRAVIMETRYELECTROGRAVIMETRY
ELECTROGRAVIMETRY
ArpitSuralkar
 
Cyclic voltammetry
Cyclic voltammetryCyclic voltammetry
Cyclic voltammetry
Afrin Nirfa
 
Selection of sensor for Cryogenic Temperature Measurement
Selection of sensor for Cryogenic Temperature MeasurementSelection of sensor for Cryogenic Temperature Measurement
Selection of sensor for Cryogenic Temperature Measurement
ijsrd.com
 
Conductometry
ConductometryConductometry
Conductometry
MelakuMetto
 
TRANSDUCERS (2).ppt
TRANSDUCERS (2).pptTRANSDUCERS (2).ppt
TRANSDUCERS (2).ppt
VigneshwariMahamuni1
 

Similar to Electrical conductivity (20)

Potentiometry
PotentiometryPotentiometry
Potentiometry
 
Electrochemistry, electrophoresis, ise
Electrochemistry, electrophoresis, iseElectrochemistry, electrophoresis, ise
Electrochemistry, electrophoresis, ise
 
application-data-sheet-theory-application-of-conductivity-rosemount-en-68442.pdf
application-data-sheet-theory-application-of-conductivity-rosemount-en-68442.pdfapplication-data-sheet-theory-application-of-conductivity-rosemount-en-68442.pdf
application-data-sheet-theory-application-of-conductivity-rosemount-en-68442.pdf
 
Exp 1 (B)
Exp 1 (B)Exp 1 (B)
Exp 1 (B)
 
voltammetry basics.pptx
voltammetry basics.pptxvoltammetry basics.pptx
voltammetry basics.pptx
 
Conductometry titration
Conductometry titrationConductometry titration
Conductometry titration
 
conductometry-170513191040.pdf
conductometry-170513191040.pdfconductometry-170513191040.pdf
conductometry-170513191040.pdf
 
potentiometery
potentiometerypotentiometery
potentiometery
 
Electrical conductivity
Electrical conductivityElectrical conductivity
Electrical conductivity
 
Experiment 4 Electropolymerized Conducting Polymers. In.docx
Experiment 4 Electropolymerized Conducting Polymers.         In.docxExperiment 4 Electropolymerized Conducting Polymers.         In.docx
Experiment 4 Electropolymerized Conducting Polymers. In.docx
 
Guide_Conductivity_EN_30099121B.pdf
Guide_Conductivity_EN_30099121B.pdfGuide_Conductivity_EN_30099121B.pdf
Guide_Conductivity_EN_30099121B.pdf
 
Cyclic voltammetry
Cyclic voltammetryCyclic voltammetry
Cyclic voltammetry
 
Jk
JkJk
Jk
 
Metodos electroanaliticos (conductimetria)
Metodos electroanaliticos (conductimetria)Metodos electroanaliticos (conductimetria)
Metodos electroanaliticos (conductimetria)
 
Coulometry.pptx presentation assignment copy
Coulometry.pptx presentation assignment   copyCoulometry.pptx presentation assignment   copy
Coulometry.pptx presentation assignment copy
 
ELECTROGRAVIMETRY
ELECTROGRAVIMETRYELECTROGRAVIMETRY
ELECTROGRAVIMETRY
 
Cyclic voltammetry
Cyclic voltammetryCyclic voltammetry
Cyclic voltammetry
 
Selection of sensor for Cryogenic Temperature Measurement
Selection of sensor for Cryogenic Temperature MeasurementSelection of sensor for Cryogenic Temperature Measurement
Selection of sensor for Cryogenic Temperature Measurement
 
Conductometry
ConductometryConductometry
Conductometry
 
TRANSDUCERS (2).ppt
TRANSDUCERS (2).pptTRANSDUCERS (2).ppt
TRANSDUCERS (2).ppt
 

More from ECRD IN

Spectrophotometer Meter
Spectrophotometer MeterSpectrophotometer Meter
Spectrophotometer Meter
ECRD IN
 
Quality Assurance and Quality Control
Quality Assurance and Quality ControlQuality Assurance and Quality Control
Quality Assurance and Quality Control
ECRD IN
 
Basic Chemistry Concepts
Basic Chemistry ConceptsBasic Chemistry Concepts
Basic Chemistry Concepts
ECRD IN
 
Measurement of Respirable Suspended Pm10 Particles
Measurement of Respirable Suspended Pm10 ParticlesMeasurement of Respirable Suspended Pm10 Particles
Measurement of Respirable Suspended Pm10 Particles
ECRD IN
 
Measurement of Hydrogen Ion Concentration (pH)
Measurement of Hydrogen Ion Concentration (pH)Measurement of Hydrogen Ion Concentration (pH)
Measurement of Hydrogen Ion Concentration (pH)
ECRD IN
 
Determination of Suspended PM in Atmosphere
Determination of Suspended PM in AtmosphereDetermination of Suspended PM in Atmosphere
Determination of Suspended PM in Atmosphere
ECRD IN
 
Basic Statistics Concepts
Basic Statistics ConceptsBasic Statistics Concepts
Basic Statistics Concepts
ECRD IN
 
Air Pollution, Sources and Characteristics
Air Pollution, Sources and CharacteristicsAir Pollution, Sources and Characteristics
Air Pollution, Sources and Characteristics
ECRD IN
 
Air Pollution Its Origin and Effects
Air Pollution Its Origin and EffectsAir Pollution Its Origin and Effects
Air Pollution Its Origin and Effects
ECRD IN
 
Air Pollution and Meteorology
Air Pollution and MeteorologyAir Pollution and Meteorology
Air Pollution and Meteorology
ECRD IN
 
Dust-Caused Respiratory Occupational Diseases
Dust-Caused Respiratory Occupational DiseasesDust-Caused Respiratory Occupational Diseases
Dust-Caused Respiratory Occupational Diseases
ECRD IN
 
Air Quality Monitoring
Air Quality MonitoringAir Quality Monitoring
Air Quality Monitoring
ECRD IN
 
Approach & Strategy to Meet new Ambient Air Quality Standards
Approach & Strategy to Meet new Ambient Air Quality StandardsApproach & Strategy to Meet new Ambient Air Quality Standards
Approach & Strategy to Meet new Ambient Air Quality Standards
ECRD IN
 
Monitoring CO -NDIR Method
Monitoring CO -NDIR MethodMonitoring CO -NDIR Method
Monitoring CO -NDIR Method
ECRD IN
 
Appropriate Instruments & techniques for Complying with Air Quality Standards
Appropriate Instruments & techniques for Complying with Air Quality StandardsAppropriate Instruments & techniques for Complying with Air Quality Standards
Appropriate Instruments & techniques for Complying with Air Quality Standards
ECRD IN
 
Techniques of Measurement of Organic Pollutants
Techniques of Measurement of Organic PollutantsTechniques of Measurement of Organic Pollutants
Techniques of Measurement of Organic Pollutants
ECRD IN
 
Envirotech APM 460 BL
Envirotech APM 460 BLEnvirotech APM 460 BL
Envirotech APM 460 BL
ECRD IN
 
Monitoring of Gaseous Pollutants
Monitoring of Gaseous PollutantsMonitoring of Gaseous Pollutants
Monitoring of Gaseous Pollutants
ECRD IN
 
Filter Extraction of Heavy Metal & Benzo Pyrene
Filter Extraction of Heavy Metal & Benzo PyreneFilter Extraction of Heavy Metal & Benzo Pyrene
Filter Extraction of Heavy Metal & Benzo Pyrene
ECRD IN
 
Maintenance of High Volume Dust Repairable Sampler
Maintenance of High Volume Dust Repairable SamplerMaintenance of High Volume Dust Repairable Sampler
Maintenance of High Volume Dust Repairable Sampler
ECRD IN
 

More from ECRD IN (20)

Spectrophotometer Meter
Spectrophotometer MeterSpectrophotometer Meter
Spectrophotometer Meter
 
Quality Assurance and Quality Control
Quality Assurance and Quality ControlQuality Assurance and Quality Control
Quality Assurance and Quality Control
 
Basic Chemistry Concepts
Basic Chemistry ConceptsBasic Chemistry Concepts
Basic Chemistry Concepts
 
Measurement of Respirable Suspended Pm10 Particles
Measurement of Respirable Suspended Pm10 ParticlesMeasurement of Respirable Suspended Pm10 Particles
Measurement of Respirable Suspended Pm10 Particles
 
Measurement of Hydrogen Ion Concentration (pH)
Measurement of Hydrogen Ion Concentration (pH)Measurement of Hydrogen Ion Concentration (pH)
Measurement of Hydrogen Ion Concentration (pH)
 
Determination of Suspended PM in Atmosphere
Determination of Suspended PM in AtmosphereDetermination of Suspended PM in Atmosphere
Determination of Suspended PM in Atmosphere
 
Basic Statistics Concepts
Basic Statistics ConceptsBasic Statistics Concepts
Basic Statistics Concepts
 
Air Pollution, Sources and Characteristics
Air Pollution, Sources and CharacteristicsAir Pollution, Sources and Characteristics
Air Pollution, Sources and Characteristics
 
Air Pollution Its Origin and Effects
Air Pollution Its Origin and EffectsAir Pollution Its Origin and Effects
Air Pollution Its Origin and Effects
 
Air Pollution and Meteorology
Air Pollution and MeteorologyAir Pollution and Meteorology
Air Pollution and Meteorology
 
Dust-Caused Respiratory Occupational Diseases
Dust-Caused Respiratory Occupational DiseasesDust-Caused Respiratory Occupational Diseases
Dust-Caused Respiratory Occupational Diseases
 
Air Quality Monitoring
Air Quality MonitoringAir Quality Monitoring
Air Quality Monitoring
 
Approach & Strategy to Meet new Ambient Air Quality Standards
Approach & Strategy to Meet new Ambient Air Quality StandardsApproach & Strategy to Meet new Ambient Air Quality Standards
Approach & Strategy to Meet new Ambient Air Quality Standards
 
Monitoring CO -NDIR Method
Monitoring CO -NDIR MethodMonitoring CO -NDIR Method
Monitoring CO -NDIR Method
 
Appropriate Instruments & techniques for Complying with Air Quality Standards
Appropriate Instruments & techniques for Complying with Air Quality StandardsAppropriate Instruments & techniques for Complying with Air Quality Standards
Appropriate Instruments & techniques for Complying with Air Quality Standards
 
Techniques of Measurement of Organic Pollutants
Techniques of Measurement of Organic PollutantsTechniques of Measurement of Organic Pollutants
Techniques of Measurement of Organic Pollutants
 
Envirotech APM 460 BL
Envirotech APM 460 BLEnvirotech APM 460 BL
Envirotech APM 460 BL
 
Monitoring of Gaseous Pollutants
Monitoring of Gaseous PollutantsMonitoring of Gaseous Pollutants
Monitoring of Gaseous Pollutants
 
Filter Extraction of Heavy Metal & Benzo Pyrene
Filter Extraction of Heavy Metal & Benzo PyreneFilter Extraction of Heavy Metal & Benzo Pyrene
Filter Extraction of Heavy Metal & Benzo Pyrene
 
Maintenance of High Volume Dust Repairable Sampler
Maintenance of High Volume Dust Repairable SamplerMaintenance of High Volume Dust Repairable Sampler
Maintenance of High Volume Dust Repairable Sampler
 

Recently uploaded

Prevalence, biochemical and hematological study of diabetic patients
Prevalence, biochemical and hematological study of diabetic patientsPrevalence, biochemical and hematological study of diabetic patients
Prevalence, biochemical and hematological study of diabetic patients
Open Access Research Paper
 
Willie Nelson Net Worth: A Journey Through Music, Movies, and Business Ventures
Willie Nelson Net Worth: A Journey Through Music, Movies, and Business VenturesWillie Nelson Net Worth: A Journey Through Music, Movies, and Business Ventures
Willie Nelson Net Worth: A Journey Through Music, Movies, and Business Ventures
greendigital
 
Environmental Science Book By Dr. Y.K. Singh
Environmental Science Book By Dr. Y.K. SinghEnvironmental Science Book By Dr. Y.K. Singh
Environmental Science Book By Dr. Y.K. Singh
AhmadKhan917612
 
International+e-Commerce+Platform-www.cfye-commerce.shop
International+e-Commerce+Platform-www.cfye-commerce.shopInternational+e-Commerce+Platform-www.cfye-commerce.shop
International+e-Commerce+Platform-www.cfye-commerce.shop
laozhuseo02
 
ppt on beauty of the nature by Palak.pptx
ppt on  beauty of the nature by Palak.pptxppt on  beauty of the nature by Palak.pptx
ppt on beauty of the nature by Palak.pptx
RaniJaiswal16
 
Presentación Giulio Quaggiotto-Diálogo improbable .pptx.pdf
Presentación Giulio Quaggiotto-Diálogo improbable .pptx.pdfPresentación Giulio Quaggiotto-Diálogo improbable .pptx.pdf
Presentación Giulio Quaggiotto-Diálogo improbable .pptx.pdf
Innovation and Technology for Development Centre
 
Q&A with the Experts: The Food Service Playbook
Q&A with the Experts: The Food Service PlaybookQ&A with the Experts: The Food Service Playbook
Q&A with the Experts: The Food Service Playbook
World Resources Institute (WRI)
 
Daan Park Hydrangea flower season I like it
Daan Park Hydrangea flower season I like itDaan Park Hydrangea flower season I like it
Daan Park Hydrangea flower season I like it
a0966109726
 
Sustainable farming practices in India .pptx
Sustainable farming  practices in India .pptxSustainable farming  practices in India .pptx
Sustainable farming practices in India .pptx
chaitaliambole
 
AGRICULTURE Hydrophonic FERTILISER PPT.pptx
AGRICULTURE Hydrophonic FERTILISER PPT.pptxAGRICULTURE Hydrophonic FERTILISER PPT.pptx
AGRICULTURE Hydrophonic FERTILISER PPT.pptx
BanitaDsouza
 
Alert-driven Community-based Forest monitoring: A case of the Peruvian Amazon
Alert-driven Community-based Forest monitoring: A case of the Peruvian AmazonAlert-driven Community-based Forest monitoring: A case of the Peruvian Amazon
Alert-driven Community-based Forest monitoring: A case of the Peruvian Amazon
CIFOR-ICRAF
 
Celebrating World-environment-day-2024.pdf
Celebrating  World-environment-day-2024.pdfCelebrating  World-environment-day-2024.pdf
Celebrating World-environment-day-2024.pdf
rohankumarsinghrore1
 
IPCC Vice Chair Ladislaus Change Central Asia Climate Change Conference 27 Ma...
IPCC Vice Chair Ladislaus Change Central Asia Climate Change Conference 27 Ma...IPCC Vice Chair Ladislaus Change Central Asia Climate Change Conference 27 Ma...
IPCC Vice Chair Ladislaus Change Central Asia Climate Change Conference 27 Ma...
ipcc-media
 
Artificial Reefs by Kuddle Life Foundation - May 2024
Artificial Reefs by Kuddle Life Foundation - May 2024Artificial Reefs by Kuddle Life Foundation - May 2024
Artificial Reefs by Kuddle Life Foundation - May 2024
punit537210
 
Natural farming @ Dr. Siddhartha S. Jena.pptx
Natural farming @ Dr. Siddhartha S. Jena.pptxNatural farming @ Dr. Siddhartha S. Jena.pptx
Natural farming @ Dr. Siddhartha S. Jena.pptx
sidjena70
 
NRW Board Paper - DRAFT NRW Recreation Strategy
NRW Board Paper - DRAFT NRW Recreation StrategyNRW Board Paper - DRAFT NRW Recreation Strategy
NRW Board Paper - DRAFT NRW Recreation Strategy
Robin Grant
 
Micro RNA genes and their likely influence in rice (Oryza sativa L.) dynamic ...
Micro RNA genes and their likely influence in rice (Oryza sativa L.) dynamic ...Micro RNA genes and their likely influence in rice (Oryza sativa L.) dynamic ...
Micro RNA genes and their likely influence in rice (Oryza sativa L.) dynamic ...
Open Access Research Paper
 
DRAFT NRW Recreation Strategy - People and Nature thriving together
DRAFT NRW Recreation Strategy - People and Nature thriving togetherDRAFT NRW Recreation Strategy - People and Nature thriving together
DRAFT NRW Recreation Strategy - People and Nature thriving together
Robin Grant
 
UNDERSTANDING WHAT GREEN WASHING IS!.pdf
UNDERSTANDING WHAT GREEN WASHING IS!.pdfUNDERSTANDING WHAT GREEN WASHING IS!.pdf
UNDERSTANDING WHAT GREEN WASHING IS!.pdf
JulietMogola
 
Summary of the Climate and Energy Policy of Australia
Summary of the Climate and Energy Policy of AustraliaSummary of the Climate and Energy Policy of Australia
Summary of the Climate and Energy Policy of Australia
yasmindemoraes1
 

Recently uploaded (20)

Prevalence, biochemical and hematological study of diabetic patients
Prevalence, biochemical and hematological study of diabetic patientsPrevalence, biochemical and hematological study of diabetic patients
Prevalence, biochemical and hematological study of diabetic patients
 
Willie Nelson Net Worth: A Journey Through Music, Movies, and Business Ventures
Willie Nelson Net Worth: A Journey Through Music, Movies, and Business VenturesWillie Nelson Net Worth: A Journey Through Music, Movies, and Business Ventures
Willie Nelson Net Worth: A Journey Through Music, Movies, and Business Ventures
 
Environmental Science Book By Dr. Y.K. Singh
Environmental Science Book By Dr. Y.K. SinghEnvironmental Science Book By Dr. Y.K. Singh
Environmental Science Book By Dr. Y.K. Singh
 
International+e-Commerce+Platform-www.cfye-commerce.shop
International+e-Commerce+Platform-www.cfye-commerce.shopInternational+e-Commerce+Platform-www.cfye-commerce.shop
International+e-Commerce+Platform-www.cfye-commerce.shop
 
ppt on beauty of the nature by Palak.pptx
ppt on  beauty of the nature by Palak.pptxppt on  beauty of the nature by Palak.pptx
ppt on beauty of the nature by Palak.pptx
 
Presentación Giulio Quaggiotto-Diálogo improbable .pptx.pdf
Presentación Giulio Quaggiotto-Diálogo improbable .pptx.pdfPresentación Giulio Quaggiotto-Diálogo improbable .pptx.pdf
Presentación Giulio Quaggiotto-Diálogo improbable .pptx.pdf
 
Q&A with the Experts: The Food Service Playbook
Q&A with the Experts: The Food Service PlaybookQ&A with the Experts: The Food Service Playbook
Q&A with the Experts: The Food Service Playbook
 
Daan Park Hydrangea flower season I like it
Daan Park Hydrangea flower season I like itDaan Park Hydrangea flower season I like it
Daan Park Hydrangea flower season I like it
 
Sustainable farming practices in India .pptx
Sustainable farming  practices in India .pptxSustainable farming  practices in India .pptx
Sustainable farming practices in India .pptx
 
AGRICULTURE Hydrophonic FERTILISER PPT.pptx
AGRICULTURE Hydrophonic FERTILISER PPT.pptxAGRICULTURE Hydrophonic FERTILISER PPT.pptx
AGRICULTURE Hydrophonic FERTILISER PPT.pptx
 
Alert-driven Community-based Forest monitoring: A case of the Peruvian Amazon
Alert-driven Community-based Forest monitoring: A case of the Peruvian AmazonAlert-driven Community-based Forest monitoring: A case of the Peruvian Amazon
Alert-driven Community-based Forest monitoring: A case of the Peruvian Amazon
 
Celebrating World-environment-day-2024.pdf
Celebrating  World-environment-day-2024.pdfCelebrating  World-environment-day-2024.pdf
Celebrating World-environment-day-2024.pdf
 
IPCC Vice Chair Ladislaus Change Central Asia Climate Change Conference 27 Ma...
IPCC Vice Chair Ladislaus Change Central Asia Climate Change Conference 27 Ma...IPCC Vice Chair Ladislaus Change Central Asia Climate Change Conference 27 Ma...
IPCC Vice Chair Ladislaus Change Central Asia Climate Change Conference 27 Ma...
 
Artificial Reefs by Kuddle Life Foundation - May 2024
Artificial Reefs by Kuddle Life Foundation - May 2024Artificial Reefs by Kuddle Life Foundation - May 2024
Artificial Reefs by Kuddle Life Foundation - May 2024
 
Natural farming @ Dr. Siddhartha S. Jena.pptx
Natural farming @ Dr. Siddhartha S. Jena.pptxNatural farming @ Dr. Siddhartha S. Jena.pptx
Natural farming @ Dr. Siddhartha S. Jena.pptx
 
NRW Board Paper - DRAFT NRW Recreation Strategy
NRW Board Paper - DRAFT NRW Recreation StrategyNRW Board Paper - DRAFT NRW Recreation Strategy
NRW Board Paper - DRAFT NRW Recreation Strategy
 
Micro RNA genes and their likely influence in rice (Oryza sativa L.) dynamic ...
Micro RNA genes and their likely influence in rice (Oryza sativa L.) dynamic ...Micro RNA genes and their likely influence in rice (Oryza sativa L.) dynamic ...
Micro RNA genes and their likely influence in rice (Oryza sativa L.) dynamic ...
 
DRAFT NRW Recreation Strategy - People and Nature thriving together
DRAFT NRW Recreation Strategy - People and Nature thriving togetherDRAFT NRW Recreation Strategy - People and Nature thriving together
DRAFT NRW Recreation Strategy - People and Nature thriving together
 
UNDERSTANDING WHAT GREEN WASHING IS!.pdf
UNDERSTANDING WHAT GREEN WASHING IS!.pdfUNDERSTANDING WHAT GREEN WASHING IS!.pdf
UNDERSTANDING WHAT GREEN WASHING IS!.pdf
 
Summary of the Climate and Energy Policy of Australia
Summary of the Climate and Energy Policy of AustraliaSummary of the Climate and Energy Policy of Australia
Summary of the Climate and Energy Policy of Australia
 

Electrical conductivity

  • 1. Chapter 9 Electrical conductivity 1 Introduction As in the case of metallic conductors, electrical current can flow through a solution of an electrolyte also. For metallic conductors: current is carried by electrons, chemical properties of metal are not changed and an increase in temperature increases resistance. The characteristics of current flow in electrolytes in these respects are different. The current is carried by ions, chemical changes occur in the solution and an increase in temperature decreases the resistance. Electrical conductivity (EC) is a measure of the ability of water to conduct an electric current and depends on: Concentration of the ions (higher concentration, higher EC) Temperature of the solution (high temperature, higher EC) Specific nature of the ions (higher specific ability and higher valence, higher EC) Conductivity changes with storage time and temperature. The measurement should therefore be made in situ (dipping the electrode in the stream or well water) or in the field directly after sampling. The determination of the electrical conductivity is a rapid and convenient means of estimating the concentration of ions in solution. Since each ion has its own specific ability to conduct current, EC is only an estimate of the total ion concentration. 2 Equations and dimensions Ohm's law defines the relation between potential (V) and current (I). The resistance (R) is the ratio between V and I: V R= (1) I The resistance depends upon the dimensions of the conductor, length, L, in cm, cross- sectional area, A, in cm2 and the specific resistance, p, in ohm.cm, of the conductor: L R=p x (2) A In the present case our interest is in specific conductance or electrical conductivity (which is the preferred term), the reciprocal of specific resistance, k, in 1/ohm.cm or Siemens per centimetre, S/cm, which can be thought of as the conductance offered by 1 cm3 of electrolyte: 1 L 1 k= = — x — (3) p A R The resistance of the electrolyte is measured across two plates dipped in the liquid and held at a fixed distance apart in a conductivity cell. The ratio L/A for the cell is called cell constant, Kc, and has the dimensions 1/cm. The value of the constant is determined by measuring the resistance of a standard solution of known conductivity: Kc= R.k ( 4 )
  • 2. 3 Unit of measurement and reporting In the international system of units (SI) the electrical conductivity is expressed in Siemens which is the reciprocal of resistance in ohm. The older unit for conductance was mho. Report conductivity as milli Siemens per meter at 25°C (mS.m"1 ). See table for conversions. 4 Apparatus An apparatus called a conductivity meter that consists of a conductivity cell and a meter measures conductivity. The conductivity cell consists of two electrodes (platinum plates) rigidly held at a constant distance from each other and are connected by cables to the meter. The meter consists of a Wheatstone bridge circuit as shown in the figure. The source of electric current in the meter applies a potential to the plates and the meter measures the electrical resistance of the solution. In order to avoid change of apparent resistance with time due to chemical reactions (polarisation effect at the electrodes) alternating current is used. Some meters read resistance (ohm) while others read in units of conductivity (milli-Siemens Ri R2 per meter). Platinised electrodes must be in good condition (clean, black-coated) and require replating if readings of the standard solution become erratic. Replating should be done in the laboratory. The cell should always be kept in distilled water when not in use, and thoroughly rinsed in distilled water after measurement. 5 The cell constant (calibration) The design of the plates in the conductivity cell (size, shape, position and condition) determines the conductivity measured and is reflected in the so-called cell constant (Kc), Typical values for Kc are 0.1 to 2.0. The cell constant can be determined by using the conductivity meter to measure the resistance of a standard solution of 0.0100mol/L potassium chloride (KCI). The conductivity of the solution (141.2 mS/m at 25°C) multiplied by the measured resistance gives the value of Kc, Equation 4. The cell constant is subject to slow changes in time, even under ideal conditions. Thus, determination of the cell constant must be done regularly.
  • 3. 6 Temperature correction Conductivity is highly temperature dependent. Electrolyte conductivity increases with temperature at a rate of 0.0191 mS/m°C for a standard KCI solution of 0.0100M. For natural waters, this temperature coefficient is only approximately the same as that of the standard KCI solution. Thus, the more the sample temperature deviates from 25°C the greater the uncertainty in applying the temperature correction. Always record the temperature of a sample (+0.1 °C) and report the measured conductivity at 25°C (using a temperature coefficient of 0.0191 mS/m°C) Most of the modern conductivity meters have a facility to calculate the specific conductivity at 25°C using a built in temperature compensation from 0 to 60°C. The compensation can be manual (measure temperature separately and adjust meter to this) or automatic (there is a temperature electrode connected to the meter). 7 Conductivity factor for different ions Current is carried by both cations and anions, but to a different degree. The conductivity due to divalent cations is more than that of mono-valent cations. However, it is not true for anions. The conductivity factors for major ions present in water are listed below. Table 2 Conductivity Factors for ions commonly found in water Ion Conductivity Factor fjS/cm per mg/L Cations Ca 2+ 2.60 Mg2+ 3.82 K+ 1.84 Na+ 2.13 Anions HCO3- 0.715 cr 2.14 S04'- 1.54 NO3- 1.15 The conductivity of a water sample can be approximated using the following relationship EC = E (C, X f,) in which EC = electrical conductivity, pS/ cm Ci = concentration of ionic specie i in solution, mg / L fi = conductivity factor for ionic specie i
  • 4. Example 1 Given the following analysis of a water sample, estimate the EC value in ij S/cm and mS/m. Cations: Ca2+ = 85.0 mg/L, Mg2+ = 43.0 mg/L, K+ = 2.9 mg/L, Na+ = 92.0 mg/L Anions: HC03" =362.0 mg/L, Cl"=131.0 mg/L, S04 2 "=89.0 mg/L, N03"=20.0 mg/L Calculate the electrical conductivity of each ion using the data given in Table 3. Table 3 Ion specific conductivity's Ion Cone. mg/L Factor pS/cm per mg/L Conductivity pS/cm Ca'+ 85.0 2.60 221.0 Mg*+ 43.0 3.82 164.3 K+ 2.9 1.84 5.3 Na+ 92.0 2.13 196.0 HC03" 362.0 0.716 258.8 c r 131.0 2.14 280.3 SO42 " 89.0 1.54 137.1 N03 20.0 1.15 23.0 [Total 1285.8 Electrical Conductivity = 1285.8 fjS/cm = 1285.8 X 0.1 = 128.58 mS/m (Table 1). 8 Use of EC measurement • Check purity of distilled or de-ionised water Table 4 Gradation of water for laboratory use. Gradation of Water Use of water EC (mS/m) Type I use at detection limit of method <0.01 Type II routine quantitative analysis <0.1 Type III washing and qualitative analysis <1 • Relations with many individual constituents and TDS can be established. The relationship between TDS (mg/L) and EC (pS/cm) is often described by a constant, that varies according to chemical composition: TDS = A x EC, where A is in the range of 0.55 to 0.9. Typically the constant is high for chloride-rich waters and low for sulphate rich waters. • Check deterioration of samples in time (effect of storage) If EC is checked at time of sampling and again prior to analysis in the laboratory, the change in EC is a measure for the 'freshness' of the sample.
  • 5. Example 2 For the water sample given in the example 1, calculate TDS and the corresponding constant 'A'. Ion Cone. Ion Mg/L Ca^+ 85.0 43.0 K+ 2.9 Na+ 92.0 HC03 362.0 CI 131.0 S04"- 89.0 N03" 20.0 I = 824.9 TDS in the sample = 824.9 mg/L. EC value = 1285.8 pS/cm. TDS 824.9 = A x EC = Ax 1285.8 = 0.64
  • 6. OPERATION OF CONDUCTIVITY METER Measurement of the conductivity 1 .Connect the conductivity electrode to the measuring instrument. 2.Press the < 0>key. (display test appears briefly on the display, after this, the measuring instrument automatically switches to the measuring mode.) 3.Select the parameter (TDS, Salinity, Conductivity) by pressing <M>key. 4. Immerse the electrode in the water sample. 5. Press <AR> Key to activate auto read. 6. Press <Run/Enter> Key to start the auto read measurement, AR flashes on the display until a stable measured value is reached, this can be terminated at any time with <Run/Enter> Key. Storing the data 1.Press the <STO>key in the measuring mode (display number with the number of the next free memory location). 2. Press <Run/Enter>key. 3. Enter the ID number with <V >< A>. 4.Terminate the save with <Run/Enter>key. To see the data memory 1 Press <RCL>Key.(display SEr disp) 2.Press <Run/Enter>key (display number at which data store) 3.Press <Run/Enter>key (display identification number). 4.Press <Run/Enter>key (display day, month) 5.Press <Run/Enter>key (display time) 6.Press <M>key to return in measuring mode. Calibration 1.Connect the conductivity Electrode to the measuring instrument. 2.Immerse the electrode in the electrolyte solution provided with the instrument. 2.Press the <Cal>in the measuring mode (display Cell). 3. Press <Run/Enter>key (display CAL and cell constant value ,it should be 0.450- 0.500Cm"1 ) note :- At this point ,this procedure can be terminated with<M>. Precautions 1. Always keep the electrode dry before and after use with absorbent paper. Need to Calibrate after a fixed interval.