Download to read offline

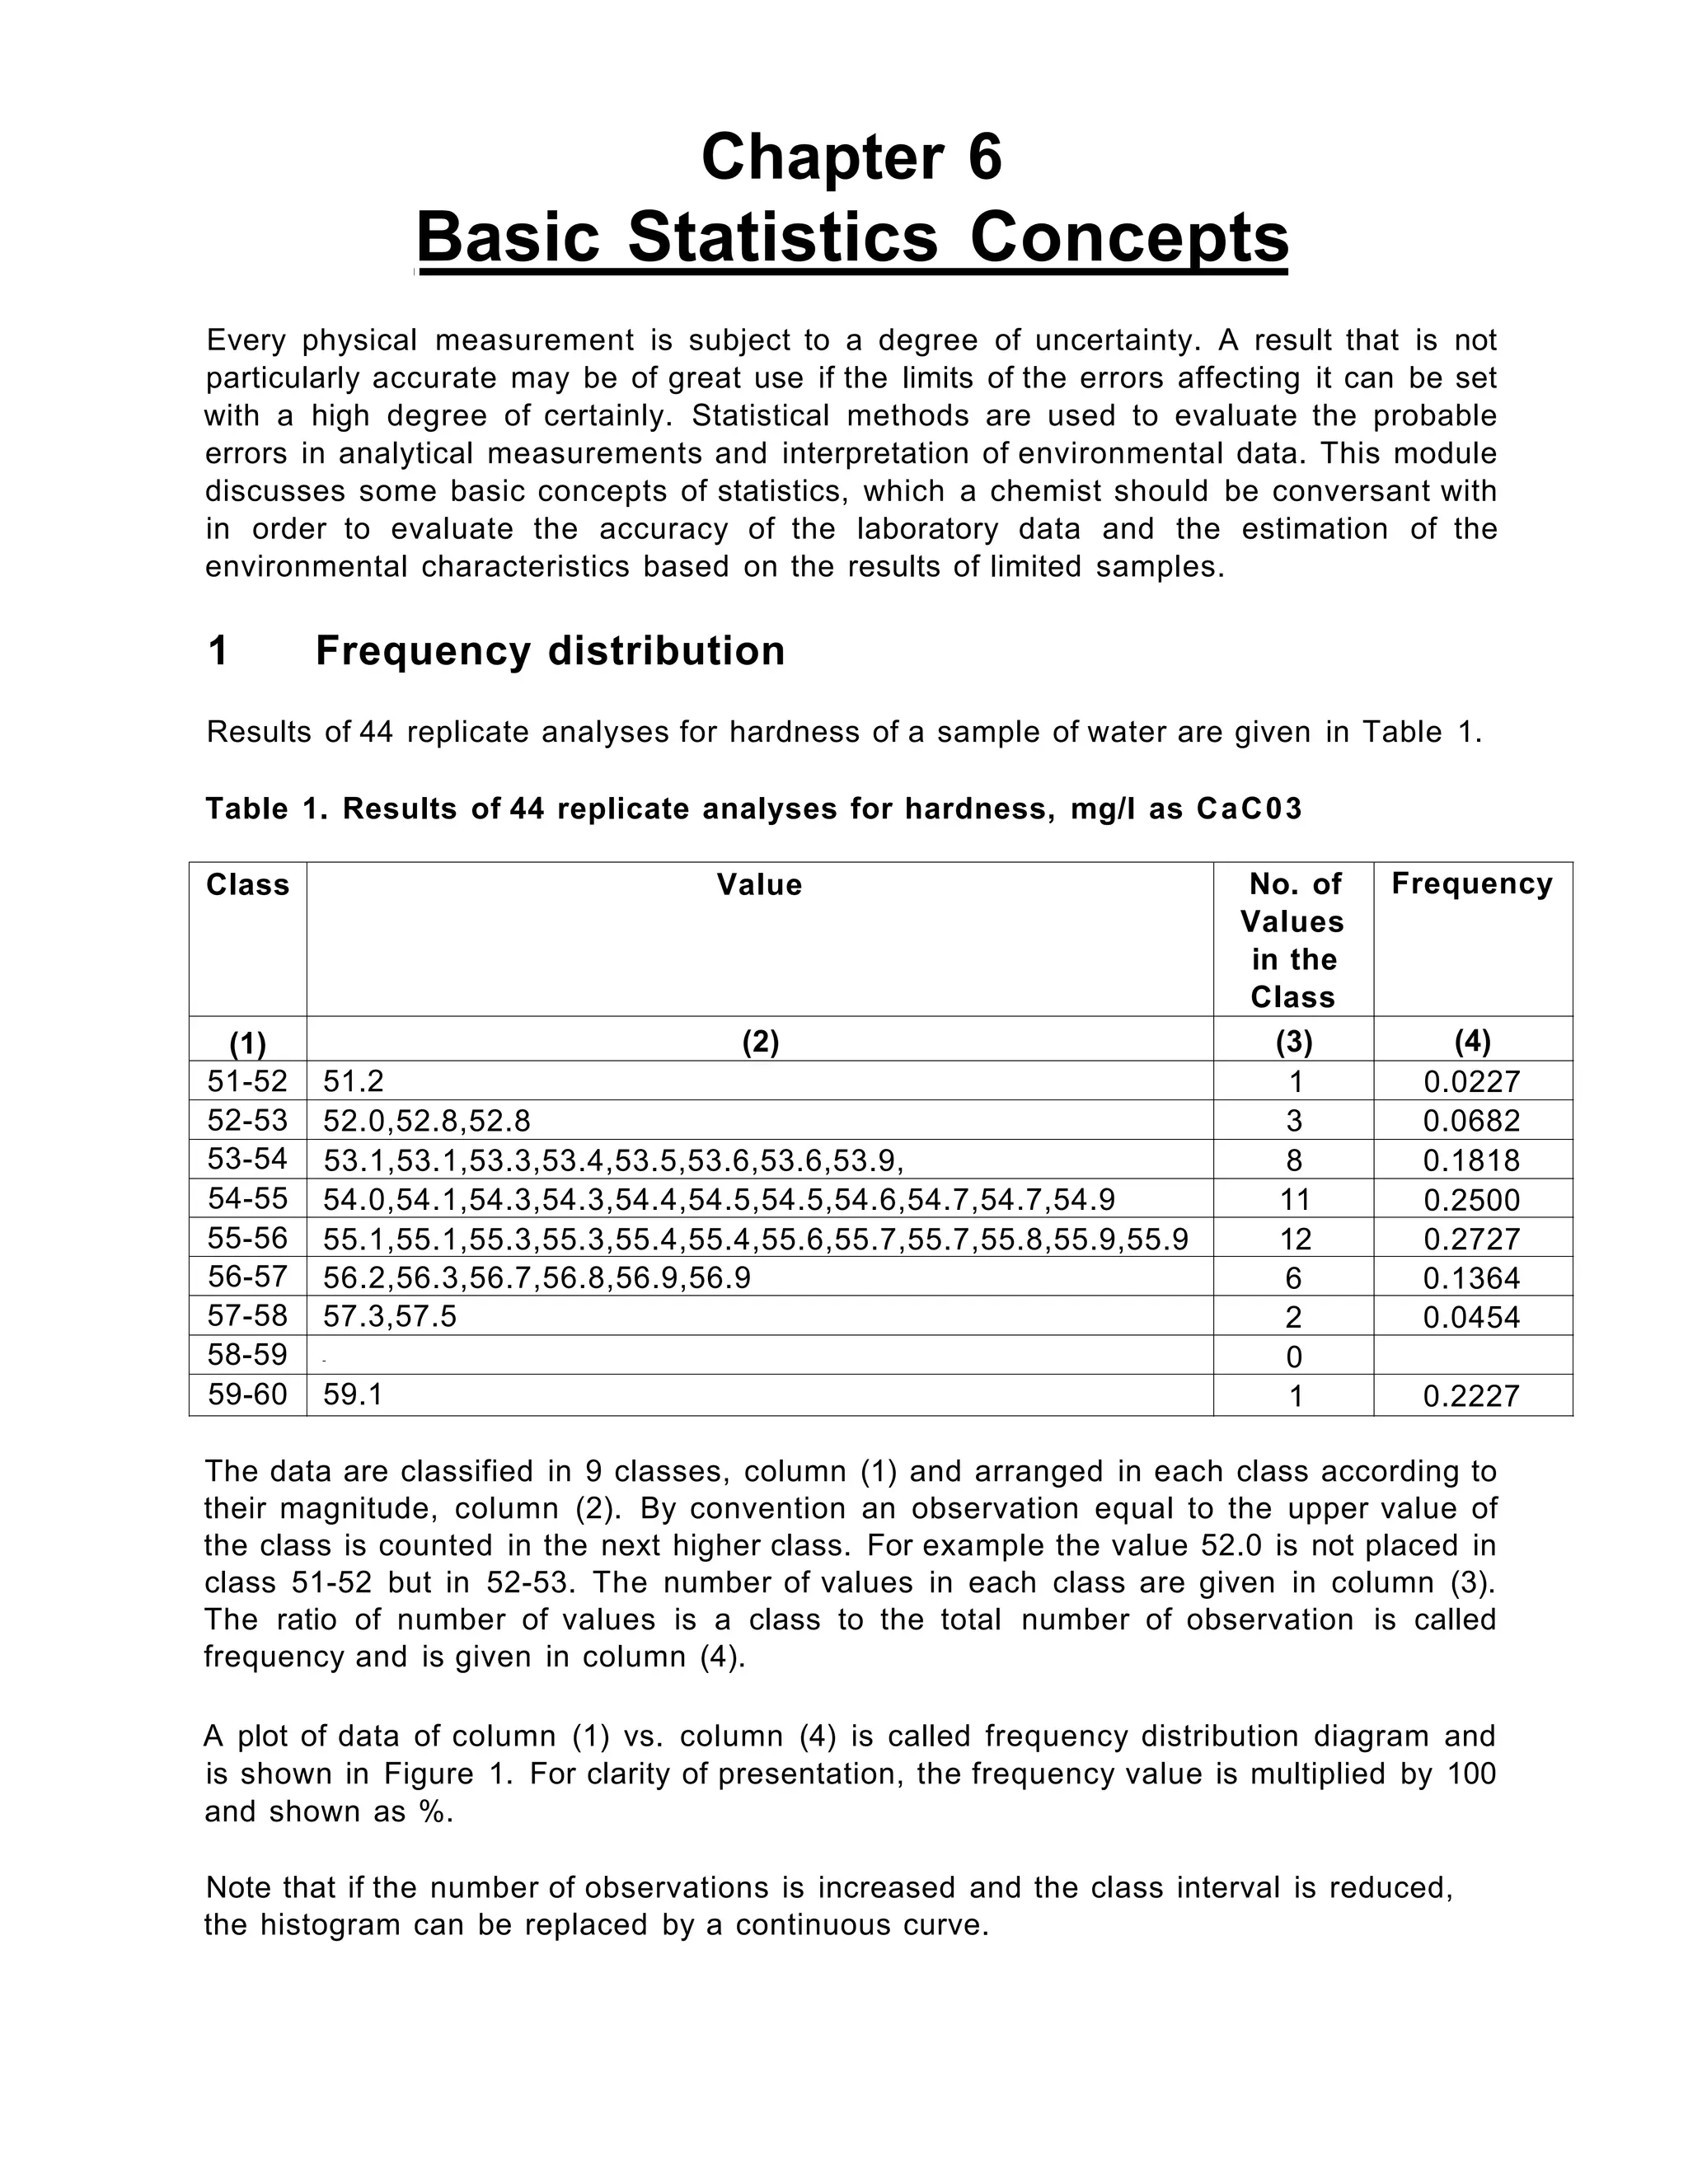
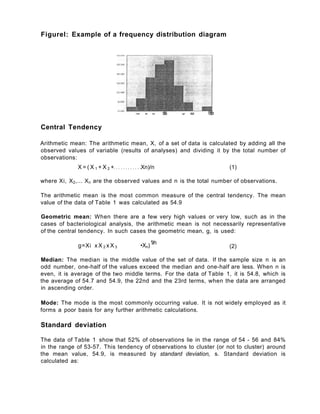
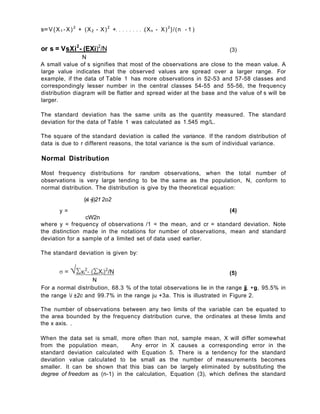
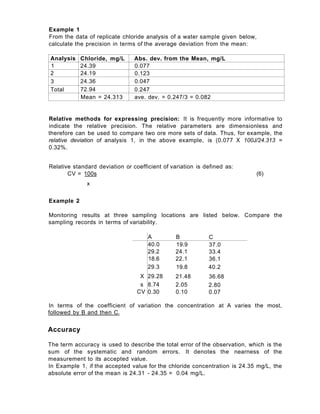
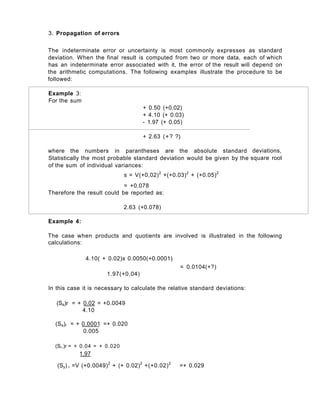

The document discusses basic statistical concepts used to analyze environmental data. It provides an example of a frequency distribution based on 44 replicate analyses of water hardness. The data are classified into ranges and the number of values in each range are used to calculate the frequency. Central tendencies like the mean, median, and mode are defined. Standard deviation is described as a measure of how data points are clustered around the mean. The concept of normal distribution is introduced. Precision is defined as the reproducibility of results and accuracy as the closeness to the accepted value. Methods to calculate and express precision both absolutely and relatively are presented. The propagation of errors when results involve sums, differences, products and quotients is demonstrated through examples.