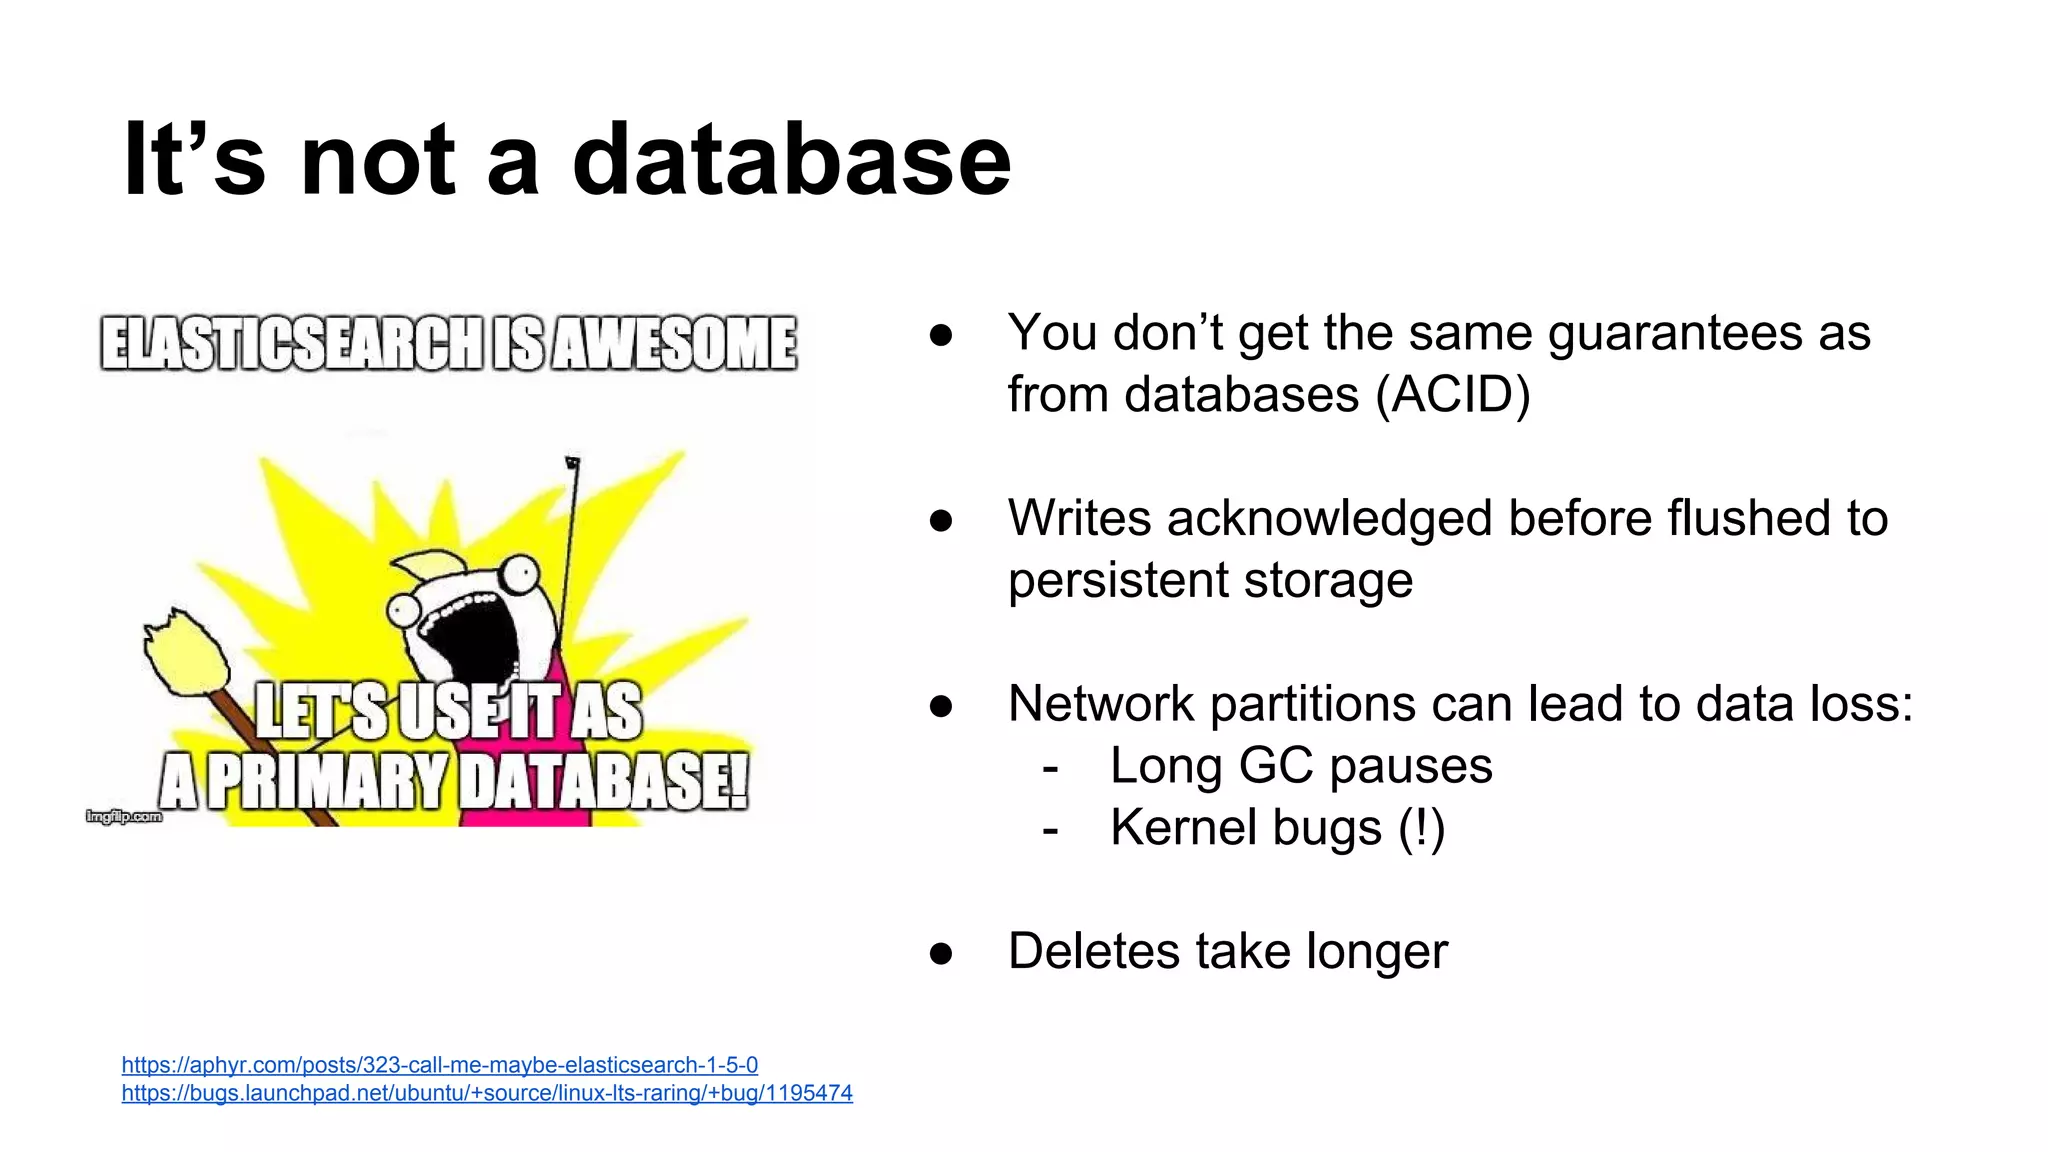
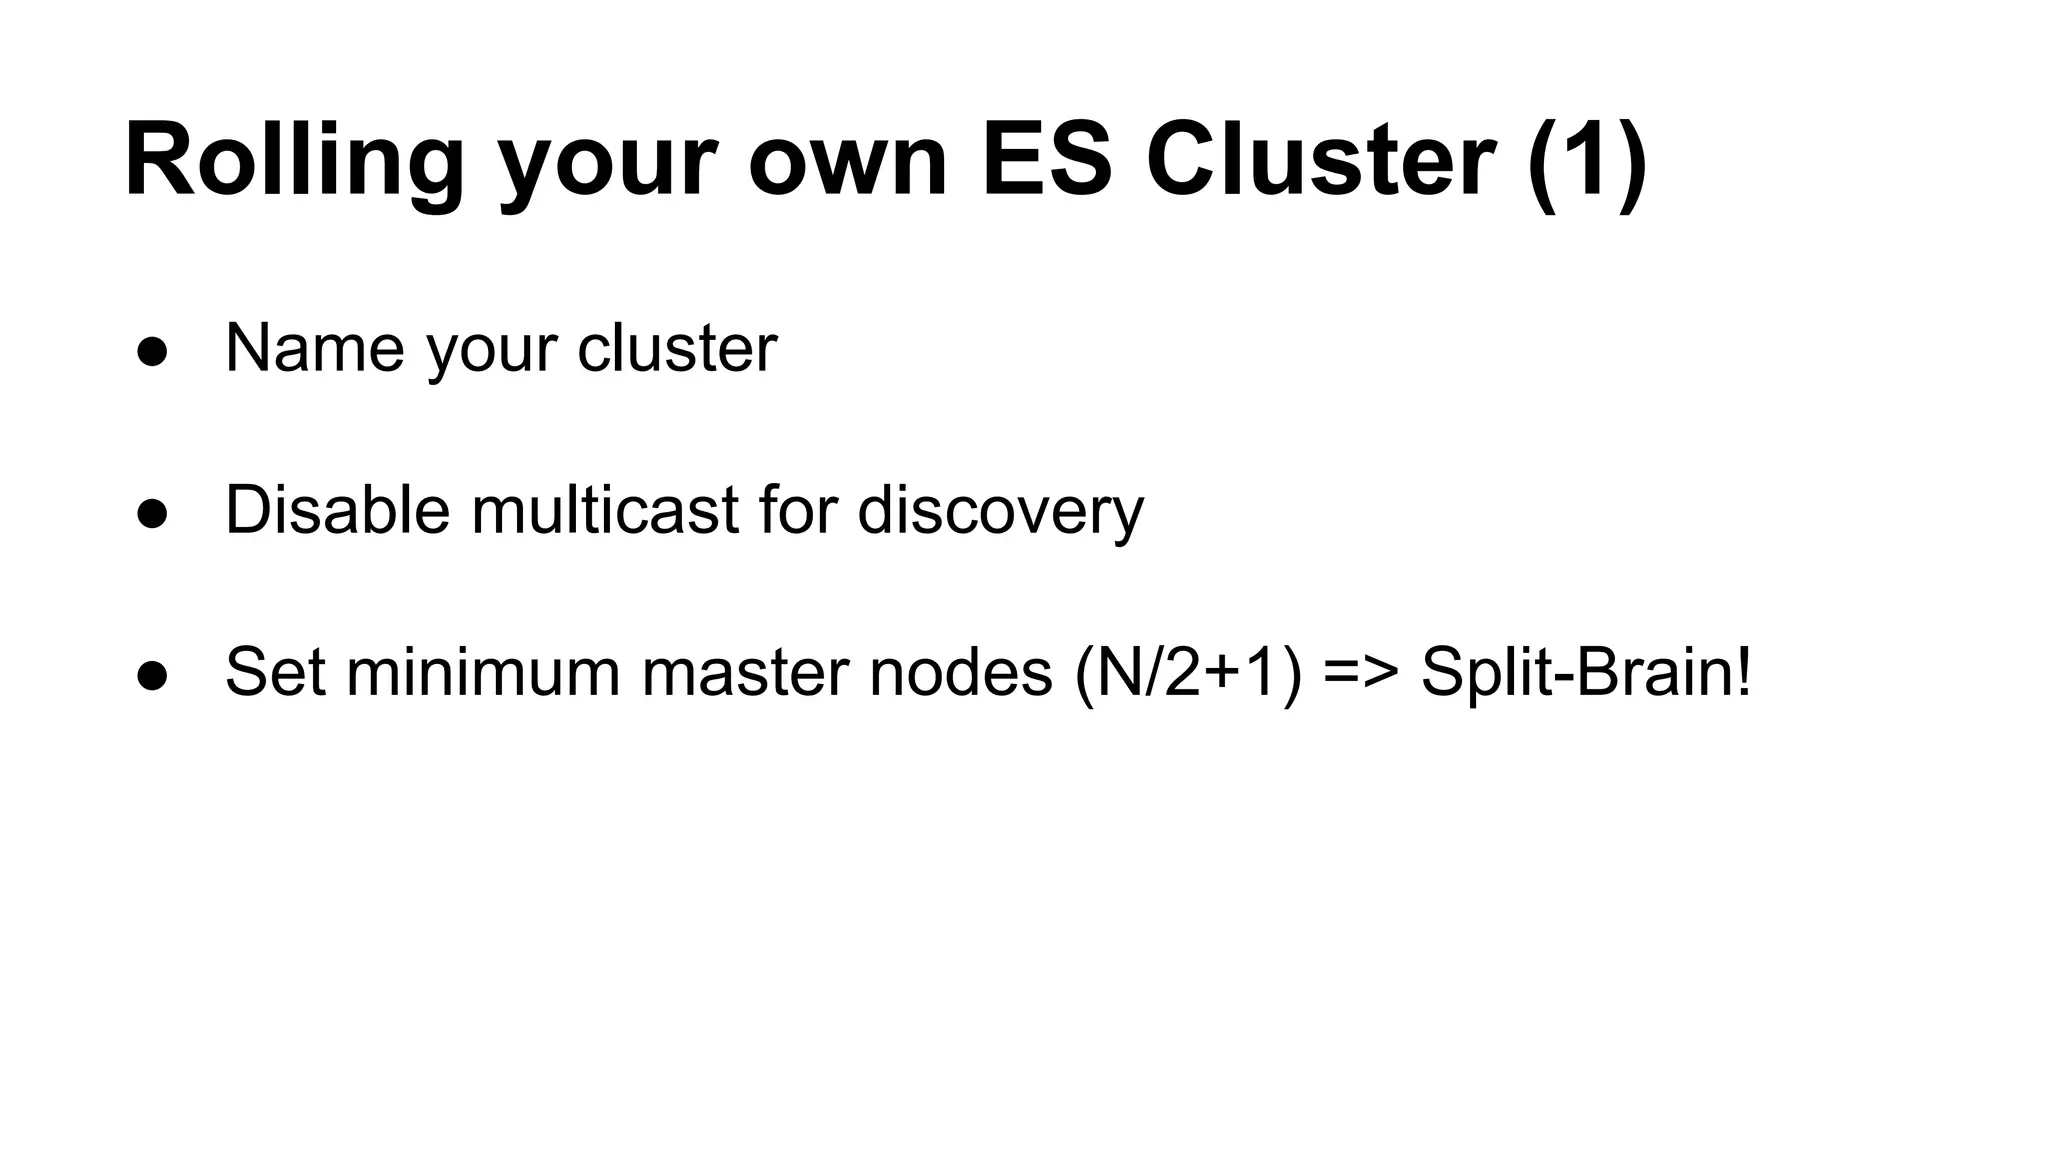
ElasticSearch 101
Setting up, configuring and tuning your ElasticSearch
cluster
Our ElasticSearch setup
Client
node
Client
node
Data
node
Data
node
Data
node
Apps
● 8 cores, 30GB
RAM, 2TB EBS
● Running in Docker
● Apache Mesos /
Marathon
● Dedicated DN
machines
https://aphyr.com/posts/323-call-me-maybe-elasticsearch-1-5-0
https://bugs.launchpad.net/ubuntu/+source/linux-lts-raring/+bug/1195474
It’s not a database
● You don’t get the same guarantees as
from databases (ACID)
● Writes acknowledged before flushed to
persistent storage
● Network partitions can lead to data loss:
- Long GC pauses
- Kernel bugs (!)
● Deletes take longer
Rolling your own ES Cluster (1)
● Name your cluster
● Disable multicast for discovery
● Set minimum master nodes (N/2+1) => Split-Brain!
● Check open file descriptors limit
● Disable swap (or mlockall)
● Configure gateway settings
○ recover_after_time
○ expected_nodes
● Avoid tribe nodes
Rolling your own ES Cluster (2)
Exhausting available JVM heap mem
Nodes will become
unresponsive!
Memory requirements
● Bottom peaks of the used
JVM heap after the GC
run mark the required
memory (add safety
buffer)
● At least 4GB per node
● 50% for JVM, 50% for FS
cache / Lucene
JVM settings
● Define heap memory (ES_HEAP_SIZE)
● Don’t tune JVM settings
● Don’t tune thread pool
■ In some case you might have to
■ Increasing will introduce memory pressure
● Don’t use G1 garbage collector
Indexing data
● Define data schemas and types ≠ Schemaless
○ Default: string mapping = analyzed = memory costly
○ Understand tokenizers and analyzers
● Prefer bulk indexing
● Refresh interval
● Time based indexes for log data
Querying for data
● Use filters as much as possible
● `Scan & scroll` for dumping large data, e.g. when
reindexing
● Transform data during indexing if possible
● ORMs make debugging a pain.
https://www.found.no/foundation/optimizing-elasticsearch-searches/
https://abhishek376.wordpress.com/2014/11/24/how-we-optimized-100-sec-elasticsearch-queries-to-be-under-a-sub-second/
Avoid high cardinality fields
● Aggregation => field data
● Often major consumer of heap
memory
● Use doc values (on disk field data)
● Avoid aggregation on analyzed
fields
More things to watch out
● Cluster health (duh!)
● Field data cache size
● Filter cache eviction
● Slow queries
● GC pauses
● Security settings
○ no authentication by default
● Backup
Tooling
● Use official SDKs
● For Go we use ElastiGo (not so great)
● Elastic HQ
● Inquisitor
● Sense

Elasticsearch 101 - Cluster setup and tuning

  • 1.
    ElasticSearch 101 Setting up,configuring and tuning your ElasticSearch cluster
  • 2.
    Our ElasticSearch setup Client node Client node Data node Data node Data node Apps ●8 cores, 30GB RAM, 2TB EBS ● Running in Docker ● Apache Mesos / Marathon ● Dedicated DN machines
  • 3.
    https://aphyr.com/posts/323-call-me-maybe-elasticsearch-1-5-0 https://bugs.launchpad.net/ubuntu/+source/linux-lts-raring/+bug/1195474 It’s not adatabase ● You don’t get the same guarantees as from databases (ACID) ● Writes acknowledged before flushed to persistent storage ● Network partitions can lead to data loss: - Long GC pauses - Kernel bugs (!) ● Deletes take longer
  • 4.
    Rolling your ownES Cluster (1) ● Name your cluster ● Disable multicast for discovery ● Set minimum master nodes (N/2+1) => Split-Brain!
  • 5.
    ● Check openfile descriptors limit ● Disable swap (or mlockall) ● Configure gateway settings ○ recover_after_time ○ expected_nodes ● Avoid tribe nodes Rolling your own ES Cluster (2)
  • 6.
    Exhausting available JVMheap mem Nodes will become unresponsive!
  • 7.
    Memory requirements ● Bottompeaks of the used JVM heap after the GC run mark the required memory (add safety buffer) ● At least 4GB per node ● 50% for JVM, 50% for FS cache / Lucene
  • 8.
    JVM settings ● Defineheap memory (ES_HEAP_SIZE) ● Don’t tune JVM settings ● Don’t tune thread pool ■ In some case you might have to ■ Increasing will introduce memory pressure ● Don’t use G1 garbage collector
  • 9.
    Indexing data ● Definedata schemas and types ≠ Schemaless ○ Default: string mapping = analyzed = memory costly ○ Understand tokenizers and analyzers ● Prefer bulk indexing ● Refresh interval ● Time based indexes for log data
  • 10.
    Querying for data ●Use filters as much as possible ● `Scan & scroll` for dumping large data, e.g. when reindexing ● Transform data during indexing if possible ● ORMs make debugging a pain. https://www.found.no/foundation/optimizing-elasticsearch-searches/ https://abhishek376.wordpress.com/2014/11/24/how-we-optimized-100-sec-elasticsearch-queries-to-be-under-a-sub-second/
  • 11.
    Avoid high cardinalityfields ● Aggregation => field data ● Often major consumer of heap memory ● Use doc values (on disk field data) ● Avoid aggregation on analyzed fields
  • 12.
    More things towatch out ● Cluster health (duh!) ● Field data cache size ● Filter cache eviction ● Slow queries ● GC pauses ● Security settings ○ no authentication by default ● Backup
  • 13.
    Tooling ● Use officialSDKs ● For Go we use ElastiGo (not so great) ● Elastic HQ ● Inquisitor ● Sense