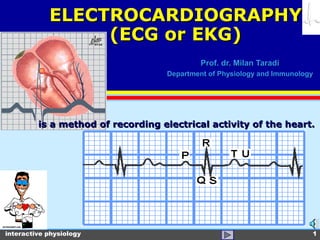
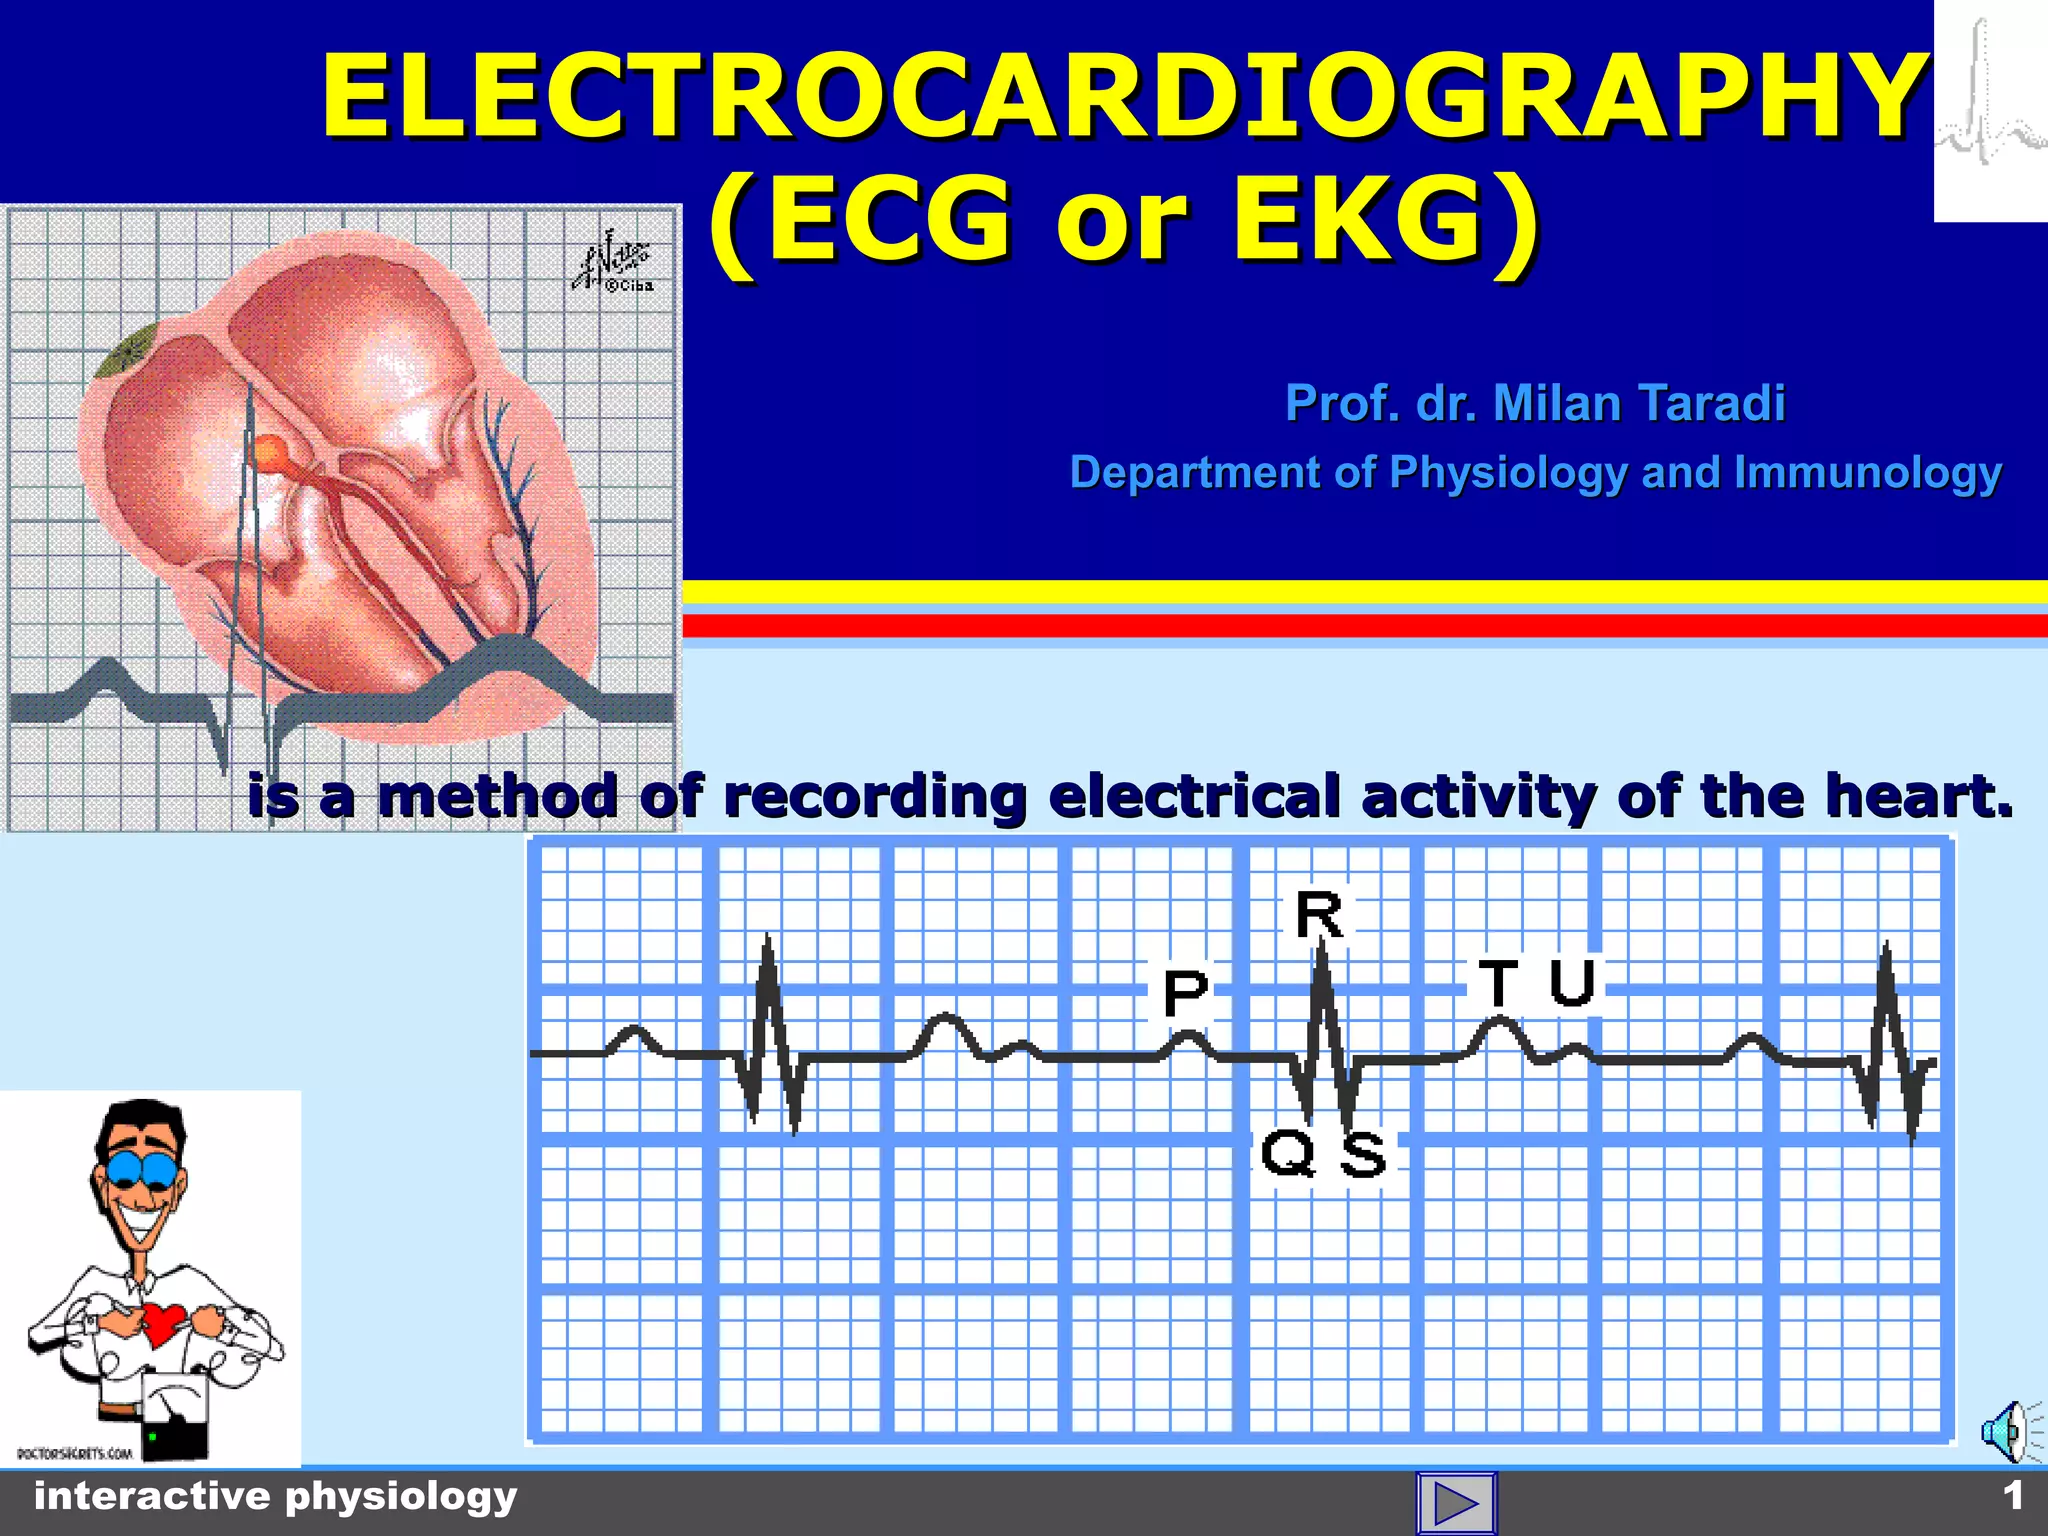
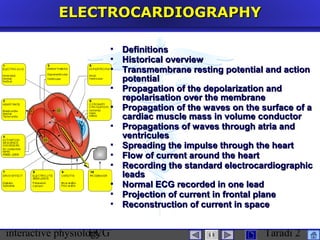
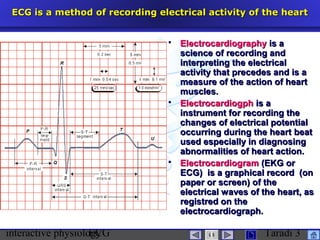
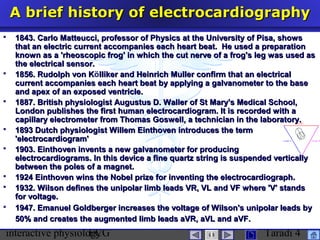
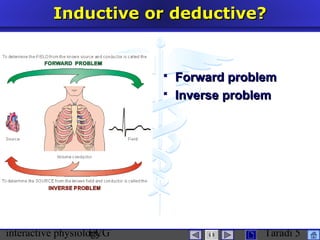
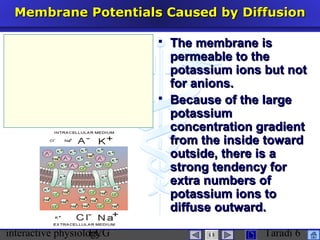
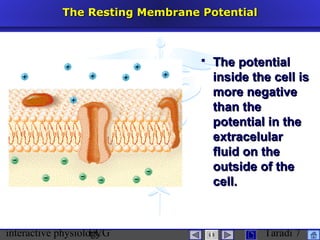
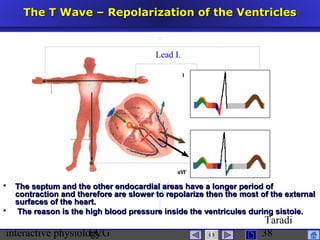
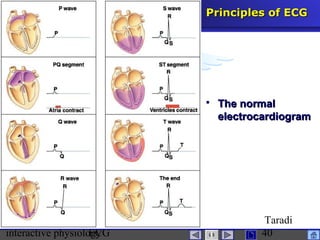
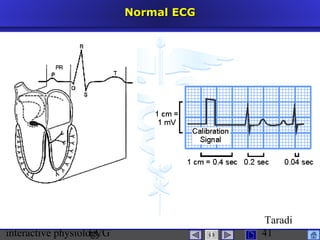
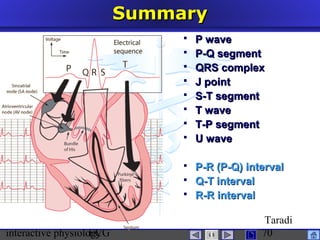
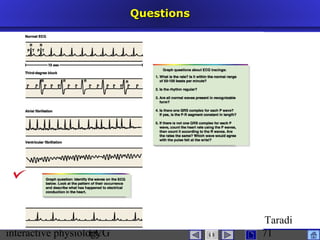
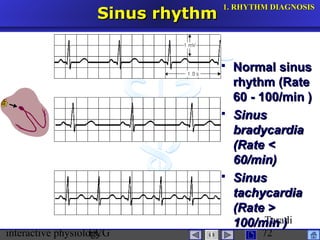
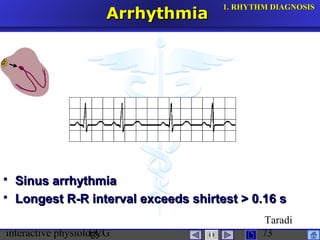
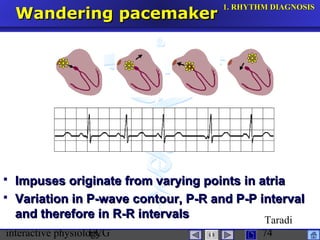
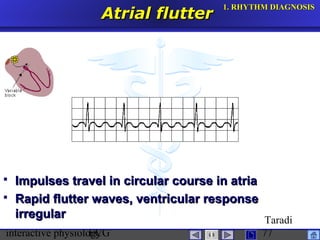
interactive physiology 1
Prof. dr. Milan TaradiProf. dr. Milan Taradi
Department of Physiology and ImmunologyDepartment of Physiology and Immunology
is a method of recording electrical activity of the heart.is a method of recording electrical activity of the heart.
ELECTROCARDIOGRAPHYELECTROCARDIOGRAPHY
(ECG or EKG)(ECG or EKG)
interactive physiologyECG Taradi 2
ELECTROCARDIOGRAPHYELECTROCARDIOGRAPHY
 DefinitionsDefinitions
 Historical overviewHistorical overview
 Transmembrane resting potential and actionTransmembrane resting potential and action
potentialpotential
 Propagation of the depolarization andPropagation of the depolarization and
repolarisation over the membranerepolarisation over the membrane
 Propagation of the waves on the surface of aPropagation of the waves on the surface of a
cardiac muscle mass in volume conductorcardiac muscle mass in volume conductor
 Propagations of waves through atria andPropagations of waves through atria and
ventriculesventricules
 Spreading the impulse through the heartSpreading the impulse through the heart
 Flow of current around the heartFlow of current around the heart
 Recording the standard electrocardiographicRecording the standard electrocardiographic
leadsleads
 Normal ECG recorded in one leadNormal ECG recorded in one lead
 Projection of current in frontal planeProjection of current in frontal plane
 Reconstruction of current in spaceReconstruction of current in space
interactive physiologyECG Taradi 3
ECG is a method of recording electrical activity of the heartECG is a method of recording electrical activity of the heart
 ElectrocardiographyElectrocardiography is ais a
science of recording andscience of recording and
interpreting the electricalinterpreting the electrical
activity that precedes and is aactivity that precedes and is a
measure of the action of heartmeasure of the action of heart
muscles.muscles.
 ElectrocardiogphElectrocardiogph is ais a
instrument for recording theinstrument for recording the
changes of electrical potentialchanges of electrical potential
occurring during the heartoccurring during the heart beatbeat
used especially in diagnosingused especially in diagnosing
abnormalities of heart action.abnormalities of heart action.
 ElectrocardiogramElectrocardiogram (EKG or(EKG or
ECG) is a graphical record (onECG) is a graphical record (on
paper or screen) of thepaper or screen) of the
electrical waves of the heart, aselectrical waves of the heart, as
registred on theregistred on the
electrocardiograph.electrocardiograph.
interactive physiologyECG Taradi 4
A brief history of electrocardiographyA brief history of electrocardiography
 1843. Carlo Matteucci, professor of Physics at the University of Pisa, shows1843. Carlo Matteucci, professor of Physics at the University of Pisa, shows
that an electric current accompanies each heart beat. He used a preparationthat an electric current accompanies each heart beat. He used a preparation
known as a 'rheoscopic frog' in which the cut nerve of a frog's leg was used asknown as a 'rheoscopic frog' in which the cut nerve of a frog's leg was used as
the electrical sensor.the electrical sensor.
 1856. Rudolph von K1856. Rudolph von Kölliker and Heinrich Muller confirm that an electricallliker and Heinrich Muller confirm that an electrical
current accompanies each heart beat by applying a galvanometer to the basecurrent accompanies each heart beat by applying a galvanometer to the base
and apex of an exposed ventricle.and apex of an exposed ventricle.
 1887. British physiologist Augustus D. Waller of St Mary's Medical School,1887. British physiologist Augustus D. Waller of St Mary's Medical School,
London publishes the first human electrocardiogram. It is recorded with aLondon publishes the first human electrocardiogram. It is recorded with a
capillary electrometer from Thomas Goswell, a technician in the laboratory.capillary electrometer from Thomas Goswell, a technician in the laboratory.
 1893 Dutch physiologist Willem Einthoven introduces the term1893 Dutch physiologist Willem Einthoven introduces the term
'electrocardiogram''electrocardiogram'
 1903. Einthoven invents a new galvanometer for producing1903. Einthoven invents a new galvanometer for producing
electrocardiograms. In this device a fine quartz string is suspended verticallyelectrocardiograms. In this device a fine quartz string is suspended vertically
between the poles of a magnet.between the poles of a magnet.
 1924 Einthoven wins the Nobel prize for inventing the electrocardiograph.1924 Einthoven wins the Nobel prize for inventing the electrocardiograph.
 1932. Wilson defines the unipolar limb leads VR, VL and VF where 'V' stands1932. Wilson defines the unipolar limb leads VR, VL and VF where 'V' stands
for voltage.for voltage.
 1947. Emanuel Goldberger increases the voltage of Wilson's unipolar leads by1947. Emanuel Goldberger increases the voltage of Wilson's unipolar leads by
50% and creates the augmented limb leads aVR, aVL and aVF.50% and creates the augmented limb leads aVR, aVL and aVF.
interactive physiologyECG Taradi 5
Inductive or deductive?Inductive or deductive?
 Forward problemForward problem
 Inverse problemInverse problem
interactive physiologyECG Taradi 6
Membrane Potentials Caused by DiffusionMembrane Potentials Caused by Diffusion
 The membrane isThe membrane is
permeable to thepermeable to the
potassium ions but notpotassium ions but not
for anions.for anions.
 Because of the largeBecause of the large
potassiumpotassium
concentration gradientconcentration gradient
from the inside towardfrom the inside toward
outside, there is aoutside, there is a
strong tendency forstrong tendency for
extra numbers ofextra numbers of
potassium ions topotassium ions to
diffuse outward.diffuse outward.
interactive physiologyECG Taradi 7
The Resting Membrane PotentialThe Resting Membrane Potential
 The potentialThe potential
inside the cell isinside the cell is
more negativemore negative
than thethan the
potential in thepotential in the
extracelularextracelular
fluid on thefluid on the
outside of theoutside of the
cell.cell.
interactive physiologyECG Taradi 8
Membrane Potentials Caused by DiffusionMembrane Potentials Caused by Diffusion
 The membrane is semipermeable for the ions.The membrane is semipermeable for the ions.
 Concentration gradients exist.Concentration gradients exist.
 The stady state of gradients is maintained by the pump.The stady state of gradients is maintained by the pump.
 There is a lot of nondiffusible anions inside the cell.There is a lot of nondiffusible anions inside the cell.
diffusion of Na+
diffusion of K+
3 Na3 Na++
2 K+
ATP
Mg++
ADP + Pi
ICT
interactive physiologyECG Taradi 9
Contributions of the NaContributions of the Na++
-K-K++
PumpPump
 NaNa++
-K-K++
pump ispump is
electrogenic.electrogenic.
 There isThere is
continuouscontinuous
pumping of 3 Napumping of 3 Na++
to outside forto outside for
each 2 Keach 2 K++
pumpedpumped
to the inside ofto the inside of
the membrane.the membrane.
interactive physiologyECG
Taradi
10
Recording Membrane Potentials and ActionRecording Membrane Potentials and Action
PotentialsPotentials
0
-
 The micropipetteThe micropipette
(active electrode)(active electrode)
is inserted intois inserted into
the interior of thethe interior of the
cell.cell.
 The otherThe other
electrode is onelectrode is on
infinite distance,infinite distance,
on potential 0 V.on potential 0 V.
 MonophasicMonophasic
potential ispotential is
recorded on therecorded on the
one spot of theone spot of the
membrane.membrane.
interactive physiologyECG
Taradi
11
Recording Biphasic PotentialRecording Biphasic Potential
 TwoTwo
electrodes areelectrodes are
placed outsideplaced outside
the cell.the cell.
 BiphasicBiphasic
potential ispotential is
recorded.recorded.
 BothBoth
electrodes areelectrodes are
active.active.
0
interactive physiologyECG
Taradi
12
Monophasic Action Potential ofMonophasic Action Potential of
myocytemyocyte
interactive physiologyECG
Taradi
13
Monophasic Action Potential of Ventricular CellMonophasic Action Potential of Ventricular Cell
interactive physiologyECG
Taradi
15
Pacemaker Potentials in Sinus NodePacemaker Potentials in Sinus Node
interactive physiologyECG
Taradi
16
Propagations of action potentialsPropagations of action potentials
 The action potentialThe action potential
elicited at any pointelicited at any point
excites adjacentexcites adjacent
portions of theportions of the
membrane in allmembrane in all
directions.directions.
 Depolarization waveDepolarization wave
 Repolarization waveRepolarization wave
 No potential is recordedNo potential is recorded
when the cell is eitherwhen the cell is either
completely polarized orcompletely polarized or
depolarized.depolarized.
- +
- +
- +
- +
- +
+++++++++++++++++++++
----------------------
---------+++++++++++++
++++++++--------------
---------------------- ++++++++++
+++++++++++
+++++++++-------------
----------++++++++++++
++++++++++++++++++++
----------------------
interactive physiologyECG
Taradi
17
Principles of Vectorial AnalysisPrinciples of Vectorial Analysis
 Resultant vector depends on the length of the vector andResultant vector depends on the length of the vector and
the angle between the lead axis and the vector (projectedthe angle between the lead axis and the vector (projected
vector = length x cos of an angle)vector = length x cos of an angle)
 Also, resultant vector is diminish with the square of axisAlso, resultant vector is diminish with the square of axis
distance.distance.
interactive physiologyECG
Taradi
18
Depolarization waveDepolarization wave
 Depolarizations has extended over the entireDepolarizations has extended over the entire
muscle cell.muscle cell.
interactive physiologyECG
Taradi
19
Cardiac muscle is a functional syncycium.Cardiac muscle is a functional syncycium.
 The cardiac muscle cells are joined end toThe cardiac muscle cells are joined end to
end by specialized cell junction calledend by specialized cell junction called
intercalated discs.intercalated discs.
interactive physiologyECG
Taradi
20
Depolarization wave in the muscle massDepolarization wave in the muscle mass
 The potentials developed on the surface of cardiacThe potentials developed on the surface of cardiac
muscle mass.muscle mass.
interactive physiologyECG
Taradi
21
The genesis of theThe genesis of the
electrocardiogramelectrocardiogram
 Propagation of thePropagation of the
action potential inaction potential in
the group ofthe group of
myocytesmyocytes
interactive physiologyECG
Taradi
22
Activation frontActivation front
 The signal producedThe signal produced
by the propagatingby the propagating
activation frontactivation front
between a pair ofbetween a pair of
extracellularextracellular
electrodes.electrodes.
interactive physiologyECG
Taradi
23
Propagation of action potentials in cardiac musclePropagation of action potentials in cardiac muscle
 vectorsvectors
 resultant vectorresultant vector
 depolarizationdepolarization
wavewave
interactive physiologyECG
Taradi
24
The Hart is in Volume ConductorThe Hart is in Volume Conductor
 Flow of electrical currents in the chest aroundFlow of electrical currents in the chest around
the heart.the heart.
interactive physiologyECG
Taradi
25
The record depends on the locations of electrodesThe record depends on the locations of electrodes
 It is crucialIt is crucial
where towhere to
placeplace
electrode.electrode.
interactive physiologyECG
Taradi
26
Standard Axes of the three bipolar leadsStandard Axes of the three bipolar leads
interactive physiologyECG
Taradi
27
Cardiac Conductive SystemCardiac Conductive System
 sinus node (sinoatrialsinus node (sinoatrial
node)node)
 internodal pathwaysinternodal pathways
 anterior interatrial
band (Bachman)
 anterior, middle and
posterior internodal
pathways
 atrioventricular nodeatrioventricular node
 transitional fibers
 A-V node
 AV-bundle (His)AV-bundle (His)
 penetrating portion
 distal portion
 Purkinje systemPurkinje system
 left bundle branch
 right bundle branch
interactive physiologyECG
Taradi
28
Summary of the Spread of Cardiac Impulse TroughSummary of the Spread of Cardiac Impulse Trough
the Heartthe Heart
interactive physiologyECG
Taradi
29
The P wave – Depolarization of the AtriaThe P wave – Depolarization of the Atria
 Depolarization of the atria andDepolarization of the atria and
generation of the P wavegeneration of the P wave
6
1
2
3
4
5
1
2 3
4
5
6
1 6
interactive physiologyECG
Taradi
30
The cathode ray tubeThe cathode ray tube
 produces theproduces the
vectorcardiogramvectorcardiogram
in the frontalin the frontal
plane from theplane from the
Einthoven limbEinthoven limb
leads.leads.
interactive physiologyECG
Taradi
31
Vectorial Analysis of the Normal ECGVectorial Analysis of the Normal ECG
(Vectorcardiograms)(Vectorcardiograms)
P QRS
T
interactive physiologyECG
Taradi
32
The P wave - Depolarization of the AtriaThe P wave - Depolarization of the Atria
Lead I.
interactive physiologyECG
Taradi
33
Transmission of the cardiac impulse from the atriaTransmission of the cardiac impulse from the atria
to the ventricleto the ventricle
interactive physiologyECG
Taradi
34
The QRS complex – Depolarization of the VentriclesThe QRS complex – Depolarization of the Ventricles
 The QRS complex is often composed of three separateThe QRS complex is often composed of three separate
waves.waves.
Lead I.
interactive physiologyECG
Taradi
35
The R waveThe R wave
Lead I.
interactive physiologyECG
Taradi
37
The J Point – The Zero Reference PotentialThe J Point – The Zero Reference Potential
 The damaged part of the heart muscle is partially or totally depolarized all the time.The damaged part of the heart muscle is partially or totally depolarized all the time.
Lead I.
0
interactive physiologyECG
Taradi
38
The T Wave – Repolarization of the VentriclesThe T Wave – Repolarization of the Ventricles
 The septum and the other endocardial areas have a longer period ofThe septum and the other endocardial areas have a longer period of
contraction and therefore are slower to repolarize then the most of the externalcontraction and therefore are slower to repolarize then the most of the external
surfaces of the heart.surfaces of the heart.
 The reason is the high blood pressure inside the ventricules during sistole.The reason is the high blood pressure inside the ventricules during sistole.
Lead I.
interactive physiologyECG
Taradi
39
Principles of ECGPrinciples of ECG
Ecg.swf
interactive physiologyECG
Taradi
40
 The normalThe normal
electrocardiogramelectrocardiogram
Principles of ECGPrinciples of ECG
interactive physiologyECG
Taradi
41
Normal ECGNormal ECG
interactive physiologyECG
Taradi
42
Normal ECGNormal ECG
interactive physiologyECG
Taradi
43
The J PointThe J Point
 The zero referenceThe zero reference
potential for analyzingpotential for analyzing
current of injurycurrent of injury
 The damaged part ofThe damaged part of
the heart muscle isthe heart muscle is
partially or totallypartially or totally
depolarized all thedepolarized all the
time.time.
interactive physiologyECG
Taradi
44
Waves, complexes, intervals, segmentsWaves, complexes, intervals, segments
interactive physiologyECG
Taradi
45
Intervals of the ECGIntervals of the ECG
interactive physiologyECG
Taradi
46
The Determination of the Rate of HeartbeatThe Determination of the Rate of Heartbeat
interactive physiologyECG
Taradi
47
TachycardiaTachycardia
interactive physiologyECG
Taradi
48
The standard bipolar Leads are in frontal plane.The standard bipolar Leads are in frontal plane.
interactive physiologyECG
Taradi
49
Standard Bipolar LeadsStandard Bipolar Leads
 The system is threeaxial.The system is threeaxial.
interactive physiologyECG
Taradi
50
Einthoven´s triangleEinthoven´s triangle
Einthoven´s lawEinthoven´s law
I + III = III + III = II
interactive physiologyECG
Taradi
51
Standard leadsStandard leads
interactive physiologyECG
Taradi
52
Augmented Unipolar Limb LeadsAugmented Unipolar Limb Leads
interactive physiologyECG
Taradi
53
Augmented Unipolar Limb LeadsAugmented Unipolar Limb Leads
 Axes of the unipolar leadsAxes of the unipolar leads
interactive physiologyECG
Taradi
54
The Standard Limbs LeadsThe Standard Limbs Leads
 The ECG is very similar in all leads .The ECG is very similar in all leads .
interactive physiologyECG
Taradi
55
Normal ECGNormal ECG
interactive physiologyECG
Taradi
56
The axes of three standard bipolar leadsThe axes of three standard bipolar leads
interactive physiologyECG
Taradi
57
The axis deviationThe axis deviation
interactive physiologyECG
Taradi
58
Normal range of the mean electrical axisNormal range of the mean electrical axis
interactive physiologyECG
Taradi
59
Normal ECG (left-sided axis)Normal ECG (left-sided axis)
interactive physiologyECG
Taradi
60
Normal ECG (vertical axis)Normal ECG (vertical axis)
interactive physiologyECG
Taradi
61
Standard LimbStandard Limb
interactive physiologyECG
Taradi
62
The body planesThe body planes
interactive physiologyECG
Taradi
63
Precordial leadsPrecordial leads
 UnipolarUnipolar
chest leadschest leads
interactive physiologyECG
Taradi
64
Precordial Leads AxisPrecordial Leads Axis
interactive physiologyECG
Taradi
65
Precordial LeadsPrecordial Leads
interactive physiologyECG
Taradi
66
All Leads and AxisAll Leads and Axis
 Lead I.Lead I. STANDARDSTANDARD
 Lead II. (3)Lead II. (3)
 Lead III.Lead III.
 aVRaVR AUGMENTEDAUGMENTED
 aVL (3)aVL (3)
 aVFaVF
 VV11 PRECORDIALPRECORDIAL
 VV22 (6)(6)
 VV33
 VV44
 VV55
 VV66
 total (12)total (12)
interactive physiologyECG
Taradi
67
Complete ECG in 12 LeadsComplete ECG in 12 Leads
interactive physiologyECG
Taradi
68
The relationship of ECG and Heart CycleThe relationship of ECG and Heart Cycle
interactive physiologyECG
Taradi
69
Relationship of ECG and Heart CycleRelationship of ECG and Heart Cycle
interactive physiologyECG
Taradi
70
SummarySummary
 P waveP wave
 P-Q segmentP-Q segment
 QRS complexQRS complex
 J pointJ point
 S-T segmentS-T segment
 T waveT wave
 T-P segmentT-P segment
 U waveU wave
 P-R (P-Q) intervalP-R (P-Q) interval
 Q-T intervalQ-T interval
 R-R intervalR-R interval
interactive physiologyECG
Taradi
71
QuestionsQuestions
interactive physiologyECG
Taradi
72
Sinus rhythmSinus rhythm
 Normal sinusNormal sinus
rhythm (Raterhythm (Rate
60 - 100/min )60 - 100/min )
 SinusSinus
bradycardiabradycardia
(Rate <(Rate <
60/min)60/min)
 SinusSinus
tachycardiatachycardia
(Rate >(Rate >
100/min100/min ))
1.1. RHYTHM DIAGNOSISRHYTHM DIAGNOSIS
interactive physiologyECG
Taradi
73
ArrhythmiaArrhythmia
 Sinus arrhythmiaSinus arrhythmia
 Longest R-R interval exceeds shirtest > 0.16 sLongest R-R interval exceeds shirtest > 0.16 s
1.1. RHYTHM DIAGNOSISRHYTHM DIAGNOSIS
interactive physiologyECG
Taradi
74
Wandering pacemakerWandering pacemaker
 Impuses originate from varying points in atriaImpuses originate from varying points in atria
 Variation in P-wave contour, P-R and P-P intervalVariation in P-wave contour, P-R and P-P interval
and therefore in R-R intervalsand therefore in R-R intervals
1.1. RHYTHM DIAGNOSISRHYTHM DIAGNOSIS
interactive physiologyECG
Taradi
75
Ectopic beatEctopic beat
interactive physiologyECG
Taradi
76
Ectopic beatEctopic beat
interactive physiologyECG
Taradi
77
Atrial flutterAtrial flutter
 Impulses travel in circular course in atriaImpulses travel in circular course in atria
 Rapid flutter waves, ventricular responseRapid flutter waves, ventricular response
irregularirregular
1.1. RHYTHM DIAGNOSISRHYTHM DIAGNOSIS
interactive physiologyECG
Taradi
78
Atrial fibrillationAtrial fibrillation
 Impuses have chaotic, random pathways in atriaImpuses have chaotic, random pathways in atria
 Baseline irregular, ventricular response irregularBaseline irregular, ventricular response irregular
1.1. RHYTHM DIAGNOSISRHYTHM DIAGNOSIS
interactive physiologyECG
Taradi
79
Junctional rhythmJunctional rhythm
 Impuses originate at AV node with retrograde andImpuses originate at AV node with retrograde and
antegrade directionantegrade direction
 P-wave is often inverted, may be under or afterP-wave is often inverted, may be under or after
QRS complex, Heart rate is slowQRS complex, Heart rate is slow
1.1. RHYTHM DIAGNOSISRHYTHM DIAGNOSIS
interactive physiologyECG
Taradi
80
ArrhythmiaArrhythmia
 Premature ventricular contractionPremature ventricular contraction
 A single impulse originates at right ventricleA single impulse originates at right ventricle
 Time interval between normal R peaks is aTime interval between normal R peaks is a
multiple of R-R intervalsmultiple of R-R intervals
1.1. RHYTHM DIAGNOSISRHYTHM DIAGNOSIS
interactive physiologyECG
Taradi
81
Ventricular tachycardiaVentricular tachycardia
 Impulse originate at ventricular pacemakerImpulse originate at ventricular pacemaker
 Wide ventricular complexes, rate > 120/minWide ventricular complexes, rate > 120/min
1.1. RHYTHM DIAGNOSISRHYTHM DIAGNOSIS
interactive physiologyECG
Taradi
82
Ventricular fibrillationVentricular fibrillation
 Chaotic ventricular depolarizationChaotic ventricular depolarization
 Rapid, wide, irregular ventricular complexesRapid, wide, irregular ventricular complexes
1.1. RHYTHM DIAGNOSISRHYTHM DIAGNOSIS
interactive physiologyECG
Taradi
83
Ventricular DefibrillationVentricular Defibrillation
interactive physiologyECG
Taradi
84
Pacer rhythmPacer rhythm
 Impulses originate at transvenous pacemakerImpulses originate at transvenous pacemaker
 Wide ventricular complexes preceded byWide ventricular complexes preceded by
pacemaker spike. Rate is the pacer rhythmpacemaker spike. Rate is the pacer rhythm
1.1. RHYTHM DIAGNOSISRHYTHM DIAGNOSIS
interactive physiologyECG
Taradi
85
A-V blockA-V block
 First-degreeFirst-degree
(A-V(A-V
conductionconduction
lengthened )lengthened )
 Second-degreeSecond-degree
(Sudden(Sudden
dropped QRS-dropped QRS-
complex )complex )
 First-degreeFirst-degree
(Impulses(Impulses
originate at AVoriginate at AV
node andnode and
proceed toproceed to
ventricles)ventricles)
2.2. ACTIVATION SEQUENCEACTIVATION SEQUENCE
interactive physiologyECG
Taradi
86
Four Types of AV blockFour Types of AV block
2.2. ACTIVATION SEQUENCEACTIVATION SEQUENCE
interactive physiologyECG
Taradi
87
WPW syndromeWPW syndrome
2.2. ACTIVATION SEQUENCEACTIVATION SEQUENCE
interactive physiologyECG
Taradi
88
Right bundle-branch blockRight bundle-branch block
2.2. ACTIVATION SEQUENCEACTIVATION SEQUENCE
 QRSQRS
durationduration
greater thangreater than
0.12 s0.12 s
 Wide SWide S
wave inwave in
leads I, V5leads I, V5
and V6and V6
interactive physiologyECG
Taradi
89
Left bundle-branch blockLeft bundle-branch block
 QRS durationQRS duration
greater thangreater than
0.12 s0.12 s
 Wide S waveWide S wave
in leads V1in leads V1
and V2, wideand V2, wide
R wave in V5R wave in V5
and V6and V6
2.2. ACTIVATION SEQUENCEACTIVATION SEQUENCE
interactive physiologyECG
Taradi
90
Right atrial hypertrophyRight atrial hypertrophy
 Tall, peaked P wave inTall, peaked P wave in
leads I and IIleads I and II
3.3. HYPERTROPHYHYPERTROPHY
interactive physiologyECG
Taradi
91
Right ventricular hypertrophyRight ventricular hypertrophy
3.3. HYPERTROPHYHYPERTROPHY
 Large R wave in leads V1 and V3Large R wave in leads V1 and V3
 Large S wave in leads V5 and V6Large S wave in leads V5 and V6
interactive physiologyECG
Taradi
92
Left ventricular hypertrophyLeft ventricular hypertrophy
 Large S wave inLarge S wave in
leads V1 and V2leads V1 and V2
 Large R wave inLarge R wave in
leads V5 and V6leads V5 and V6
3.3. HYPERTROPHYHYPERTROPHY
interactive physiologyECG
Taradi
93
Left ventricular hypertrophyLeft ventricular hypertrophy
interactive physiologyECG
Taradi
94
Myocardial InfarctionMyocardial Infarction
 A. Normal ECG prior to MIA. Normal ECG prior to MI
 B. Hyperacute T wave changes -B. Hyperacute T wave changes -
increased T wave amplitude andincreased T wave amplitude and
width; may also see ST elevationwidth; may also see ST elevation
 C. Marked ST elevation withC. Marked ST elevation with
hyperacute T wave changeshyperacute T wave changes
(transmural injury)(transmural injury)
 D. Pathologic Q waves, less STD. Pathologic Q waves, less ST
elevation, terminal T waveelevation, terminal T wave
inversion (necrosis) (Pathologic Qinversion (necrosis) (Pathologic Q
waves are usually defined aswaves are usually defined as
duration >0.04 s or >25% of R-waveduration >0.04 s or >25% of R-wave
amplitude)amplitude)
 E. Pathologic Q waves, T waveE. Pathologic Q waves, T wave
inversion (necrosis and fibrosis)inversion (necrosis and fibrosis)
 F. Pathologic Q waves, upright TF. Pathologic Q waves, upright T
waves (fibrosis)waves (fibrosis)

Electrocardiography (ECG or EKG)

  • 1.
    interactive physiology 1 Prof.dr. Milan TaradiProf. dr. Milan Taradi Department of Physiology and ImmunologyDepartment of Physiology and Immunology is a method of recording electrical activity of the heart.is a method of recording electrical activity of the heart. ELECTROCARDIOGRAPHYELECTROCARDIOGRAPHY (ECG or EKG)(ECG or EKG)
  • 2.
    interactive physiologyECG Taradi2 ELECTROCARDIOGRAPHYELECTROCARDIOGRAPHY  DefinitionsDefinitions  Historical overviewHistorical overview  Transmembrane resting potential and actionTransmembrane resting potential and action potentialpotential  Propagation of the depolarization andPropagation of the depolarization and repolarisation over the membranerepolarisation over the membrane  Propagation of the waves on the surface of aPropagation of the waves on the surface of a cardiac muscle mass in volume conductorcardiac muscle mass in volume conductor  Propagations of waves through atria andPropagations of waves through atria and ventriculesventricules  Spreading the impulse through the heartSpreading the impulse through the heart  Flow of current around the heartFlow of current around the heart  Recording the standard electrocardiographicRecording the standard electrocardiographic leadsleads  Normal ECG recorded in one leadNormal ECG recorded in one lead  Projection of current in frontal planeProjection of current in frontal plane  Reconstruction of current in spaceReconstruction of current in space
  • 3.
    interactive physiologyECG Taradi3 ECG is a method of recording electrical activity of the heartECG is a method of recording electrical activity of the heart  ElectrocardiographyElectrocardiography is ais a science of recording andscience of recording and interpreting the electricalinterpreting the electrical activity that precedes and is aactivity that precedes and is a measure of the action of heartmeasure of the action of heart muscles.muscles.  ElectrocardiogphElectrocardiogph is ais a instrument for recording theinstrument for recording the changes of electrical potentialchanges of electrical potential occurring during the heartoccurring during the heart beatbeat used especially in diagnosingused especially in diagnosing abnormalities of heart action.abnormalities of heart action.  ElectrocardiogramElectrocardiogram (EKG or(EKG or ECG) is a graphical record (onECG) is a graphical record (on paper or screen) of thepaper or screen) of the electrical waves of the heart, aselectrical waves of the heart, as registred on theregistred on the electrocardiograph.electrocardiograph.
  • 4.
    interactive physiologyECG Taradi4 A brief history of electrocardiographyA brief history of electrocardiography  1843. Carlo Matteucci, professor of Physics at the University of Pisa, shows1843. Carlo Matteucci, professor of Physics at the University of Pisa, shows that an electric current accompanies each heart beat. He used a preparationthat an electric current accompanies each heart beat. He used a preparation known as a 'rheoscopic frog' in which the cut nerve of a frog's leg was used asknown as a 'rheoscopic frog' in which the cut nerve of a frog's leg was used as the electrical sensor.the electrical sensor.  1856. Rudolph von K1856. Rudolph von Kölliker and Heinrich Muller confirm that an electricallliker and Heinrich Muller confirm that an electrical current accompanies each heart beat by applying a galvanometer to the basecurrent accompanies each heart beat by applying a galvanometer to the base and apex of an exposed ventricle.and apex of an exposed ventricle.  1887. British physiologist Augustus D. Waller of St Mary's Medical School,1887. British physiologist Augustus D. Waller of St Mary's Medical School, London publishes the first human electrocardiogram. It is recorded with aLondon publishes the first human electrocardiogram. It is recorded with a capillary electrometer from Thomas Goswell, a technician in the laboratory.capillary electrometer from Thomas Goswell, a technician in the laboratory.  1893 Dutch physiologist Willem Einthoven introduces the term1893 Dutch physiologist Willem Einthoven introduces the term 'electrocardiogram''electrocardiogram'  1903. Einthoven invents a new galvanometer for producing1903. Einthoven invents a new galvanometer for producing electrocardiograms. In this device a fine quartz string is suspended verticallyelectrocardiograms. In this device a fine quartz string is suspended vertically between the poles of a magnet.between the poles of a magnet.  1924 Einthoven wins the Nobel prize for inventing the electrocardiograph.1924 Einthoven wins the Nobel prize for inventing the electrocardiograph.  1932. Wilson defines the unipolar limb leads VR, VL and VF where 'V' stands1932. Wilson defines the unipolar limb leads VR, VL and VF where 'V' stands for voltage.for voltage.  1947. Emanuel Goldberger increases the voltage of Wilson's unipolar leads by1947. Emanuel Goldberger increases the voltage of Wilson's unipolar leads by 50% and creates the augmented limb leads aVR, aVL and aVF.50% and creates the augmented limb leads aVR, aVL and aVF.
  • 5.
    interactive physiologyECG Taradi5 Inductive or deductive?Inductive or deductive?  Forward problemForward problem  Inverse problemInverse problem
  • 6.
    interactive physiologyECG Taradi6 Membrane Potentials Caused by DiffusionMembrane Potentials Caused by Diffusion  The membrane isThe membrane is permeable to thepermeable to the potassium ions but notpotassium ions but not for anions.for anions.  Because of the largeBecause of the large potassiumpotassium concentration gradientconcentration gradient from the inside towardfrom the inside toward outside, there is aoutside, there is a strong tendency forstrong tendency for extra numbers ofextra numbers of potassium ions topotassium ions to diffuse outward.diffuse outward.
  • 7.
    interactive physiologyECG Taradi7 The Resting Membrane PotentialThe Resting Membrane Potential  The potentialThe potential inside the cell isinside the cell is more negativemore negative than thethan the potential in thepotential in the extracelularextracelular fluid on thefluid on the outside of theoutside of the cell.cell.
  • 8.
    interactive physiologyECG Taradi8 Membrane Potentials Caused by DiffusionMembrane Potentials Caused by Diffusion  The membrane is semipermeable for the ions.The membrane is semipermeable for the ions.  Concentration gradients exist.Concentration gradients exist.  The stady state of gradients is maintained by the pump.The stady state of gradients is maintained by the pump.  There is a lot of nondiffusible anions inside the cell.There is a lot of nondiffusible anions inside the cell. diffusion of Na+ diffusion of K+ 3 Na3 Na++ 2 K+ ATP Mg++ ADP + Pi ICT
  • 9.
    interactive physiologyECG Taradi9 Contributions of the NaContributions of the Na++ -K-K++ PumpPump  NaNa++ -K-K++ pump ispump is electrogenic.electrogenic.  There isThere is continuouscontinuous pumping of 3 Napumping of 3 Na++ to outside forto outside for each 2 Keach 2 K++ pumpedpumped to the inside ofto the inside of the membrane.the membrane.
  • 10.
    interactive physiologyECG Taradi 10 Recording MembranePotentials and ActionRecording Membrane Potentials and Action PotentialsPotentials 0 -  The micropipetteThe micropipette (active electrode)(active electrode) is inserted intois inserted into the interior of thethe interior of the cell.cell.  The otherThe other electrode is onelectrode is on infinite distance,infinite distance, on potential 0 V.on potential 0 V.  MonophasicMonophasic potential ispotential is recorded on therecorded on the one spot of theone spot of the membrane.membrane.
  • 11.
    interactive physiologyECG Taradi 11 Recording BiphasicPotentialRecording Biphasic Potential  TwoTwo electrodes areelectrodes are placed outsideplaced outside the cell.the cell.  BiphasicBiphasic potential ispotential is recorded.recorded.  BothBoth electrodes areelectrodes are active.active. 0
  • 12.
    interactive physiologyECG Taradi 12 Monophasic ActionPotential ofMonophasic Action Potential of myocytemyocyte
  • 13.
    interactive physiologyECG Taradi 13 Monophasic ActionPotential of Ventricular CellMonophasic Action Potential of Ventricular Cell
  • 14.
    interactive physiologyECG Taradi 15 Pacemaker Potentialsin Sinus NodePacemaker Potentials in Sinus Node
  • 15.
    interactive physiologyECG Taradi 16 Propagations ofaction potentialsPropagations of action potentials  The action potentialThe action potential elicited at any pointelicited at any point excites adjacentexcites adjacent portions of theportions of the membrane in allmembrane in all directions.directions.  Depolarization waveDepolarization wave  Repolarization waveRepolarization wave  No potential is recordedNo potential is recorded when the cell is eitherwhen the cell is either completely polarized orcompletely polarized or depolarized.depolarized. - + - + - + - + - + +++++++++++++++++++++ ---------------------- ---------+++++++++++++ ++++++++-------------- ---------------------- ++++++++++ +++++++++++ +++++++++------------- ----------++++++++++++ ++++++++++++++++++++ ----------------------
  • 16.
    interactive physiologyECG Taradi 17 Principles ofVectorial AnalysisPrinciples of Vectorial Analysis  Resultant vector depends on the length of the vector andResultant vector depends on the length of the vector and the angle between the lead axis and the vector (projectedthe angle between the lead axis and the vector (projected vector = length x cos of an angle)vector = length x cos of an angle)  Also, resultant vector is diminish with the square of axisAlso, resultant vector is diminish with the square of axis distance.distance.
  • 17.
    interactive physiologyECG Taradi 18 Depolarization waveDepolarizationwave  Depolarizations has extended over the entireDepolarizations has extended over the entire muscle cell.muscle cell.
  • 18.
    interactive physiologyECG Taradi 19 Cardiac muscleis a functional syncycium.Cardiac muscle is a functional syncycium.  The cardiac muscle cells are joined end toThe cardiac muscle cells are joined end to end by specialized cell junction calledend by specialized cell junction called intercalated discs.intercalated discs.
  • 19.
    interactive physiologyECG Taradi 20 Depolarization wavein the muscle massDepolarization wave in the muscle mass  The potentials developed on the surface of cardiacThe potentials developed on the surface of cardiac muscle mass.muscle mass.
  • 20.
    interactive physiologyECG Taradi 21 The genesisof theThe genesis of the electrocardiogramelectrocardiogram  Propagation of thePropagation of the action potential inaction potential in the group ofthe group of myocytesmyocytes
  • 21.
    interactive physiologyECG Taradi 22 Activation frontActivationfront  The signal producedThe signal produced by the propagatingby the propagating activation frontactivation front between a pair ofbetween a pair of extracellularextracellular electrodes.electrodes.
  • 22.
    interactive physiologyECG Taradi 23 Propagation ofaction potentials in cardiac musclePropagation of action potentials in cardiac muscle  vectorsvectors  resultant vectorresultant vector  depolarizationdepolarization wavewave
  • 23.
    interactive physiologyECG Taradi 24 The Hartis in Volume ConductorThe Hart is in Volume Conductor  Flow of electrical currents in the chest aroundFlow of electrical currents in the chest around the heart.the heart.
  • 24.
    interactive physiologyECG Taradi 25 The recorddepends on the locations of electrodesThe record depends on the locations of electrodes  It is crucialIt is crucial where towhere to placeplace electrode.electrode.
  • 25.
    interactive physiologyECG Taradi 26 Standard Axesof the three bipolar leadsStandard Axes of the three bipolar leads
  • 26.
    interactive physiologyECG Taradi 27 Cardiac ConductiveSystemCardiac Conductive System  sinus node (sinoatrialsinus node (sinoatrial node)node)  internodal pathwaysinternodal pathways  anterior interatrial band (Bachman)  anterior, middle and posterior internodal pathways  atrioventricular nodeatrioventricular node  transitional fibers  A-V node  AV-bundle (His)AV-bundle (His)  penetrating portion  distal portion  Purkinje systemPurkinje system  left bundle branch  right bundle branch
  • 27.
    interactive physiologyECG Taradi 28 Summary ofthe Spread of Cardiac Impulse TroughSummary of the Spread of Cardiac Impulse Trough the Heartthe Heart
  • 28.
    interactive physiologyECG Taradi 29 The Pwave – Depolarization of the AtriaThe P wave – Depolarization of the Atria  Depolarization of the atria andDepolarization of the atria and generation of the P wavegeneration of the P wave 6 1 2 3 4 5 1 2 3 4 5 6 1 6
  • 29.
    interactive physiologyECG Taradi 30 The cathoderay tubeThe cathode ray tube  produces theproduces the vectorcardiogramvectorcardiogram in the frontalin the frontal plane from theplane from the Einthoven limbEinthoven limb leads.leads.
  • 30.
    interactive physiologyECG Taradi 31 Vectorial Analysisof the Normal ECGVectorial Analysis of the Normal ECG (Vectorcardiograms)(Vectorcardiograms) P QRS T
  • 31.
    interactive physiologyECG Taradi 32 The Pwave - Depolarization of the AtriaThe P wave - Depolarization of the Atria Lead I.
  • 32.
    interactive physiologyECG Taradi 33 Transmission ofthe cardiac impulse from the atriaTransmission of the cardiac impulse from the atria to the ventricleto the ventricle
  • 33.
    interactive physiologyECG Taradi 34 The QRScomplex – Depolarization of the VentriclesThe QRS complex – Depolarization of the Ventricles  The QRS complex is often composed of three separateThe QRS complex is often composed of three separate waves.waves. Lead I.
  • 34.
  • 35.
    interactive physiologyECG Taradi 37 The JPoint – The Zero Reference PotentialThe J Point – The Zero Reference Potential  The damaged part of the heart muscle is partially or totally depolarized all the time.The damaged part of the heart muscle is partially or totally depolarized all the time. Lead I. 0
  • 36.
    interactive physiologyECG Taradi 38 The TWave – Repolarization of the VentriclesThe T Wave – Repolarization of the Ventricles  The septum and the other endocardial areas have a longer period ofThe septum and the other endocardial areas have a longer period of contraction and therefore are slower to repolarize then the most of the externalcontraction and therefore are slower to repolarize then the most of the external surfaces of the heart.surfaces of the heart.  The reason is the high blood pressure inside the ventricules during sistole.The reason is the high blood pressure inside the ventricules during sistole. Lead I.
  • 37.
  • 38.
    interactive physiologyECG Taradi 40  ThenormalThe normal electrocardiogramelectrocardiogram Principles of ECGPrinciples of ECG
  • 39.
  • 40.
  • 41.
    interactive physiologyECG Taradi 43 The JPointThe J Point  The zero referenceThe zero reference potential for analyzingpotential for analyzing current of injurycurrent of injury  The damaged part ofThe damaged part of the heart muscle isthe heart muscle is partially or totallypartially or totally depolarized all thedepolarized all the time.time.
  • 42.
    interactive physiologyECG Taradi 44 Waves, complexes,intervals, segmentsWaves, complexes, intervals, segments
  • 43.
  • 44.
    interactive physiologyECG Taradi 46 The Determinationof the Rate of HeartbeatThe Determination of the Rate of Heartbeat
  • 45.
  • 46.
    interactive physiologyECG Taradi 48 The standardbipolar Leads are in frontal plane.The standard bipolar Leads are in frontal plane.
  • 47.
    interactive physiologyECG Taradi 49 Standard BipolarLeadsStandard Bipolar Leads  The system is threeaxial.The system is threeaxial.
  • 48.
    interactive physiologyECG Taradi 50 Einthoven´s triangleEinthoven´striangle Einthoven´s lawEinthoven´s law I + III = III + III = II
  • 49.
  • 50.
    interactive physiologyECG Taradi 52 Augmented UnipolarLimb LeadsAugmented Unipolar Limb Leads
  • 51.
    interactive physiologyECG Taradi 53 Augmented UnipolarLimb LeadsAugmented Unipolar Limb Leads  Axes of the unipolar leadsAxes of the unipolar leads
  • 52.
    interactive physiologyECG Taradi 54 The StandardLimbs LeadsThe Standard Limbs Leads  The ECG is very similar in all leads .The ECG is very similar in all leads .
  • 53.
  • 54.
    interactive physiologyECG Taradi 56 The axesof three standard bipolar leadsThe axes of three standard bipolar leads
  • 55.
  • 56.
    interactive physiologyECG Taradi 58 Normal rangeof the mean electrical axisNormal range of the mean electrical axis
  • 57.
    interactive physiologyECG Taradi 59 Normal ECG(left-sided axis)Normal ECG (left-sided axis)
  • 58.
    interactive physiologyECG Taradi 60 Normal ECG(vertical axis)Normal ECG (vertical axis)
  • 59.
  • 60.
  • 61.
    interactive physiologyECG Taradi 63 Precordial leadsPrecordialleads  UnipolarUnipolar chest leadschest leads
  • 62.
  • 63.
  • 64.
    interactive physiologyECG Taradi 66 All Leadsand AxisAll Leads and Axis  Lead I.Lead I. STANDARDSTANDARD  Lead II. (3)Lead II. (3)  Lead III.Lead III.  aVRaVR AUGMENTEDAUGMENTED  aVL (3)aVL (3)  aVFaVF  VV11 PRECORDIALPRECORDIAL  VV22 (6)(6)  VV33  VV44  VV55  VV66  total (12)total (12)
  • 65.
    interactive physiologyECG Taradi 67 Complete ECGin 12 LeadsComplete ECG in 12 Leads
  • 66.
    interactive physiologyECG Taradi 68 The relationshipof ECG and Heart CycleThe relationship of ECG and Heart Cycle
  • 67.
    interactive physiologyECG Taradi 69 Relationship ofECG and Heart CycleRelationship of ECG and Heart Cycle
  • 68.
    interactive physiologyECG Taradi 70 SummarySummary  PwaveP wave  P-Q segmentP-Q segment  QRS complexQRS complex  J pointJ point  S-T segmentS-T segment  T waveT wave  T-P segmentT-P segment  U waveU wave  P-R (P-Q) intervalP-R (P-Q) interval  Q-T intervalQ-T interval  R-R intervalR-R interval
  • 69.
  • 70.
    interactive physiologyECG Taradi 72 Sinus rhythmSinusrhythm  Normal sinusNormal sinus rhythm (Raterhythm (Rate 60 - 100/min )60 - 100/min )  SinusSinus bradycardiabradycardia (Rate <(Rate < 60/min)60/min)  SinusSinus tachycardiatachycardia (Rate >(Rate > 100/min100/min )) 1.1. RHYTHM DIAGNOSISRHYTHM DIAGNOSIS
  • 71.
    interactive physiologyECG Taradi 73 ArrhythmiaArrhythmia  SinusarrhythmiaSinus arrhythmia  Longest R-R interval exceeds shirtest > 0.16 sLongest R-R interval exceeds shirtest > 0.16 s 1.1. RHYTHM DIAGNOSISRHYTHM DIAGNOSIS
  • 72.
    interactive physiologyECG Taradi 74 Wandering pacemakerWanderingpacemaker  Impuses originate from varying points in atriaImpuses originate from varying points in atria  Variation in P-wave contour, P-R and P-P intervalVariation in P-wave contour, P-R and P-P interval and therefore in R-R intervalsand therefore in R-R intervals 1.1. RHYTHM DIAGNOSISRHYTHM DIAGNOSIS
  • 73.
  • 74.
  • 75.
    interactive physiologyECG Taradi 77 Atrial flutterAtrialflutter  Impulses travel in circular course in atriaImpulses travel in circular course in atria  Rapid flutter waves, ventricular responseRapid flutter waves, ventricular response irregularirregular 1.1. RHYTHM DIAGNOSISRHYTHM DIAGNOSIS
  • 76.
    interactive physiologyECG Taradi 78 Atrial fibrillationAtrialfibrillation  Impuses have chaotic, random pathways in atriaImpuses have chaotic, random pathways in atria  Baseline irregular, ventricular response irregularBaseline irregular, ventricular response irregular 1.1. RHYTHM DIAGNOSISRHYTHM DIAGNOSIS
  • 77.
    interactive physiologyECG Taradi 79 Junctional rhythmJunctionalrhythm  Impuses originate at AV node with retrograde andImpuses originate at AV node with retrograde and antegrade directionantegrade direction  P-wave is often inverted, may be under or afterP-wave is often inverted, may be under or after QRS complex, Heart rate is slowQRS complex, Heart rate is slow 1.1. RHYTHM DIAGNOSISRHYTHM DIAGNOSIS
  • 78.
    interactive physiologyECG Taradi 80 ArrhythmiaArrhythmia  Prematureventricular contractionPremature ventricular contraction  A single impulse originates at right ventricleA single impulse originates at right ventricle  Time interval between normal R peaks is aTime interval between normal R peaks is a multiple of R-R intervalsmultiple of R-R intervals 1.1. RHYTHM DIAGNOSISRHYTHM DIAGNOSIS
  • 79.
    interactive physiologyECG Taradi 81 Ventricular tachycardiaVentriculartachycardia  Impulse originate at ventricular pacemakerImpulse originate at ventricular pacemaker  Wide ventricular complexes, rate > 120/minWide ventricular complexes, rate > 120/min 1.1. RHYTHM DIAGNOSISRHYTHM DIAGNOSIS
  • 80.
    interactive physiologyECG Taradi 82 Ventricular fibrillationVentricularfibrillation  Chaotic ventricular depolarizationChaotic ventricular depolarization  Rapid, wide, irregular ventricular complexesRapid, wide, irregular ventricular complexes 1.1. RHYTHM DIAGNOSISRHYTHM DIAGNOSIS
  • 81.
  • 82.
    interactive physiologyECG Taradi 84 Pacer rhythmPacerrhythm  Impulses originate at transvenous pacemakerImpulses originate at transvenous pacemaker  Wide ventricular complexes preceded byWide ventricular complexes preceded by pacemaker spike. Rate is the pacer rhythmpacemaker spike. Rate is the pacer rhythm 1.1. RHYTHM DIAGNOSISRHYTHM DIAGNOSIS
  • 83.
    interactive physiologyECG Taradi 85 A-V blockA-Vblock  First-degreeFirst-degree (A-V(A-V conductionconduction lengthened )lengthened )  Second-degreeSecond-degree (Sudden(Sudden dropped QRS-dropped QRS- complex )complex )  First-degreeFirst-degree (Impulses(Impulses originate at AVoriginate at AV node andnode and proceed toproceed to ventricles)ventricles) 2.2. ACTIVATION SEQUENCEACTIVATION SEQUENCE
  • 84.
    interactive physiologyECG Taradi 86 Four Typesof AV blockFour Types of AV block 2.2. ACTIVATION SEQUENCEACTIVATION SEQUENCE
  • 85.
    interactive physiologyECG Taradi 87 WPW syndromeWPWsyndrome 2.2. ACTIVATION SEQUENCEACTIVATION SEQUENCE
  • 86.
    interactive physiologyECG Taradi 88 Right bundle-branchblockRight bundle-branch block 2.2. ACTIVATION SEQUENCEACTIVATION SEQUENCE  QRSQRS durationduration greater thangreater than 0.12 s0.12 s  Wide SWide S wave inwave in leads I, V5leads I, V5 and V6and V6
  • 87.
    interactive physiologyECG Taradi 89 Left bundle-branchblockLeft bundle-branch block  QRS durationQRS duration greater thangreater than 0.12 s0.12 s  Wide S waveWide S wave in leads V1in leads V1 and V2, wideand V2, wide R wave in V5R wave in V5 and V6and V6 2.2. ACTIVATION SEQUENCEACTIVATION SEQUENCE
  • 88.
    interactive physiologyECG Taradi 90 Right atrialhypertrophyRight atrial hypertrophy  Tall, peaked P wave inTall, peaked P wave in leads I and IIleads I and II 3.3. HYPERTROPHYHYPERTROPHY
  • 89.
    interactive physiologyECG Taradi 91 Right ventricularhypertrophyRight ventricular hypertrophy 3.3. HYPERTROPHYHYPERTROPHY  Large R wave in leads V1 and V3Large R wave in leads V1 and V3  Large S wave in leads V5 and V6Large S wave in leads V5 and V6
  • 90.
    interactive physiologyECG Taradi 92 Left ventricularhypertrophyLeft ventricular hypertrophy  Large S wave inLarge S wave in leads V1 and V2leads V1 and V2  Large R wave inLarge R wave in leads V5 and V6leads V5 and V6 3.3. HYPERTROPHYHYPERTROPHY
  • 91.
    interactive physiologyECG Taradi 93 Left ventricularhypertrophyLeft ventricular hypertrophy
  • 92.
    interactive physiologyECG Taradi 94 Myocardial InfarctionMyocardialInfarction  A. Normal ECG prior to MIA. Normal ECG prior to MI  B. Hyperacute T wave changes -B. Hyperacute T wave changes - increased T wave amplitude andincreased T wave amplitude and width; may also see ST elevationwidth; may also see ST elevation  C. Marked ST elevation withC. Marked ST elevation with hyperacute T wave changeshyperacute T wave changes (transmural injury)(transmural injury)  D. Pathologic Q waves, less STD. Pathologic Q waves, less ST elevation, terminal T waveelevation, terminal T wave inversion (necrosis) (Pathologic Qinversion (necrosis) (Pathologic Q waves are usually defined aswaves are usually defined as duration >0.04 s or >25% of R-waveduration >0.04 s or >25% of R-wave amplitude)amplitude)  E. Pathologic Q waves, T waveE. Pathologic Q waves, T wave inversion (necrosis and fibrosis)inversion (necrosis and fibrosis)  F. Pathologic Q waves, upright TF. Pathologic Q waves, upright T waves (fibrosis)waves (fibrosis)

Editor's Notes

  • #2 - T he electrocardiogram (ECG i si đi or EKG i kej đi ) is a recording of the electric potential, generated by the electric activity of the heart, on the surface of the thorax. - The ECG thus represents the extracellular electric behavior of the cardiac muscle tissue. - In this lecture we explain the genesis of the ECG signal .
  • #3 - As you know. ECG is the most valuble diagnostic prosidges in klinical diagnoses of the heart disease. - We start first with definition.
  • #5 - Carlo Matteucci, - So twitching of the muscle was used as the visual sign of electrical activity. Rudolph von Koelliker and Heinrich Muller- They also applied a nerve-muscle preparation, similar to Matteucci&apos;s, to the ventricle and observed that a twitch of the muscle occured just prior to ventricular systole and also a much smaller twitch after systole. - These twitches would later be recognised as caused by the electrical currents of the QRS and T waves.
  • #6 - The electrocardiogram which is recorded from body surface electrodes is the result of a vast number of systematically propagated electrical event taking place in the individual muscle cell fibers of the herat. - Two simplified approachs to undenstanding the complex phenomenon involved will be now presented. - The problem in which the source and the conducting medium are known but the field is unknown and must be determinated, is called the forward problem . The forward problem has a unique solution. It is always possible to calculate the field with an accuracy. However, this problem does not arise in clinical (diagnostic) situations, since in this case only the field can be measured (noninvasively) at the body surface. - The problem in which the field and the conductor are known but the source is unknown, is called the inverse problem . In medical applications of bioelectric phenomena, it is the inverse problem that has clinical importance. For instance, in everyday clinical diagnosis the cardiologist and the neurologist seek to determine the source of the measured bioelectric signals. The possible pathology affecting the source provides the basis for their diagnostic decisions - that is, the clinical status of the corresponding organ. - T he heart has on the order of 10 exponent 10 cells . - source - final field (ECG record) We desidet to take inductive way. - From single point of cellular membrane to hole cell, then a muscular streep, atrial syncycium, ventricular syncycium, the whole heart, the heart in the chest, the recording on the skin!
  • #11 - How we can record this electical fenomenon on membrane. Whot kinde of problem doo we have? - Thy take place in space that means in three dimension. - But we do not have instrument for spacial recording. - Voltmeter has onli tvo electrodec and it record difference between tvo point. - This is the projection of actual currentod the axs of theelectic lead.
  • #12 - The pair of electrocardiogram electrodes defines a lead. - In a lead one electrode is treated as a positive side of voltmeter, and one as a negaive side. - The lead records the fluctuation in voltage difference between positive and negative electrodes.
  • #13 - The action potential recorded in ventricular muscle swown on this slide, averages about 110 milivolts. - This means that the mombrane potential rises from its very negative value about -90 mV between beats to a slightly positive value about +20 mV during each beat.
  • #14 - The Na+ current is responsible for the rapid depolarizing phase of the action potential in atrial, ventricular and in Purkinje fibers. - The K+ current is responsible for the repolarizing phase in all cardiomyocytes. - Duration of the action potential and the contraction is the equal, but not synchron.
  • #16 - The SA nodal cells are self-excitatory, pacemaker cells . - Because the intrinsic rate of the sinus node is the greatest, it sets the activation frequency of the whole heart. - The Ca++ current is responsible for the rapid depolarizing phase of the action potential in SA and AV node. It also trigger contraction in all cardiomyocytes.
  • #17 - Spread of the impulse through the myocyte - Although it is known that repolarization does not actually propagate, a boundary between repolarized and still active regions can be defined as a function of time. It is &quot;propagation&quot; in this sense that is described here.
  • #18 - In volume conductor the current flow in all direction, but predominantly in one particular direction at a given instant during cardiac cycle. - A vector is an arrow that points in the current flow direction with arrowhead in the positive direction. - The lenght of the vector is drown proportional to the voltage of potential. - At any given instant current flow is represented by resultant, summated vector. - Because the movement of charge (dipol) has both a three-dimensional direction and a magnitude. - The signal measured on an ECG is a vector.
  • #19 - We come to the single cell - cardiomyocyte. - The nexst step is the small streep of cardiac muscle.
  • #21 - The fluctuation in extracellular voltage recorded by each lead vary from fractions of millivolt to several millivolts. - These fluctuation are called waves.
  • #22 - The depolaruzation zone is narow, but repolarization is wide. - Direction of wavefront movement is the same! - Polarity of the duble layer is oposit, and the local current across the membrane is oposit.
  • #23 - Before we discuss the generation of the ECG signal in detail, we consider a simple example explaining what kind of signal a propagating activation front produces in a volume conductor. - Slide presents a volume conductor and a pair of electrodes on its opposite surfaces. The figure is divided into four cases, where both the depolarization and repolarization fronts propagate toward both positive and negative electrodes. In various cases the detected signals have the following polarities: - Case A: When the depolarization front propagates toward a positive electrode, it produces a positive signal. First we note that the transmembrane voltage ahead of the wave is negative since this region is still at rest. Behind the wave front, the transmembrane voltage is in the plateau stage; hence it is positive . - Case B : When the propagation of activation is away from the positive electrode, the signal has the corresponding negative polarity. - Case C : It is easy to understand that when the repolarization front propagates toward a positive electrode, the signal is negative. - Case D : When the direction of propagation of a repolarization front is away from the positive electrode, a positive signal is produced.
  • #25 - T he conducting medium extends continuously; it is three-dimensional and referred to as a volume conductor . - The human body may be considered as a resistive, piecewise homogeneous and linear volume conductor. Most of the tissue is isotropic. The muscle is, however, strongly anisotropic, and the brain tissue is anisotropic as well.
  • #30 - Depolarisation of the atria begins in SA node. - The direction of depalarisation is in direction noted by the red vector on the slide.
  • #31 - The cathode ray tube (oscilloscope) of W. Hollman and H. F. Hollman has three pairs of deflection plates oriented in the directions of the edges of the Einthoven triangle. - The elliptical figure generated by the positive ends of the vector is called vectorcardiogram.
  • #40 - The mammalian electrocardiogram contains three major components during each cardiac cycle. - According to the nomenclature devised by Einthoven, the component producen by atrial activation is called the P wave, the one produced by ventricular activation is the QRS complex, and the component produced by ventricular recovery is the T wave.
  • #50 - I (positive connection to left arm, negative connection to right arm) The lead defines an axis in the frontal plane at 0 degrees. - II (positive connection to left leg, negative connection to right arm) The lead defines an axis in the frontal plane at 60 degrees. - III (positive connection to left leg, negative connection to left art) The lead defines an axis in the frontal plane at 120 degrees.
  • #58 - The positive and negative ends of these six leads define axes every 30 degrees in the frontal plane.
  • #65 - The precordial leds lie in the transverse plane, perpendicular to the plane of the frontal leads. - The positive connection is one of six different locations on the chest wall, and the negative connection is electronically defined in the middle of the heart by averaging the three limb electrodes.
  • #67 - Recording from all 12 leads is extremely usefulbecause a signal of interest may be easier to see in one lead than another.
  • #73 - Normal sinus rhythm - The sinus rhythm is normal if its frequency is between 60 and 100/min . - A sinus rhythm of less than 60/min is called sinus bradycardia. This may be a consequence of increased vagal or parasympathetic tone. - A sinus rhythm of higher than 100/min is called sinus tachycardia. It occurs most often as a physiological response to physical exercise or psychical stress, but may also result from congestive heart failure.
  • #74 - If the sinus rhythm is irregular such that the longest PP- or RR-interval exceeds the shortest interval by 0.16 s, the situation is called sinus arrhythmia. This situation is very common in all age groups.
  • #78 - When the heart rate is sufficiently elevated so that the isoelectric interval between the end of T and beginning of P disappears, the arrhythmia is called atrial flutter. The origin is also believed to involve a reentrant atrial pathway. - The AV-node and, thereafter, the ventricles are generally activated by every second or every third atrial impulse (2:1 or 3:1 heart block).
  • #79 - The activation in the atria may also be fully irregular and chaotic, producing irregular fluctuations in the baseline. A consequence is that the ventricular rate is rapid and irregular . - Atrial fibrillation occurs as a consequence of rheumatic disease, atherosclerotic disease, hyperthyroidism, and pericarditis. (It may also occur in healthy subjects as a result of strong sympathetic activation.)
  • #80 - If the heart rate is slow (40-55/min), the QRS-complex is normal, the P-waves are possibly not seen, then the origin of the cardiac rhythm is in the AV node. - Because the origin is in the juction between atria and ventricles, this is called junctional rhythm .
  • #81 - A premature ventricular contraction is one that occurs abnormally early. If its origin is in the atrium or in the AV node, it has a supraventricular origin. The complex produced by this supraventricular arrhythmia lasts less than 0.1 s. If the origin is in the ventricular muscle, the QRS-complex has a very abnormal form and lasts longer than 0.1 s. Usually the P-wave is not associated with it.
  • #82 A rhythm of ventricular origin may also be a consequence of a slower conduction in ischemic ventricular muscle that leads to circular activation (re-entry). The result is activation of the ventricular muscle at a high rate (over 120/min), causing rapid, bizarre, and wide QRS-complexes; the arrythmia is called ventricular tachycardia. As noted, ventricular tachycardia is often a consequence of ischemia and myocardial infarction.
  • #83 When ventricular depolarization occurs chaotically, the situation is called ventricular fibrillation. This is reflected in the ECG, which demonstrates coarse irregular undulations without QRS-complexes. The cause of fibrillation is the establishment of multiple re-entry loops usually involving diseased heart muscle. In this arrhythmia the contraction of the ventricular muscle is also irregular and is ineffective at pumping blood. The lack of blood circulation leads to almost immediate loss of consciousness and death within minutes. The ventricular fibrillation may be stopped with an external defibrillator pulse and appropriate medication.
  • #85 A ventricular rhythm originating from a cardiac pacemaker is associated with wide QRS-complexes because the pacing electrode is (usually) located in the right ventricle and activation does not involve the conduction system. In pacer rhythm the ventricular contraction is usually preceded by a clearly visible pacer impulse spike. The pacer rhythm is usually set to 72/min..
  • #86 - When the P-wave always precedes the QRS-complex but the PR-interval is prolonged over 0.2 s, first-degree atrioventricular block is diagnosed. - If the PQ-interval is longer than normal and the QRS-complex sometimes does not follow the P-wave, the atrioventricular block is of second-degree. If the PR-interval progressively lengthens, leading finally to the dropout of a QRS-complex, the second degree block is called a Wenkebach phenomenon . - Complete lack of synchronism between the P-wave and the QRS-complex is diagnosed as third-degree (or total) atrioventricular block. The conduction system defect in third degree AV-block may arise at different locations such as: Over the AV-node In the bundle of His Bilaterally in the upper part of both bundle branches Trifascicularly, located still lower, so that it exists in the right bundle-branch and in the two fascicles of the left bundle-branch.
  • #89 - If the right bundle-branch is defective so that the electrical impulse cannot travel through it to the right ventricle, activation reaches the right ventricle by proceeding from the left ventricle. It then travels through the septal and right ventricular muscle mass. This progress is, of course, slower than that through the conduction system and leads to a QRS-complex wider than 0.1 s. Usually the duration criterion for the QRS-complex in right bundle-branch block (RBBB) as well as for the left brundle- branch block (LBBB) is &gt;0.12 s. Activation of the left ventricle takes place normally
  • #90 - The situation in left bundle-branch block (LBBB) is similar, but activation proceeds in a direction opposite to RBBB. Again the duration criterion for complete block is 0.12 s or more for the QRS-complex. Because the activation wavefront travels in more or less the normal direction in LBBB, the signals&apos; polarities are generally normal. However, because of the abnormal sites of initiation of the left ventricular activation front and the presence of normal right ventricular activation the outcome is complex and the electric heart vector makes a slower and larger loop to the left and is seen as a broad and tall R-wave, usually in leads I, aVL, V5, or V6.
  • #91 - Right atrial hypertrophy is a consequence of right atrial overload. This may be a result of tricuspid valve disease (stenosis or insufficiency), pulmonary valve disease, or pulmonary hypertension (increased pulmonary blood pressure). The latter is most commonly a consequence of chronic obstructive pulmonary disease or pulmonary emboli. In right atrial hypertrophy the electrical force due to the enlargened right atrium is larger. This electrical force is oriented mainly in the direction of lead II but also in leads aV F and III. In all of these leads an unusually large (i.e., 0.25 mV) P-wave is seen.
  • #92 - Right ventricular hypertrophy is a consequence of right ventricular overload. - This is caused by pulmonary valve stenosis, tricuspid insufficiency, or pulmonary hypertension (see above). Also many congenital cardiac abnormalities, such as a ventricular septal defect, may cause right ventricular overload. Right ventricular hypertrophy increases the ventricular electrical forces directed to the right ventricle - that is, to the right and front. This is seen in lead V1 as a tall R-wave of 0.7 mV.
  • #93 - Left ventricular hypertrophy is a consequence of left ventricular overload. - It arises from mitral valve disease, aortic valve disease, or systemic hypertension. Left ventricular hypertrophy may also be a consequence of obstructive hypertrophic cardiomyopathy, which is a sickness of the cardiac muscle cells. Left ventricular hypertrophy increases the ventricular electric forces directed to the left ventricle - that is, to the left and posteriorly. Evidence of this is seen in lead I as a tall R-wave and in lead III as a tall S-wave ( 2.5 mV). Also a tall S-wave is seen in precordial leads V1 and V2 and a tall R-wave in leads V5 and V6, ( 3.5 mV).