
Recommended
Recommended
More Related Content
Similar to Introduction to Electrocariography(ecg).doc
Similar to Introduction to Electrocariography(ecg).doc (20)
Recently uploaded
Recently uploaded (20)
Introduction to Electrocariography(ecg).doc
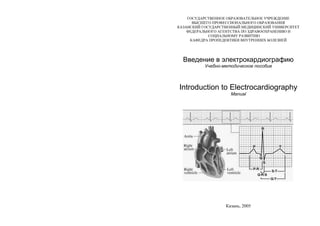
- 1. ГОСУДАРСТВЕННОЕ ОБРАЗОВАТЕЛЬНОЕ УЧРЕЖДЕНИЕ ВЫСШЕГО ПРОФЕССИОНАЛЬНОГО ОБРАЗОВАНИЯ КАЗАНСКИЙ ГОСУДАРСТВЕННЫЙ МЕДИЦИНСКИЙ УНИВЕРСИТЕТ ФЕДЕРАЛЬНОГО АГЕНТСТВА ПО ЗДРАВООХРАНЕНИЮ И СОЦИАЛЬНОМУ РАЗВИТИЮ КАФЕДРА ПРОПЕДЕВТИКИ ВНУТРЕННИХ БОЛЕЗНЕЙ Введение в электрокардиографию Учебно-методическое пособие Introduction to Electrocardiography Manual Казань, 2005
- 2. УДК 616.12-008.3-073.96 ББК 54.101 Печатается по решению Центрального координационно- методического совета Казанского государственного медицинского университета Авторы-составители: заведующий кафедрой пропедевтики внутренних болезней профессор В.Н.Ослопов, доцент О.В.Богоявленская, ассистент Ю.В.Ослопова, старший преподаватель кафедры иностранных языков Л.А.Ануфриева Рецензенты: декан отделения по работе с иностранными студентами, к.м.н., доцент кафедры эпидемиологии Н.М.Хакимов старший преподаватель кафедры иностранных языков И.В.Карамышева Ослопов В.Н., Богоявленская О.В., Ослопова Ю.В., Ануфриева Л.А. Основы электрокардиографии. Учебно-методическое пособие. Introduction to Electrocardiography. Manual. - Казань: КГМУ, 2005. – 102 с. Учебно-методическое пособие составлено в соответствии с Государственным образовательным стандартом высшего профессионального образования, Государственными требованиями к минимуму содержания и уровню подготовки выпускника вуза по специальности 040100 «Лечебное дело», типовой и рабочей программами по дисциплине «Пропедевтика внутренних болезней». В учебно-методическом пособии подробно освещается содержание занятий по электрокардиографии, изложен теоретический материал, приводятся контрольные вопросы и задания. Пособие предназначено для иностранных студентов медицинских вузов. Казанский государственный медицинский университет, 2005 CONTENTS ABBREVIATION ……...………………………………………. 4 UNIT 1 ......................................................................................... 5 Theme 1. Electrocardiography. Performing the electrocardiographic test, electrocardiographic leads, and patterns analyzed in electrocardiographic analysis. Analyzing and interpreting the electrocardiogram. The normal Electrocardiogram........................... 5 Theme 2. Atrial and Ventricular Hypertrophy. Right and Left Bundle (Bundle of His) Branches Block ................................................. 36 UNIT 2 ........................................................................................... 52 Theme 1. Sinus rhythm disturbances. Sino-atrial block. Atrioventricular block. Pre-excitation syndrome..................................... 52 Theme 2. Supraventricular arrhythmias (premature atrial and junctional contractions, paroxysmal supraventricular tachycardia, atrial fibrillation and flutter). Ventricular arrhythmias (ventricular premature beats, ventricular tachycardia, torsades de pointes and the long QT- interval syndrome, and ventricular fibrillation)........................................ 64 UNIT 3 ........................................................................................... 81 Theme 1. Myocardial ischemia and infarction: the classic ECG- findings, evolution of ECG-changes, the topical diagnosis. Standard exercise electrocardiography.................................................................... 81 Control Summing-up ....................................................................... 102 Literature used ............................................................................... 102
- 3. 4 ABBREVIATION AAL anterior axillary line AV atrioventricular AVNRT atrioventricular nodal reentrant tachycardia EA electrical axis ECG electrocardiogram HR heart rate ICS intercostal space LA left atrium LAA left atrium abnormality LAE left atrial enlargement LBBB left bundle branch block LGL Lown-Ganong-Levine Lt left LV left ventricle LVH left ventricular hypertrophy MAL midaxillary line MCL midclavicular line MFAT multi-focal atrial tachycardia PACs premature atrial contractions PJCs premature junctional contractions PSVT paroxysmal supraventricular tachycardia PVC premature ventricular contraction RA right atrium RBBB right bundle branch block Rt right RV right ventricle RVH right ventricular hypertrophy SA sinoatrial TIDA time of the internal deflection of atrtia TIDV time of the internal deflection of ventricles VF ventricular flutter VM ventricular muscle VPBs ventricular premature beats WPW Wolff-Parkinson-White 5 UNIT 1 Theme 1. ELECTROCARDIOGRAPHY. PERFORMING THE ELECTROCARDIOGRAPHIC TEST, ELECTROCARDIOGRAPHIC LEADS, PATTERNS ANALYZED IN ELECTROCARDIOGRAPHIC ANALYSIS. ANALYZING AND INTERPRETING THE ELECTROCARDIOGRAM. THE NORMAL ELECTROCARDIOGRAM Goal: to get a notion about physiological basis of the Electrocardiogram (ECG) and the principles of the performing the electrocardiographic test, to master skills. Knowledge objectives: to know the history of electrocardiography, physiological basis of the Electrocardiogram, the principles of the performing the electrocardiographic test, the characteristic features of the ECG-leads (3 standard limb leads, 3 augmented limb leads, 6 unipolar chest, or precordial, leads), the ECG-wave morphology, the term “electrical axis” and the angle , approach to ECG-analysis. Skill objectives: to develop practical skills in performing the electrocardiographic test and analyzing the normal electrocardiogram. EDUCATIONAL MATERIAL Electrocardiography – is a method to study bioelectric potentials generated by the myocardium; graphic recording of electric potentials generated by the heart. Electrocardiogram (ECG) is a record of the electrical changes in the heart muscles. The signals are detected by means of metal electrodes attached to the extremities and chest wall and are then amplified and recorded by the electrocardiograph. Although the ECG shows no more than the intermittent passage of electrical impulses in the heart, the tracings provide detailed information
- 4. 6 about the physical condition and functioning of the heart muscle. Disturbances of the natural rhythm are precisely shown, and damage to the muscle, e.g. caused by disease of the coronary arteries, can be lo- calized. It is one of the most useful diagnostic aids after a suspected heart attack, both in the early stages to show whether and to what extent the heart is affected, and later to indicate the patient's progress. An ECG recording made during graduated exertion, e.g. on a static bicycle or treadmill, is a valuable test of fitness and may expose abnormalities not seen on the resting cardiogram. THE HISTORY OF ELECTROCARDIOGRAPHY The start of electricardiography (ECG) took place more than two centuries ago. In 1780 Italian Anatomist Luigi Galvani (1780) noticed that a dissected frog's leg was twitching when touched with a metal scalpel: “I had dissected and prepared a frog in the usual way and while I was attending to something else I laid it on a table on which an electrical machine stood at some distance from its conductor and separated from it by a considerable space. Now when one of the persons present touched accidentally and lightly the inner crural nerves of the frog with the point of a scalpel, all the muscles of the legs seemed to contract again and again as if they were affected by powerful cramps”. Later L.Galvani showed that direct contact with an electrical generator or the ground through an electrical conductor would lead to a muscle contraction. L.Galvani also used brass hooks which were attached to the frog's spinal cord and were suspended from an iron railing in a part of his garden. He noticed that the frogs' legs twitched during lightening storms and also when the weather was fine. He interpreted these results in terms of "animal electricity" or the preservation in an animal of “nerveo- electrical fluid” similar to that of an electric eel. Galvani's name is given to the “galvanometer” which is an instrument for measuring (and recording) electricity - this is essentially what an ECG is; a sensitive galvanometer. In 1791 Galvani discovered that electrical stimulation of a frog's heart lead to cardiac muscular contraction. 7 In 1843-1849 a German physiologist Emil Dubois-Reymond described an “action potential” accompanying each muscular contraction. He detected the small voltage potential present in a resting muscle and diminished with contraction of the muscle. He developed one of the most sensitive galvanometers of his time. His device had a wire coil with nearly 24 000 turns - 5 km of wire. In 1878 British physiologists John Burden Sanderson and Frederick Page recorded the heart's electrical current with a capillary electrometer and showed that it consisted of two phases (later called QRS and T). In 1880 a French physicist Arsene d’Arsonval in association with Marcel Deprez improved the galvanometer. Instead of a magnetized needle moving when electrical current flowed through a surrounding wire coil the Deprez-d'Arsonval galvanometer had a fixed magnet and moveable coil. If a pointer is attached to the coil it can move over a suitably calibrated scale. The d'Arsonval galvanometer is a basis for most modern galvanometers. In 1887 a British physiologist Augustus D. Waller of St Mary's Medical School, London published the first human electrocardiogram. It was recorded with a capilliary electrometer from Thomas Goswell, a technician in the laboratory. In 1889 a Dutch physiologist Willem Einthoven, Leyden, saw Waller who demonstrated his technique at the First International Congress of Physiologists in Bale. Waller often demonstrated his technique using his dog "Jimmy" who would patiently stand with paws in glass jars of saline. In 1891 British physiologists William Bayliss and Edward Starling of University College London improved the capillary electrometer. They connected the terminals to the right hand and to the skin over the apex beat and showed a “triphasic variation accompanying (or rather preceding) each beat of the heart”. Those deflections were later called P, QRS and T. In 1893 Willem Einthoven introduced the term “electrocardiogram” at a meeting of the Dutch Medical Association (later he claimed that Waller was the first to use the term). In 1895 Einthoven distinguished five deflections which he named P, Q, R, S and T.
- 5. 8 1895 to date: The first accurate recording of the electrocardiogram and its development as a clinical tool. Why PQRST and not ABCDE? The four deflections prior to the correction formula were labelled ABCD and the 5 derived deflections were labelled PQRST. The choice of P is a mathematical convention by using letters from the second half of the alphabet. N has other meanings in mathematics and O is used for the origin of the Cartesian coordinates. In fact Einthoven used O...X to mark the timeline on his diagrams. P is simply the next letter. A lot of work had been undertaken to reveal the true electrical waveform of the ECG by eliminating the damping effect of the moving parts in the amplifiers and using correction formulae. If you look at the diagram in Einthoven's 1895 paper you will see how close it is to the string galvanometer recordings and the electrocardiograms we see today. The image of the PQRST diagram may have been striking enough to have been adopted by the researchers as a true representation of the underlying form. It would have then been logical to continue the same naming convention when the more advanced string galvanometer started creating electrocardiograms a few years later. In 1901-1903 W.Einthoven invented a new galvanometer for producing electrocardiograms using a fine quartz string coated in silver based on ideas by Deprez and d'Arsonval (who used a wire coil). His “string galvanometer” weighed 600 pounds. W.Einthoven acknowledged the similar system by Ader but later (1909) calculated that his galvanometer was in fact many thousands of times more sensitive. W.Einthoven published the first electrocardiogram recorded on a string galvanometer and in 1903 he already discussed commercial production of a string galvanometer with Max Edelmann of Munich and Horace Darwin of Cambridge Scientific Instruments Company of London. In 1905 W.Einthoven started transmitting electrocardiograms from the hospital to his laboratory 1,5 km away via telephone cable. On March 22nd the first “telecardiogram” was recorded from a healthy and vigorous man and the tall R waves were attributed to his cycling from laboratory to hospital for the recording. 9 1903 to date: the official date of the ECG appearance is considered to be 1903 when Einthoven invented an apparatus to record electric changes in the heart. Simultaneously with Einthoven a Russian physiologist Alexander Ph. Samoilov of Kazan University (1867–1930) in 1903 recorded with the help of capillary electrometer thin potentials of muscle action, and in 1906 he performed the electrographic record for the first time in Russia. From that time professor A.Samoilov and professor Vladimir Ph. Zelenin (1881–1968) began an active introduction of the method into clinic. In 1912 Einthoven addressed the Chelsea Clinical Society in London and described an equilateral triangle formed by his standard leads I, II and III later called “Einthoven's triangle”. In 1924 Willem Einthoven was awarded the Nobel Prize for his invention of the electrocardiogram. In 1932 F. Wilson offered the chest leads, American Heart Association and the Cardiac Society of Great Britain defined the standard positions, and wiring, of the chest leads V1 – V6 (the “V” stands for voltage). In 1934 by joining the wires from the right arm, left arm and left foot with 5000 Ohm resistors Frank Wilson defined an “indifferent electrode” later called the “Wilson Central Terminal”. The combined lead acts as an earth and is attached to the negative terminal of the ECG. An electrode attached to the positive terminal then becomes 'unipolar' and can be placed anywhere on the body. Wilson defined the unipolar limb leads VR, VL and VF where “V” stood for voltage (the voltage seen at the site of the unipolar electrode). In 1942 Emanuel Goldberger increased the voltage of Wilson's unipolar leads by 50% and created the augmented limb leads aVR, aVL and aVF. When added to Einthoven's three limb leads and the six chest leads we arrive at the 12-lead electrocardiogram that is used today. ELECTROPHYSIOLOGY The action potential is generated by depolarization and repolarization of the muscle cell (Fig. 1). Depolarization of the heart is
- 6. 10 the initiating event for cardiac contraction. The electric currents that spread through the heart are produced by three components: cardiac pacemaker cells, specialized conduction tissue, and the heart muscle itself. The ECG, however, records only the depolarization (stimulation) and repolarization (recovery) potentials generated by the atrial and ventricular myocardium. Under resting conditions, myocardial cells are polarized; that is, they carry an electric charge on their surface due to transmembrane ion concentration differences. The charge measured across atrial and ventricular cell membranes is about 90 mV, with the inside negative relative to the outside. When these cells are stimulated above a critical threshold potential, they rapidly depolarize and transiently reverse their membrane polarity. This depolarization process spreads in a wavelike manner through the atria and ventricles. The return of myocardial fibers to their original resting state occurs during repolarization. Fig. 1. Transmembrane potentials from the sinus node (upper panel) and a Purkinje fiber (middle panel); relationship to the ECG (the lower panel). [From Singn BN et al. Prog Cardiovasc Dis 22:243, 1980]. 11 You can see the process of action potential generation at the Fig. 1 (middle panel). If an electrical stimulus is applied, the membrane becomes very permeable to sodium ions, which rapidly leak into the cell (phase 0). The membrane is thus depolarized (loses its negative charge) and, in fact, is transiently positively charged (overshoot). Repolarization occurs relatively slowly as chloride (phase 1), calcium ions (phase 2), and then potassium ions (phase 3) move back into the cell and thereby restore the resting potential (phase 4) (Fig. 1). In the heart the phases of rapid depolarization and overshoot correspond to the QRS complex of the ECG; phase 2 corresponds to the ST-segment; and phase 3, to the T-wave (Fig. 1, the lower panel). REMEMBER: 1. Resting cardiac cell is polarized - INTERIOR is NEGATIVE 90 mV relative by exterior. 2. Application of electrical current to cardiac cell causes DEPOLARIZATION: Rapid influx of Na+ . 3. Depolarization of one cell triggers depolarization of adjacent cells. A DEPOLARIZATION wave front (advancing wave of positive charge) passes along all connected, living cells (but does not pass along scar or other non-cardiac tissues). 4. The ECG machine is a STRING galvanometer that records changes of potential difference (ie. a passing depolarization wave front or current). 5. The ECG machine records from skin electrodes the small (milliVolt) electrical signals generated by the heart, amplifies them and, by a recording pen attached to the galvanometer, records them on paper. Each deflection of the pen is proportional to the instantaneous amplitude of the cardiac electrical signal. By moving the recording paper under the pen, a plot of cardiac wave form AMPLITUDE vs. TIME is generated. This is the ECG. The depolarization stimulus for the normal heartbeat originates in the sinoatrial (SA) node or sinus node, a collection of pacemaker cells (Fig. 2). These cells fire spontaneously; that is, they exhibit automaticity. The first phase of cardiac electrical activation is the spread of the depolarization wave through the right and left atria, followed by
- 7. 12 atrial contraction. Next, the impulse stimulates pacemaker and specialized conduction tissues in the atrioventricular (AV) nodal and His-bundle areas; together, these two regions constitute the AV junction. The bundle of His bifurcates into two main branches, the right and left bundles, which rapidly transmit depolarization wave fronts to the right and left ventricular myocardium by way of Purkinje fibers. The main left bundle bifurcates into two primary subdivisions, a left anterior fascicle and a left posterior fascicle. The depolarization wave fronts then spread through the ventricular wall, from the endocardium to the epicardium, triggering ventricular contraction. Fig. 2. Schematic of the cardiac conduction system. 1 - Sinoatrial node; 2 - Bachman’s anterior tract; 3 - Venkebach’s middle tract; 4 - Torel’s posterior tract; 5 - Atrioventricular node; 6 - the common trunk of His bundle; 7 – Right bundle branch; 8 - Left bundle branch; 9 - Anterosuperior (anterior) branch of the left bundle branch; 10 - Posterior inferior (posterior) branch of the left bundle branch; 11 - Purkinje fibers. 13 Since the cardiac depolarization and repolarization waves have direction and magnitude, they can be represented by vectors. The general principles of vector analysis remain fundamental to understanding the genesis of normal and pathologic ECG waveforms. Each ECG electrode has a positive and negative pole. By convention, the following deflections occur (Fig. 3): 1. A depolarization (positive) wave moving parallel to and toward the positive pole of the ECG electrode causes an upward deflection on the ECG paper (Fig.3, A). 2. A depolarization (positive) wave moving parallel to but away from the positive pole of the ECG electrode causes a downward deflection on the ECG paper (Fig. 3, B). 3. A depolarization (positive) wave oriented perpendicular to the positive pole of the ECG electrode causes no deflection on the ECG paper (Fig. 3, C). Axis of ECG lead Axis of ECG lead Axis of ECG lead - + - + - + Vector of current flow A B C Fig. 3. Deflections on the ECG-paper A – if current flows in the same direction as the axis of lead, ECG stylus is deflected strongly upward from baseline in that lead. B – if current flow is in the opposite direction to the axis of lead, stylus is deflected strongly downward. C – If current flow is perpendicular, either toward or away from the axis of lead, there is no deflection, either up or down, of stylus. Vector analysis illustrates a central concept of electrocardiography that the ECG records the complex spatial and temporal summation of electrical potentials from multiple myocardial fibers conducted to the surface of the body.
- 8. 14 This principle accounts for inherent limitations in both ECG sensitivity (activity from certain cardiac regions may be cancelled out or may be too weak to be recorded) and specificity (the same vectorial sum can result from either a selective gain or a loss of forces in opposite directions). PERFORMING THE ELECTROCARDIOGRAPHIC TEST Electrocardiography should be carried out in a warm quiet room. A patient is laid on the back and asked to relax muscles, stretch the hands along the trunk and breathe calmly, not deeply. Trembling of the body distorts the electrocardiogram. In order to decrease skin resistance, it is necessary to apply a small amount of special electrode jelly to the skin before attaching the electrode. This should be well massaged in, and should cover an area only very slightly larger than that of the electrode itself. It can subsequently be wiped off. Otherwise gauze layings between an electrode and the body surface moistened in a physiologic solution can be used. Suitable sites for attachment of the limb electrodes are the medial aspects of the wrists and the outer sides of the legs just above the ankles. The rubber straps supplied for holding them in position should be adjusted to give firm, even contact, but must not be excessively tight. Chest electrodes are now usually of the suction type, though alternative patterns for strapping or manually holding in position are also available. It is absolutely essential that electrode jelly be applied only to the immediate area of contact with the chest wall, and that all traces of jelly be removed from the other chest lead sites. If these conditions are not observed, considerable distortion of the recorded patterns can result. In usual ECG examination the recording is carried out in 12 leads – 6 from the extremities (limbs) (standard and augmented leads) and 6 chest leads; not less than 4 ECG complexes are fixed in every lead. In disturbance of cardiac rhythm and conductivity the larger amount of complexes should be fixed. Remember to obtain a rhythm strip. The rhythm strip is usually done with lead II or V2. 15 Under normal conditions, ECG recordings are standardized so that a vertical deflection of 10 mm (i.e. two large divisions) represents a potential of one millivolt. A switch on the machine allows a signal of 1 mV to deflect the recording needle, and operation of the sensitivity control will then adjust the travel of the needle to the desired 10 mm. Standardisation should always be carried out before an ECG is recorded, so that the amplitude of the tracing can be correctly interpreted. When exceptional conditions (e.g. very large voltages) necessitate recording at other than standard sensitivity, this fact should be clearly indicated on the tracing. The paper used in standard direct-writing machines is calibrated in both vertical and horizontal directions by lines at millimetre intervals with thicker lines every 5 mm. The paper is run at a standard speed of 50 mm per second, so that each small division on the horizontal or time scale represents 0,02 second and each larger division 0,1 second. ECG LEADS The electrocardiogram can be written down by attaching the electrodes on two points of the human body which are at some distance from each other, excepting isopotential points, i.e. points with identical potentials. However it was more convenient to use certain points giving the most informative data. Use of these points allowed to unify the method of the electrocardiogram registration. Registration of an electrocardiogram is performed with the help of different leads. The line, connecting two points of electrodes application was named a lead axis. In an electrocardiographic lead the polarity, i.e. the direction of current on an lead axis, is maid out. It is considered that the positive pole is the pole having the greater potential. It is connected with the anode (+) of the electrocardiograph. Therefore in case of direction of summary total vector to "+" leads on the electrocardiogram a positive wave is registered, and at a return direction of vector – a negative one. Standard leads. The founder of the electrocardiograms leads development is Eintchoven, who relatively presented a human body as a spherical formation, in the centre of which there is the working heart creating the electric field. He offered to lead heart biopotentials from the
- 9. 16 extremities, imagining both hands and the left leg as corners of the lateral triangle formed at mental frontal slit through the human body. This schematic triangle later received the name of the Eintchovens triangle (Fig. 4). With its help it is possible to get more clear notion concerning the genesis of the electrocardiogram leads. Rt arm Lt arm Lt leg Fig. 4. Eintchovens triangle Each lead of the ECG “views” the heart from a different perspective. Though any single lead may allow determination of the heart rate and rhythm, analysis of multiple leads provides more comprehensive information. For clinical purposes, the routine ECG is recorded by attaching 10 electrodes to the body (one to each limb, 6 on the chest) to form 12 ECG leads. To record limb leads the electrodes are applied to the extremities. To achieve better ECG recording and avoid errors coloured marking of electrodes is used according to the light signal principle: electrode attached to the right arm (in the forearm area) is of the red colour, to the left arm (in the forearm area) is of the yellow colour, to the left leg (in the shin area) is of the green colour; to the right leg (in the shin region) black electrode is attached. The right leg electrode functions as a ground and doesn’t affect the character of electric signals recorded by the ECG. 17 The 12 conventional ECG leads record the difference in the potential between electrodes placed on the surface of the body. These leads are divided into two groups: six extremity (limb) leads and six chest (precordial) leads (Fig. 5). The extremity leads record potentials transmitted onto the frontal plane, and the chest leads record potentials transmitted onto the horizontal plane. The six extremity leads are further subdivided into three standard - bipolar - leads (I, II, and III) and three augmented - unipolar - leads (aVR, aVL, and aVF). Each bipolar lead measures the difference in the potential between electrodes at two extremities: a) lead I: Rt arm (-) Lt Arm (+), b) lead II: Rt arm (-) Lt Leg (+), c) lead III: Lt arm (-) Lt Leg (+). ATTENTION: the right arm is always connected with the negative pole of the galvanometer, the left leg is always connected with the positive pole of the galvanometer while the left arm can be connected both with the positive pole of the galvanometer (I lead), and the negative one (III lead). The unipolar leads as well as the standard ones record the difference in the potentials between two points of the body located in the front plane. In the augmented leads one electrode is indifferent that has approximately zero potential (its potential is near to zero), it is attached to the negative pole of the galvanometer; the second – active electrode, is attached to the positive pole of the galvanometer. The augmented leads are designated by letter symbols, where lowercase “a” (from “augmented”) indicates that these unipolar potentials are electrically augmented by 50 percent, V – for the physical symbol of voltage, while the letters R, L, F are for right, left, and foot correspondingly: a) aVR: Rt Arm (+), b) aVL: Lt Arm (+), c) aVF: Lt Leg (+). Other limbs serve as common ground.
- 10. 18 Fig. 5. ECG-leads. 1 - Standard Limb Leads 2 - Augmented Limb Leads 3а – Unipolar chest (precordial) leads (position of the exploring electrode) 3b – Axes of the chest leads in the horizontal plane The spatial orientation and polarity of the six frontal plane leads is represented on the hexaxial diagram (Fig. 6). Each ECG lead has a specific spatial orientation and polarity. The positive pole of each lead axis (solid line) and negative pole (hatched line) are designated by their angular position relative to the positive pole of lead I (0). The mean electrical axis of the QRS complex is measured with respect to this display. 19 Fig. 6. Hexaxial diagram (ПР – right arm, ЛР – left arm). In recording the chest leads the indifferent electrode is attached to the negative pole of the galvanometer and the active electrode connected with the positive pole of the galvanometer is placed on the different points of the chest. The chest leads are designated by the letter V (the physical symbol of voltage): V1, V2, V3, V4, V5, V6, etc. The six chest leads (Fig. 5-3a) are unipolar recordings obtained by electrodes in the following positions: a) V1 - fourth intercostal space (ICS), just to the right of the sternum; b) V2 - fourth ICS, just to the left of the sternum; c) V3 - midway between V2 & V4; d) V4 - midclavicular line (MCL), fifth ICS; e) V5 - anterior axillary line (AAL), the same level as V4; f) V6 - midaxillary line (MAL), the same level as V4 and V5. Sometimes other leads are recorded: V7 (the crossing place of the same horizontal line as for V4, V5, V6 with the left posterior axillary line), V8 (the crossing place of the same horizontal line with the scapular line), V9 (the crossing place of the same horizontal line with the paravertebral one). Conditionally (!) V1, V2 leads are referred to the so called “right” chest leads, V5, V6 – to the “left” chest leads, and V3,V4 are called “the transitional zone”. It is very useful in the assessment of the state of the
- 11. 20 cardiac muscle increase. In the hypertrophy of the right atrium or the right ventricle the potentials of the “right half of the heart” prevail which leads to the amplitude increase of the corresponding ECG waves in the right chest leads. Potentials predominance of “the cardiac left half” in the hypertrophy of the left atrium or the left ventricle is shown on the ECG by the amplitude increase of the corresponding waves in the left chest leads. Together, the frontal and horizontal plane electrodes provide a three-dimensional representation of cardiac electrical activity. The conventional 12-lead ECG can be supplemented with additional leads under special circumstances. For example, right precordial leads V3R, V4R, etc. are useful in the detecting evidence of acute right ventricular ischemia. Esophageal leads may reveal atrial activity not detectable on the surface ECG. In bedside telemetry units and ambulatory ECG (Holter) recordings one or two modified leads are usually employed. GENESIS OF THE NORMAL ECG P WAVE The normal atrial depolarization vector is oriented downward and toward the subject's left, reflecting the spread of depolarization from the sinus node to the right and then the left atrial myocardium (Fig. 7). Since this vector points toward the positive pole of lead II and to the negative pole of lead aVR, the normal P wave will be positive in lead II and negative in lead aVR. By contrast, activation of the atria from an ectopic pacemaker in the lower part of either atrium or in the AV junction region may produce retrograde P waves (negative in lead II, positive in lead aVR). QRS COMPLEX Normal ventricular depolarization proceeds as a rapid, continuous spread of activation wavefronts. This complex process can be divided into two major, sequential phases, and each phase can be represented by a mean vector. The first phase is depolarization of the interventricular septum from the left to the right (Fig. 7). 21 Fig. 7. The ECG deflections (P & Q). P-wave: excitation of the atrial myocardium, initiated by the impulse discharge from the sino-atrial node. PQ-interval: passage of the impulse through the atrio-ventricular node (slow) and a-v bundle (rapid). Q wave: excitation of the interventricular septum from the Left bundle branch, fractionally before the rest of the ventricular myocardium. The second phase results from the simultaneous depolarization of the main mass of the right and left ventricles; it is normally dominated by the more massive left ventricle, so that vector 2 points leftward and posteriorly (Fig. 8). Fig. 8. The ECG deflections (R wave). Synchronous excitation of the majority of both ventricles, via respective bundle branches; wave travels outwards through ventricular walls, average direction being mainly influenced by preponderant LV mass. S wave deflects when excitation of remote portion of RV wall occurs, fractionally later than main ventricular excitation (Fig.9).
- 12. 22 Fig. 9. The ECG deflections (S wave) Therefore, a right precordial lead (V1) will record this biphasic depolarization process with a small positive deflection (septal r-wave) followed by a larger negative deflection (S wave). A left precordial lead, e.g. V6, will record the same sequence with a small negative deflection (septal q wave) followed by a relatively tall positive deflection (R wave). Intermediate leads show a relative increase in R-wave amplitude (normal R-wave progression) and a decrease in S-wave amplitude progressing across the chest from right to left. The precordial lead where the R and S waves are of approximately equal amplitude is referred to as the transition zone (usually V3 or V4). Interval during which the ventricular myocardium remains in “excited” (depolarised) state is called as an ST interval (Fig. 10). Fig. 10. ST interval. T WAVE AND U WAVE Spread of electrical recovery wave through ventricular walls is slower than excitation. Normally, the mean T-wave vector is oriented roughly concordant with the mean QRS vector. Since depolarization and repolarization are electrically opposite processes, this 23 normal QRS-T-wave vector concordance indicates that repolarization must normally proceed in the reverse direction from depolarization (i.e., from the epicardium to the endocardium or from the cardiac apex to the base). The normal U-wave is a small, rounded deflection that follows the T-wave and usually has the same polarity as the T wave. An abnormal increase in the U-wave amplitude is most commonly due to drugs (e.g., quinidine, procainamide, disopyramide) or hypokalemia. Very prominent U-waves are a marker of increased susceptibility to the torsades de pointes type of ventricular tachycardia. Diastolic interval, during which the myocardium remains in the resting (repolarised) state until sinoatrial discharge initiates the next cardiac cycle. REMEMBER: 1. P-wave – atrial depolarization. 2. PQ(R)-interval – depolarization of atriae & AV-node. 3. QRS – ventricular depolarization. 4. ST-segment – electrical quiescence. 5. U-wave – part of ventriculae repolarization, corresponds to period of time when ventricles are most vulnerable to developing serious ventricular arrhythmias. THE ECG WAVE FORM The ECG graphic recording consists of the main line (isoline) and the deflections from it (waves). ECG sections between the adjacent waves are called the segments and the distances between different waves including the segments are called the intervals. The waves, segments and intervals of the ECG are designated by P, Q, R, S, T letters (Fig. 11). QRS terminology. The individual components of the ventricular excitation complex (QRS) are conventionally labelled as follows: - 1st positive deflection - “R”, - 2nd and more positive deflection - “R ”, - negative deflection preceding R - “Q”,
- 13. 24 - negative deflection following R - “S”. If a wave amplitude is more than 5 mm, the capital letter (e.g. R) is written, if it is less than 5 mm, the small letter (e.g. r) is written. Fig. 11. The ECG wave form. 25 P-wave Duration 0,06 - 0,10 sec; amplitude 0,5 – 2,5 mm. Р-wave is recorded after the impulse leaves the sinus node and corresponds to the time of atria excitation. The wave РII > РI > РIII and PII, III, aVF < TII, III, aVF in the norm. РI, РII, РV2-V6 - always positive. РIII, РV1 – can be positive, two-phase or negative. РaVR - always negative. Time of the internal deflection of atrtia (TIDA ) Time of atrial activation reflecting the time from the beginning of the atrial excitation to the excitation envelopment of the maximal amount of its muscular fibers. It is measured from the beginning of the P-wave up to its apex. TIDA 0,04 sec is normal for the right atrium, TIDA 0,06 sec is normal for the left one. PQ(R)-interval Duration 0,12 - 0,20 (0,21) sec. PQ interval includes P-wave and PQ(R)-segment and reflects the time of the excitation spreading on the atria and AV-junction, i.e. it characterizes the duration of AV impulse passage. PQ-interval tends to increase with a patient’s age; in bradycardia PQ can make up to 0,21 sec. In tachycardia PQ interval shortens (PQ normal values are advised to determine by special tables). Makruz Index: 1,1 - 1,6 sec in the norm. It is performed according to the formula [P:PQ], where P is for the P-wave duration while PQ is for the duration of PQ-segment. This index is used in the diagnosis of atrial hypertrophy. QRS complex Duration 0,06 - 0,10 sec. QRS-complex is recorded during excitation spreading along the myocardium of the ventricles. Q-wave: duration < 0,03 sec, amplitude Q < 1/4 R (of the same lead). R-wave: in standard and augmented leads R-wave amplitude depends upon electrical axis location; in the chest leads R-wave amplitude mustn’t exceed 25 mm. Normally the amplitude of QRS- complex must exceed 5 mm in one of standard leads and 8 mm in one of the chest leads at least.
- 14. 26 S-wave: duration SI < 0,04 sec, amplitude SI = 0 - 4 mm. S in not obligatory wave, by the amplitude usually makes up ⅕– ¼ from the R-wave. Time of the internal deflection of ventricles (TIDV ) The activation time of the left and right ventricles is measured from the beginning of QRS-complex up to the perpendicular drawn from the R apex to the isoline. TIDV reflects the time from the beginning of the ventrical excitation to the excitation envelopment of the maximal amount of its muscular fibers. In the norm TIDV of the left ventricle 0,04 sec (is determined in V5 –V6), and TIDV of the right ventricle 0,03 sec (is determined in V1 –V2). ST-segment Normally it is located on the isoline. It can be wavy, oblique ascending or oblique descending, but only in 1 mm limits. N.B.! If 1 mm dislocation of ST-segment appears in dynamics, it is necessary to exclude the pathological ST depression or elevation. ST-segment reflects the period when both ventricles are excited. T-wave Duration 0,1 - 0,25 sec, amplitude ТI, II - 3 - 5 mm. T-wave reflects processes of ventricular repolarization. The largest (by its amplitude) T-wave is naturally recorded in the lead where there is the largest (by its amplitude) R-wave, and ТI>Т III. Normally ТI, II, V2-6 is always positive, ТIII, aVL, V1 can be smooth, negative or two-phase. QT-interval Duration 0,35 - 0,44 sec. QT-interval is called the ventricular electric systole. QT duration depends upon the heart rate and patient’s sex. That’s why to calculate the QT duration the Bazette formula [QTс=k√RR] is used, where RR is for the distance between the adjacent R-waves on the ECG in seconds; k=0,37 for men and k=0,40 for women. Besides the standard tables of the ventricular electric systole for a given sex and the heart rate are used. Increase of the QT-interval is diagnosed in QTc > 0,44 sec. Another parameter, dispersion (variability) of QT-interval (QTcd), is nowadays considered to be a marker of nongomogeneity of repolarization 27 processes. Dispersion of the QT-interval is calculated by the formula [QTcd=QTmax-QTmin] (thus the difference between maximal and minimal values of the QT-interval, measured in the 12 leads recorded within 3-5 minutes at the recording rate of 25 mm/sec is determined). QT-interval increase is a risk factor of sudden death from the ventricular fibrillation. Dispersion increase of QT-interval is a predictor of the development of fatal arrhythmia and sudden death. U-wave Amplitude 1 - 2 mm, inconstant wave. The clinical importance has a marked U-wave (U T), which can point at hypokalemia. The U-wave amplitude also increases in bradycardia, physical exertion, complete heart block, use of cardiac glycosides, quinidine, novocainamide, etc. TP-segment It is heart diastole. The segment is located on the isoline, its duration depends upon the heart rate. RR-interval Normally it can differ on one EKG, the difference shouldn’t be more than 0,1 sec. RR characterizes the duration of the cardiac cycle (of systole and diastole). Measurement of heart rate (HR) Precise calculation of the heart rate requires measurement of cycle length. This is the duration between any two analogous deflections of successive complexes (R peak to R peak is often the most convenient). Measure RR-interval in sec (at 50 mm/sec paper speed, each small box = 0,02 sec, each large box = 5 small boxes = 0,1 sec). Divide 60 (the number of sec per minute) by RR: HR=60/RR. A short-cut, approximate estimate of the rate can be made by dividing 600 to the number of large divisions in one cardiac cycle, e.g. in 6 large divisions in one cardiac cycle the heart rate is 100 beats per minute, 10 large divisions - 60 beats per minute and so on. When ECG is recorded at 50 mm/sec, the number of large boxes separating 2 R-waves corresponds to HR as follows:
- 15. 28 RR-interval (number of large boxes) 12 11 10 9 8 7 6 5 4 Heart rate 50 55 60 66 75 85 100 120 150 Regularities of the correlation of elements of the normal ECG 1. All three standard leads can’t simultaneously have the complete set of waves forming QRS-complex. That is, if Q and S are recorded in two leads, then there won’t be these waves in the third lead. The largest by the amplitude Q-wave is recorded in the lead with maximal R-wave. Heart turns around the diametrical (transversal) axis are marked as a turn by the apex upwards or backwards. In the upward turn of the apex Q-waves are recorded while in the backward turn S-waves in I, II, III (aVF) leads are recorded. The presence of Q (no pathological) in all three standard leads is marked as “the syndrome of three Q” while the presence of S – “the syndrome of three S”1 . 2. Normally Q-wave is absent in V1-2. Beginning with V4 there appears Q, its amplitude mustn’t exceed ¼ of the R-wave, its duration being not more than 0,03 seс. 3. In chest leads the S-wave has the largest amplitude in V1-2, and the least one - in V5-6. ELECTRICAL AXIS At any point in time, the projection of cardiac electrical forces on to the chest wall may be described as a VECTOR - a force with both MAGNITUDE and DIRECTION. Though the instantaneous vector changes throughout the cardiac cycle, one can calculate the NET or AVERAGE VECTOR of the P-wave, the QRS and the T-wave. This average vector is termed the ELECTRICAL AXIS (EA). Clinically, most information is derived from the QRS axis in the frontal plane (that is the plane running head-to-toe down the surface of the chest), which describes the pattern of left ventricular (LV) depolarization. The 6 frontal plane ECG leads 1 “S-syndrome” is rS-complex in I, II, III, aVF leads and is detected mostly in young people of asthenic build with the small middle-located heart. 29 form a hexaxial reference system. The heart is viewed as being at the centre of the 6 lead arrays (Fig. 6, 12). Fig. 12. Hexaxial system The QRS pattern in the extremity leads may vary considerably from one normal subject to another depending on the electrical axis of the QRS, which describes the mean orientation of the QRS vector with reference to the six frontal plane leads (Fig. 13-15). Normally, the QRS axis ranges from 30 to 69. An axis more negative than 30 is referred to as a horizontal position, more negative than 0 - as a left axis deviation. An axis more positive than 70 is referred to as a vertical position, while an axis more positive than 90 is referred to as a right axis deviation. REMEMBER: There are the following positions of EA: 1) normal electrical axis position: = +30 +69, 2) horizontal electrical axis position: = 0 +29, 3) vertical electrical axis position: = +70 +90, 4) left electrical axis deviation: = -1 -90, 5) right electrical axis deviation:= +91 +180.
- 16. 30 Left axis deviation may occur as a normal variant but is more commonly associated with left ventricular hypertrophy, a block in the anterior fascicle of the left bundle system (left anterior fascicular block or hemiblock), or inferior myocardial infarction. Right axis deviation also may occur as a normal variant (particularly in children and young adults), as a spurious finding due to the reversal of the left and right arm electrodes, or in such conditions as the right ventricular overload (acute or chronic), infarction of the lateral wall of the left ventricle, dextrocardia, left pneumothorax, or left posterior fascicular block. The average direction of the main ventricular excitation phase (or electrical axis) determines the dominant QRS deflection. With the heart in its normal semi-vertical position, this is closest to the direction of lead II, which therefore has the tallest R wave. aVR has a dominant S (negative) deflection, since it records in the opposite direction. The smallest ventricular deflections normally occur in aVL, which is almost at right angles to the axis (Fig. 13). Fig. 13. Normal electrical position Positional variation alters the normal QRS pattern. When the heart is more horizontal than normal (left-axis deviation) lead I becomes the “axial lead” with the tallest R wave, and other leads are altered 31 correspondingly (Fig. 14). This variant is common in older and thick-set subjects and when the diaphragm is high (pregnancy, ascites). Fig. 14. Electrically horizontal heart The vertical position (right axis deviation) is less common as a normal variant in adults, but it is physiological in the early childhood. Lead I becomes negative, being now behind the axial direction (Fig. 15). Right ventricular hypertrophy, which displaces the average direction of excitation by increasing the right ventricular contribution to it is frequently responsible for this pattern. Axis calculation - vector method 1. Determine the total amplitude of the QRS complex (that is, the total positive forces -the total negative forces) in leads I & aVF. 2. Draw arrows of the appropriate length & direction for the QRS amplitude in each lead. For example, if the total amplitude in each lead is 6 mV (6 mm or 6 small boxes) then one draws a 6 mm arrow on the X-axis (lead I) pointing toward 0 degrees (the positive pole of lead I)
- 17. 32 and a 6 mm arrow on the Y-axis (lead aVF) pointing toward 90 degrees (the positive pole of lead aVF). 3. Sum the two vectors: they form an isosceles triangle, the hypotenuse of which is the vector sum. The angle of the vector sum is the electrical AXIS of the QRS complex - 45 degrees in this case. Fig. 15. Electrically vertical heart Estimation of QRS Axis For clinical purposes, calculation of the exact angle representing the QRS axis is not necessary. For quicker assessment of it is sufficient, with the help of Hexaxial system (Fig. 12), to orientate on the following three basic rules: 1. Find the lead which defines the highest R-wave in the minimal S- wave or without S-wave – EA is located in this area. E.g.: RImax - horizontal electrical axis position, RaVLmax - left electrical axis deviation, RIImax - normal electrical axis position, RaVFmax - vertical electrical axis position, RIIImax - right electrical axis deviation. 33 2. Find the lead which defines low, approximately equal R-waves and S-waves. EA will be perpendicular to the lead. 3. If the largest equal amplitude of R-waves is approximately determined in two leads, then EA is located in the middle between them. APPROACH TO ECG ANALYSIS The best way to analyze the ECG, especially at first, is to systematically look at: 1. Rate and rhythm. 2. Axis. 3. P-wave morphology (size, shape, duration). 4. PQ(R) interval. 5. QRS morphology (size, shape, duration). 6. ST-segment, T-wave, U-wave changes. 7. QT interval. 8. Comparison with the previous tracings, if exist (Do the present findings differ from the previous ECG?). 9. Fill in the ECG-card: 1. Name ______________________________________________ 2. Age ________________________________________________ 3. Clinical diagnosis _____________________________________ 4. The date of examination ________________________________ ECG analysis: I. Rhythm _____________________________________________ II. The count of waves amplitude and intervals duration: PI=____ mm; PII=____ mm; PIII=____ mm; PQ=______ sec QI=____ mm; QII=____ mm; QIII=____ mm; PII= ______sec RI=____ mm; RII=____ mm; RIII=____ mm; QRSII=_____sec SI=____ mm; SII=____ mm; SIII=____ mm; QRSTII=_____sec ТI=____ mm; ТII=____ mm; ТIII=____ mm; RRII=_____sec III. Heart rate (per minute) _______________ IV. Deflection from the norm of ST-segment and T-wave _______ V. The electric systole of the ventricles _____________ VI. ______________ Conclusion: rhythm, heart rate, electric axis position, conductivity change, interpretation of the changes of the waves and ST-segment.
- 18. 34 CONTROL TASKS AND QUESTIONS 1. Characterize the normal ECG elements (origin, duration, amplitude): - Р-wave, - PQ-interval, - Q, R, S waves; QRS-complex; - ST-segment, Т-wave; - U-wave. 2. How is Makruz index calculated, what is it used for? 3. How does the segment differ from the interval? 4. Characterize the notion of “the time of internal deflection of atria and ventricles. 5. What does the electric systole of the ventricles mean? How can you correctly determine the value of QT-interval of a specific patient? 6. Characterize the obligatory leads in ECG recording. 7. How can you determine the heart rate? 8. How can you calculate the angle of the heart electric axis deviation ( )? 9. What are the ECG signs of the heart electric axis deviation to the left? 10. What are the ECG signs of the heart electric axis deviation to the right? 11. Analyze the ECG (Fig. 16) according to the following parameters: 1) РI______(mm)____ (sec) 2) PQI interval ____(sec) 3) QRSI____(sec) 4) QI_______(mm)______(sec) 4) ТI _______(mm)_____(sec) 5) QTI interval _____(sec) 6) ___________ 7) Makruz index I_______; Makruz index III______ 8) TIDA , TIDV 35 Fig. 16. Electrocardiogram for control task No 11.
- 19. 36 UNIT 1 Theme 2. ATRIAL AND VENTRICULAR HYPERTROPHY. RIGHT AND LEFT BUNDLE (BUNDLE OF HIS) BRANCHES BLOCK Goal: - to get a notion about atrial and ventricular hypertrophy, right and left bundle (bundle of His) branches block; to master skills. Knowledge objectives: - to know general ECG-signs of cardiac hypertrophy, signs of atrial and ventricular hypertrophy, the main and accessory ways of the impulse conduction from the sinus node on the atria and ventricles; general signs of disturbance of the impulse conduction in the ventricular conducting system (intraventricular blocks); signs of bundle of His block. Skill objectives: - to develop practical skills in analyzing electrocardiogram with signs of hypertrophy of cardiac parts and bundle of His block EDUCATIONAL MATERIAL The P Wave The P wave is due to depolarization of the atrial myocardium, normally initiated by the sinoatrial node situated high up in the right atrium (RA). Normally, both atria are activated so quickly that all of the atrial activation inscribes a single-humped P-wave on the II lead (Fig. 17). Left atrial (LA) abnormalities occur when delay in LA activation allows separation of RA and LA activation to be seen in some of the ECG leads, manifest as 2 peaks in P-wave in II, III or aVF with > 0.04 sec separating the two peaks or diphasic P-wave in V1 with terminal negative (inverted) portion (Fig. 18). 37 Fig. 17. P-wave form in the norm LA abnormality (LAA) occurs when a disease process affects the LA more than the RA. Any process that increases the pressure and/or volume of the LV will cause LA hypertension and/or dilatation & LA abnormality. Used to be called the Left Atrial Enlargement (LAE) but changed to LAA with recognition that delay in LA activation can occur without actual enlargement of the LA. Fig. 18. Left atrial abnormality. Due to disease affecting RA more than LA the right atrial abnormality (RAA) occurs (Fig. 19). Most common cause of it is Pulmonary Hypertension due to congenital heart disease in children & Lung disease in adults.
- 20. 38 Fig. 19. Right atrial abnormality. Since the average direction of spread of excitation is downwards and leftwards, P is usually upright in all three standard limb leads and maximal in II (Fig. 20, a). Occasionally P may be inverted or diphasic in lead III in normal subjects (Fig. 20, b). Inversion of P in leads II and III is indicative of the shift of the pace-making function to a focus low down in the right atrium, the resultant being directed upwards and to the left - so-called "coronary sinus rhythm" (Fig. 20, c). In congenital dextro-cardia excitation is downwards and rightwards, causing P inversion in I and maximum positivity in III (Fig. 20, d). REMEMBER: Delay in the left atrial (LA) component results in widened and bifid or dome-shaped P waves most obvious in lead I, II, aVL, the usual cause being LA hypertrophy secondary to mitral stenosis – P-mitrale (Fig. 18, 20 - e & f). Criteria: two peaks P-wave in I, II, aVL 0,11 sec; biphasic P wave in V1 with predominant negative part. 39 Fig. 20. P-wave forms REMEMBER: RA hypertrophy, by increasing and slightly delaying the RA contribution, causes tall, peaked waves exceeding the maximum normal amplitude of 2.5 mm in lead II (Fig. 19, 21). Since the P wave axis tends to be more vertical than normal, the exaggerated P is usually also well reproduced in III, aVF. The sign is known as P-pulmonale because of its frequent association with pulmonary heart disease but may be due to RA hypertrophy from any cause e.g. tricuspid stenosis. Criteria: P-wave in II, III, aVF 2,5 mm tall. If biphasic P wave in V1, positive part of P wave predominates.
- 21. 40 Fig. 21. Tall, peaked P waves in II & III due to RA hypertrophy. VENTRICULAR HYPERTROPHY Left Ventricular Hypertrophy (LVH) Echocardiographic studies have shown that the ECG is an insensitive tool for diagnosing LVH (a condition associated with increased cardiovascular mortality). LVH is suggested by a constellation of ECG findings: 1) Increased QRS voltage - various criteria have been proposed. LV leads (V5-6) show tall, slightly widened R waves, while on the right side (V1-2) correspondingly altered S waves appear (Fig. 22, a). 2) Though amplitude by itself is not a reliable criterian for excluding LV hypertrophy (because of variation in such factors as skin resistance and thickness of subcutaneous tissue), commonly accepted criteria of LVH include: - R or S wave in limb leads > 20 mV - R in aVL > 11 mV - Sum of RV1 (RV2) + SV5 (SV6) >35 mV 3) Overall QRS duration is increased to somewhere between 0,10- 0,12 sec. Early LV hypertrophy shows only these QRS changes. In severe hypertrophy, the changes of S-T depression and T wave inversion are added to the left-sided pattern, the results of prolongation of the excitation phase and reversal of the normal direction in which recovery takes place (Fig. 22, c). An intermediate or moderate grade can be recognized in which there is slight S-T depression accompanied by T wave flattening without frank inversion (Fig. 22, b). 41 Fig. 22. Left ventricular hypertrophy. The heart is usually electrically horizontal, i.e. there is left axis deviation in the limb leads. The abnormal LV surface pattern is therefore transmitted chiefly to I and aVL, with the right-sided S waves going to III and aVF (Fig. 23). Fig. 23. Left ventricular hypertrophy with electrically horizontal position.
- 22. 42 Occasionally, the normal semi-vertical position is maintained. This so-called concordant LV hypertrophy pattern characteristically occurs in aortic stenosis, where hypertrophy is unaccompanied by over-filling and dilatation of the LV cavity. Lead II remains the “axial lead”, showing the tallest R wave and reflecting the left-sided S-T changes (Fig. 24). Fig. 24. Left ventricular hypertrophy with electrically semi-vertical position. Right Ventricular Hypertrophy (RVH) Changes due to RV hypertrophy are best seen in leads recorded from near the surface of the right ventricle itself, i.e. VI and V2. The terminal R deflection is delayed and increased in amplitude. In early RVH the only abnormality may be an increase in R-R duration to more than 0,04 of a second (Fig. 25). Fig. 25. Early Right ventricular hypertrophy. A clearly dominant R in V1 suggests a more advanced grade, while severe RVH causes R dominance extending from VI to V2 or V3, accompanied by T wave inversion and S-T depression (Fig. 26, 27). More remote leads do not always reflect the increase in the right ventricular mass. Left-sided chest leads may show the reciprocal change of a delayed or prominent terminal S wave (Fig. 26). 43 Fig. 26. Severe Right ventricular hypertrophy (in pulmonary fibrosis) The limb leads usually indicate right axis deviation, the average electrical force of ventricular excitation being displaced by the increased RV contribution (Fig. 25-27). In severe cases, the right-sided S-T changes tend to be transmitted to leads III, aVR and aVF (Fig. 26). Fig. 27. Severe Right ventricular hypertrophy (in cyanotic congenital heart disease). Three ECG patterns of RVH have been described: 1) Type A: a) R > S in VI - V2 usually due to severe RVH (R-type) b) M-shaped form of QRS-complex (M-type) 2) Type B: R = S in V1-V6 in states of predominantly septal hypertrophy (i.e. Tetralogy of Fallot) 3) Type C: Prominent S waves in V5-V6. All 3 kinds of RVH are commonly accompanied by the Right axis deviation and Right atrial abnormality. INTRAVENTRICULAR CONDUCTION DISTURBANCES (BUNDLE OF HIS BRANCHES BLOCK) Block of one or other bundle branch delays contraction of the corresponding ventricle, excitation of which has then to take place by
- 23. 44 relatively slow muscle-to-muscle conduction from the contralateral ventricle. Leads recorded in the direction of the delayed ventricle display a predominantly positive M-shaped QRS complex exceeding 0,12 seconds in duration, followed by S-T segment depression and T wave inversion (Fig. 28): these features are due to the abnormally slow approach of the excitation wave. Leads recording in the opposite direction, i.e. overlying the contralateral ventricle, show the reciprocal pattern of a widened, notched S wave resembling the letter W. Fig. 28. M-shaped QRS complex of bundle branch block. Intrinsic impairment of conduction in either the right or left bundle system (intraventricular conduction disturbances) leads to prolongation of the QRS interval. With complete bundle branch blocks the QRS interval is 0,12 sec in duration; with incomplete blocks the QRS interval is between 0,10 and 0,12 sec. The QRS vector is usually oriented in the direction of the myocardial region where depolarization is delayed. Thus, with right bundle branch block, the terminal QRS vector is oriented anteriorly and to the right (rSR in V1 and qRS in V6, typically). Left bundle branch block alters both early and later phases of ventricular depolarization. The major QRS vector is directed to the left and posteriorly. In addition, the normal early left-to-right pattern of septal activation is disrupted such that septal depolarization proceeds from right to left as well. As a result, left bundle branch block generates wide, predominantly negative (QS) complexes in lead V1 and entirely positive (R) complexes in lead V6. A pattern identical to that of the left bundle branch block, preceded by a sharp spike, is seen in most cases of electronic right ventricular pacing because of the relative delay in left ventricular activation. 45 Bundle branch block may occur in a variety of conditions. In subjects without structural heart disease, the right bundle branch block is seen more commonly than the left bundle branch block. Right bundle branch block also occurs with heart disease, both congenital (e.g. atrial septal defect) and acquired (e.g. valvular, ischemic). Left bundle branch block is often a marker of one of four underlying conditions: ischemic heart disease, long-standing hypertension, severe aortic valve disease, and cardiomyopathy. Bundle branch blocks may be chronic or intermittent. A bundle branch block may be rate-related; for example, often it occurs when the heart rate exceeds some critical value. Bundle branch blocks and depolarization abnormalities secondary to artificial pacemakers not only affect ventricular depolarization (QRS) but are also characteristically associated with secondary repolarization (ST-T) abnormalities. With bundle branch blocks, the T wave is typically opposite in polarity to the last deflection of the QRS. This discordance of the QRS-T-wave vectors is caused by the altered sequence of repolarization that occurs secondary to altered depolarization. LEFT BUNDLE BRANCH BLOCK Diagnosis is a simple matter of inspecting the chest leads. In left bundle branch block (LBBB) the left-sided leads V5-6 show the positive M-shaped pattern, whereas the right-sided leads have the reciprocal W pattern (Fig. 29). Transmission of the abnormality to the limb leads depends on heart position. This is usually horizontal, as indicated by the arrow in the diagram. The left-sided pattern thus appears in leads I and aVL, while the right-sided pattern is reproduced in lead III and to a lesser extent in aVF. The typical limb lead appearances in left bundle branch block are shown in Fig. 30 (from the same record as Fig. 29). An additional feature of diagnostic importance which should be noted is the invariable absence of an initial Q deflection from the left- sided pattern. This is due to the fact that, when the left bundle branch is blocked, excitation of the intraventricular septum can no longer take place in the normal left-to-right direction.
- 24. 46 Fig. 29. Left bundle branch block. FASCICULAR BLOCKS Fascicular Blocks (partial blocks, “hemiblocks”) in the left bundle system (left anterior or posterior fascicular blocks): these are blockages of transmission that also may occur in the anterior or posterior branches (fascicles) of the left bundle branch. The main effect of a fascicular block is to markedly change the QRS axis without changing the shape or duration of the QRS wave form. Left Anterior Hemiblock As to the degree of the EA deviation to the left, characteristic of the block of the anterior branch of the left bundle branch (Left Anterior Hemiblock), yet there is no unanimous opinion in this respect. The majority of authors think EA sharp deviation to the left to be specific for this blockade, when -60. In that RI>RII>RIII, SIII>RIII, SII>RII, RaVRQ(S)aVR. , making up from -45 to -60, clearly points at the presence of the incomplete block of the anterior branch of the left bundle branch. In contrast to the complete block, in the incomplete 47 block of the anterior branch Q(S)aVR>RaVR. In <-30-45 one should make conclusion only concerning the EA sharp deviation to the left. Fig. 29. LBBB, horizontal heart position: transmission to limb leads. Left Posterior Hemiblock The majority of researchers think EA sharp deviation to the right to be characteristic of the block of the posterior branch of the left bundle branch (Left Posterior Hemiblock), when +120. In that RIII>RII>RI, SI>RI, RaVRQ(S)aVR. Diagnosis of the Left Posterior Hemiblock can be made in EA sharp deviation to the right (+120) and absence of pulmonary chronic disease, hypertrophy of the right ventricle, vertical position of the heart, and chest reformation, especially
- 25. 48 in people over 40 (who may have EA horizontal position). Incomplete Left Posterior Hemiblock may be supposed in ranging from +90 to +120 in people over 40 without clinical data concerning right ventricular hypertrophy, chest deformation and vertical position of the heart. RIGHT BUNDLE BRANCH BLOCK Right bundle branch block (RBBB) results in delayed activation of the right ventricle. In right-sided chest leads (Vl-2) this is manifested in delayed and heightened R waves followed by S-T segment depression and T wave inversion (Fig. 30). In left-sided leads, potentials due to normal left ventricular excitation continue to predominate, but there are correspondingly delayed and prominent terminal S waves. As in the case of the left BBB, the heart is usually more or less horizontal in position. The positive M-shaped complexes tend therefore to be transmitted to leads III and aVF, while left-sided limb leads like lead I display the exaggerated S wave. Fig. 30 demonstrates these typical appearances. Fig. 30. RBBB, usual horizontal heart position. 49 Occasionally, however, the heart is vertical, when casual examination of the limb leads alone may be misleading. Right BBB, obvious in the chest leads, gives limb lead appearances resembling those usually associated with a lesion of the left bundle - apart from a positive complex in aVR (aVR always shows the right-sided pattern, regardless of heart position). Fig. 30 shows this vertical position with right BBB, together with partial A-V block. Fig. 30. Right BBB, vertical heart position, and prolonged PR interval.
- 26. 50 COMBINATIONS OF FASCICULAR AND BUNDLE BRANCH BLOCKS More complex combinations of fascicular and bundle branch blocks may occur involving the left and right bundle system. Examples of bifascicular block include the right bundle branch block and the left posterior fascicular block, right bundle branch block with left anterior fascicular block, and complete left bundle branch block. Chronic bifascicular block in an asymptomatic individual is associated with a relatively low risk of progression to high-degree AV heart block. In contrast, new bifascicular block with acute anterior myocardial infarction carries a much greater risk of complete heart block. Alternation of right and left bundle branch block is a sign of trifascicular disease (Fig. 31). However, the presence of a prolonged PR interval and bifascicular block does not necessarily indicate trifascicular involvement, since this combination may arise with AV node disease and bifascicular block. Intraventricular conduction delays can also be caused by extrinsic (toxic) factors that slow ventricular conduction, particularly hyperkalemia or drugs (type 1 antiarrhythmic agents, tricyclic antidepressants, phenothiazines). Fig. 31. Trifasicular block (Complete Right Bundle Branch Block, Left Anterior Hemiblock, and Long PR interval). 51 CONTROL TASKS AND QUESTIONS 1. Name the P-mitrale signs. 2. Name the P-pulmonale signs. 3. What leads is it better to diagnose the atrial combined hypertrophy in? 4. What is characteristic of the left ventricular hypertrophy? 5. Enumerate and characterize ECG variants of the left ventricular hypertrophy. 6. Fill in the table: Variants of the left ventricular hypertrophy Variants Form of QRS complex in V1-2, III, aVF Form of QRS complex V5-6, I, aVL Change of the terminal part of the ventricular complex Type A (“R-type”) Type A (“M-type) Type B Type C 7. Name the general signs of intraventricular conduction disturbance. 8. Fill in the table: Disturbance of intraventricular conduction ECG-signs in V1-2, III, aVF ECG-signs in V5-6, I, aVL Right bundle branch block Left bundle branch block
- 27. 52 UNIT 2 Theme 1. SINUS RHYTHM DISTURBANCES. SINO-ATRIAL BLOCK. ATRIOVENTRICULAR BLOCK. PREEXCITATION SYNDROME. Goal: to get a notion about sinus rhythm disturbances, sino-atrial block, and atrioventricular block; to master skills. Knowledge objectives: to know the general signs of the disturbance of impulse conduction at different levels (sinus node, atria, atrioventricular node), the criteria of sinus rhythm disturbances, sino-atrial block, and atrioventricular block; approach to ECG-rhythm analysis. Skill objectives: to develop practical skills in analyzing electrocardiogram with sinus rhythm disturbances, sino-atrial block, and atrioventricular block. EDUCATIONAL MATERIAL BASIC CAUSES OF THE HEART RHYTHM DISTURBANCE There are three basic causes of disturbance of the heart rhythm: 1. Suppression or enhancement of initiation or propagation of the action potential. 2. Re-entry of the action potential into a pathway through which it has already passed. 3. Triggered activity. 1. Suppression or Enhancement of Initiation or Propagation of Action Potential A disease process that interferes with pacemaker activity within the SA node or with the movement of the electrical impulse through the normal conduction pathways of the heart results in abnormal slowing of the heart rate (bradyarrhythmia) and/or in one of the various forms of heart block. 53 Enhanced automaticity of a part of the cardiac conduction system may result in the initiation of an impulse more rapidly than is normally generated by the SA node. If that happens episodically, occasional premature contractions occur, the nature of which depends on the location of the ectopic pacemaker. On the other hand, if there is rapid sustained firing of the ectopic focus, a tachyarrhythmia ensues. 2. Re-entry Most clinically significant arrhythmias result from re-entry (Fig. 32). Re-entrant arrhythmias occur in the setting of two anatomically or functionally distinct conduction pathways, unidirectional conduction block in one of the pathways, and slowed conduction. When these three conditions are fulfilled, the electrical impulse may travel down one limb of the re-entrant circuit and return via the second limb of the circuit resulting in a “short circuit” or “circus” arrhythmia. The conditions needed for the development of re-entrant arrhythmias often occur in the setting of structural heart disease or, less commonly, result from anatomic abnormalities such as an accessory AV connection, as in the case of the Wolff-Parkinson-White (WPW) syndrome. 3. Triggered Activity Triggered arrhythmias are less common; they result from afterdepolarizations that follow an action potential and that reach threshold for triggering additional impulses. Examples of triggered arrhythmias include torsades de pointes, multifocal atrial tachycardia, and atrial tachycardia resulting from digitalis toxicity. SINUS RHYTHM DISTURBANCES Sinus rhythms originate in the sinoatrial node. Diagnosis of sinus rhythms requires examining leads II and aVR for the correct polarity of the P waves. The P wave is always positive in lead II and negative in lead aVR. P wave will precede each QRS complex, and the P-R interval should be constant. In adults the normal sinus rate is 60-90 (100) beats per minute.
- 28. 54 Figure 32. Sequence of activation of a loop of Purkinje fiber bundles and ventricular muscle (VM) during reentry. A region of unidirectional conduction block is indicated by the dark shaded area in branch B. Conduction cannot occur through this area in the antegrade direction (from B to VM), but only in the retrograde direction (from VM to B). Slow conduction is present in the loop. The bottom of the figure shows a possible electrocardiographic pattern that may result from this type of reentry. [From Wit AL, Rosen MR, Hoffman BF. Electrophysiology and pharmacology of cardiac arrhythmias. II. Relationship of normal and abnormal electrical activity of cardiac fibers to the genesis of arrhythmias. B. Re-entry, Section I. Am Heart J 88:664, 1974]. SINUS TACHYCARDIA Sinus rhythm with a rate > 90 (100) beats per minute is usually a physiologic rhythm in that the rate is ordinarily appropriate to the physiologic state of a patient, the state that requires an increased cardiac output to meet increased metabolic demands. With fast rates, P waves may be merged with preceding T waves and be indistinct. They can originate from the sinoatrial node, atrial muscle, or atrioventricular 55 junction, often referred to as supraventricular tachycardia without specifying the site of origin. SINUS BRADYCARDIA Sinus Bradycardia is a heart rate below 60 beats per minute. Impulse generation in the sinus node is often slow in aerobically well- conditioned people (e.g., long-distance runners, heavy labourers) because of high vagal tone. SICK SINUS SYNDROME In elderly people, the sinus node may undergo degenerative changes and fail to function effectively. Periods of sinus arrest, sinus tachycardia, or sinus bradycardia may occur. The term sick sinus syndrome refers to a heterogeneous group of arrhythmias involving defective impulse generation by the sinus node or abnormal impulse conduction in the atria and AV-node. The syndrome is characterized by periods of inappropriate sinus bradycardia (often severe with rates between 25 and 40 beats/minute) that may precede or follow supraventricular tachyarrhythmias and by varying degrees of sinoatrial block, sometimes including sinus arrest. The rubrics bradycardia-tachycardia syndrome and tachycardia-bradycardia syndrome are sometimes used, depending on whether bradycardia precedes or follows a tachyarrhythmia. The ECG may be normal or may simply reveal sinus bradycardia. Often, there are varying degrees of sinoatrial block, characterized by varying PP-intervals on the ECG. Sometimes sinus arrest occurs, manifested by absent P waves and usually associated with a junctional escape rhythm. Some patients have slow atrial fibrillation reflecting a concomitant AV conduction abnormality. SINOATRIAL BLOCK (SA BLOCK) SA block refers to failure of the sinus node to function for one or more beats. In this condition, there are simply one or more missing beats; i.e., there are no P waves and QRS complexes seen. Fortunately, when the sinus fails to function for a significant period of time (sinus
- 29. 56 arrest), another part of the conduction system usually assumes the role of a pacemaker. These pacing beats are referred to as escape beats and may come from the atria, the atrioventricular junction, or the ventricles. SA block of the 1 degree appears as a result of the delayed formation of impulses in the sinus node or their delayed conduction to the atria. It isn’t manifested clinically and electrocardiographically (by usual electrocardiographic examination). SA blocks of the II and III degree are clinically expressed as Morganji-Adams-Stocks attacks (sudden loss of consciousness, dizziness in mild cases, paleness, sometimes spasmodic convulsions, pulse and blood pressure disappearance). SA block of the III degree (complete SA block) is equivalent to the “sinus node arrest”. It is characterized by bradycardia and replacing rhythm (from atria, AV-junction, ventricles). By means of ECG it is possible to diagnose SA block of the II degree. SA block of the II degree means conduction disturbance when the normal sinus rhythm is interrupted by separate prolonged episodes during which the impulses, generated by sinus node, can’t reach the atria. Because of the block of impulses neither atria nor ventricles are excited thus leading to the disappearance of the whole complex of PQRST. There are 2 types of SA block of the II degree: 1) II degree SA block, Mobitz I (with Samoilov-Wenckebach periodics), or Wenckebach type; 2) II degree SA block, Mobitz II. II degree SA block, Mobitz I PQRST disappearance is indicated by a pause on the ECG, its duration is less than doubled shortest PP-interval. PP-interval on the ECG progressively shortens until there appears a pause next followed by repetition (Fig. 33). Fig. 33. Sinoatrial block, II degree, Mobitz I 57 II degree SA block, Mobitz II РР-interval between the conducted impulses is normal. PQRST disappearance is indicated by a pause on the ECG, its duration is multiple to the PP-interval duration, i.e. twice, three times, four times, etc. exceeds the duration of the normal PP-interval (Fig. 34). The pause duration is measured from the P-wave preceding the pause up to the P- wave following it. Fig. 34. Sinoatrial block, II degree. (falling out of the cardiac cycle (PQRST), presence of the pause equal to the doubled previous PP-interval) ATRIOVENTRICULAR HEART BLOCKS The PQ(R) interval normally varies with heart rate but should not exceed 0,21 sec in people in normal sinus rhythm. A prolongation of the PR interval is usually caused by degenerative, ischemic, or inflammatory changes in the AV conduction system. AV Heart block occurs in 3 forms: the first degree, the second degree, and the third degree. The second degree heart block is divided into two types: Mobitz type 1 and Mobitz type 2. First Degree Heart Block: First degree AV block in itself does not produce symptoms or abnormal physical findings except the first heart sound that is reduced in intensity. The ECG abnormality is simply a prolonged P-R interval to greater than 0,21 seconds (Fig. 35). Second-degree AV block is present when some but not all P waves are followed by QRS complexes. It is caused by conduction delay or block either in the AV node or in the conduction system below the AV node, most commonly caused by ischemic heart disease or idiopathic cardiomyopathy.
- 30. 58 Fig. 35. First-degree AV Block (PR interval prolonged to 0,4 sec; paper speed 25 mm/sec). Second Degree AV Block, or Mobitz-I AV block (with Samoilov- Wenckebach periodics), or Wenckebach type. This block within the AV node results in the Samoilov-Wenckebach phenomenon, characterized by progressive lengthening of the PR interval with shortening of the RR interval for several cycles until the P wave is blocked completely (Fig. 36). The dropped beat is seen as a P wave that is not followed by a QRS complex. The sequence begins again, often with a normal PR interval in the beat that follows the blocked P wave. The second degree AV block Mobitz-I is characterized by the ratio of the number of P waves to the number of QRS complexes in each cycle of block. In other words, if block occurs after every third P wave, it is called 3:2 Wenckebach. Fig. 36. Mobitz-I second-degree AV block. The Second Degree AV Block Type 2, or Mobitz-II AV block. It’s a more severe form of second degree block, since it often progresses to complete heart block. Mobitz-II block is defined as intermittent failure to conduct a P wave caused by the block below the level of the AV node (Fig. 37). The PR interval of the conducted beat before a blocked P wave is usually normal. The block may be intermitted or may occur in a fixed 2:1 or 3:1, etc. ratio. Coexistent bundle branch block is commonly seen. Progression to higher degrees of block or to asystole may occur rapidly. The characteristic ECG picture is that of a series of non- conducted P waves; e.g., 2:1, 3:1, 4:1, block. 59 Fig. 37. Mobitz-II AV block with 2:1 AV ratio. The Third Degree Heart Block, also known as a Complete Heart Block. Complete heart block occurs when there is a total failure of conduction of impulses from atrial through the AV junction to the bundle of His (or, more rarely, if all three fascicles below the His bundle are diseased). The atrioventricular junction does not conduct any stimuli from the atria to the ventricles. Instead, the atria and the ventricles are paced independently. The characteristic ECG-picture is: 1) P waves are present and occur at a rate faster than the ventricular rate; 2) QRS complexes are present and occur at a regular rate, usually <60 beats per minute (usually 40 beats per minute); 3) the P waves bear no relationship to the QRS complexes (Fig. 38). Thus, the “P-R intervals” are completely variable. The QRS complex may be of normal or abnormal width, depending on the location of the blockage in the AV junction. Fig. 38. Complete AV block (QRS-form is changed because of following posterior myocardial infarction). PRE-EXCITATION SYNDROME The atria and ventricles are electrically isolated from each other by the AV groove, and the electrical signal from the atria is conducted to the ventricle via the AV node and conducting system. If the AV groove is short-circuited by muscle fibers, if muscle fibers from the atria enter the His bundle below the AV node, or if muscle fibers from the His bundle bypass the bundle branches, a variable portion of the right or left
- 31. 60 ventricle is depolarized early. These short-circuiting fibers are known as accessory atrioventricular, nodoventricular and fasciculoventricular pathways - the atriofascicular bypass tract and the intranodal bypass tract, depending on their location (Fig. 39). Figure 39. Schematic diagram of possible accessory conduction pathways (old eponymic nomenclature in parentheses). A - atriofascicular (atrio-Hisian) bundles; K - accessory atrioventricular (Kent) bundles; J - intranodal bypass (James) tracts; M - Mahaim fibers: M1 - accessory nodoventricular; M2 - accessory fasciculoventricular; M3 - nodofascicular fibers. Dual AV node pathways are represented by the fast and slow symbols [from Wellens HJJ, Brugada P, Penn OC. The management of preexcita- tion syndromes. JAMA 257:2325, 1987] Two pre-excitation syndromes exist: 1) the Wolff-Parkinson-White (WPW)syndrome, 2) the Lown-Ganong-Levine (LGL) syndrome. The classic example of pre-excitation is WPW syndrome, which refers to patients with symptomatic accessory AV connections. This syndrome is characterized electrocardiographically by a short PR-inter- val followed by a wide QRS complex, which is a fusion beat between the ventricular myocardium that is pre-excited and that which is excited via normal conduction pathways (Fig. 40). The portion of the complex 61 caused by pre-excitation is called the delta wave because of its resemblance to the Greek capital letter delta (). If the accessory bundle connects the atria with the left ventricle, the electrocardiographic pattern resembles RBBB (type A WPW). On the other hand, if the connection is with the right ventricle, the pattern resembles LBBB (type B WPW); the negative -wave in lead II in this situation may be taken for a Q wave, and the mistaken diagnosis of remote myocardial infarction can be made. Figure 40. The Wolff-Parkinson-White syndrome. If the atrial fibers insert into the bundle of His and short-circuit the AV node, the P-R interval is short, but no -wave is seen because below the AV node conduction occurs along the usual pathways. This syndrome is known as the Lown-Ganong-Levine syndrome (LGL syndrome). A number of other variants of pre-excitation syndrome have been described but are much rarer than these two common disorders. The EGG manifestations of pre-excitation may vary from time to time in a given patient because, if conduction occurs through the normal anatomic pathways rather than through accessory fibers, no pre-- excitation is seen on the EGG. When pre-excitation is facilitated because of disease in the AV node or because of drugs that suppress conduction through the AV node (e.g., digitalis, calcium channel blockers, or -blockers), abnormalities on the EGG are seen. Re-entrant supraventricular arrhythmias are common in patients with pre-excitation; the estimates vary from 13 to 60%, usually paroxysmal supraventricular tachycardia, but atrial fibrillation and flutter also occur. The morphology of the QRS complex during the tachyarrhythmia depends on the direction in which the re-entrant tachycardia occurs. If re-entry occurs antegradly through the AV conducting system and retrogradly through an accessory pathway, then the QRS duration during tachyarrhythmia may be normal because
- 32. 62 the ventricle is depolarized in a normal direction through its normal specialized conducting tissue. If the circuit is established in the opposite direction, the QRS complex is wide, with a bundle branch block pattern, because most or all of the ventricle is depolarized by the way of the accessory pathway, and arrhythmia can easily be confused with ventricular tachycardia. REMEMBER: WPW syndrome Patients with WPW possess an accessory pathway of depolarization, the bundle of Kent. Three electrocardiographic criteria for WPW are: 1) short PR- interval, 2) wide QRS complex, 3) -wave. The QRS complex is widened by the -wave in exactly the same amount as the P-R interval is shortened. The -wave is a slurring of the initial portion of the QRS complex produced by the early depolarization. The major clinical manifestation of WPW is recurrent tachycardia. LGL Syndrome LGL is a result of some of the internodal fibers' (James fibers) bypassing the major portion of the atrioventricular node and terminating in the bundle of His. Three electrocardiographic criteria for LGL are: 1) short PR-interval without -wave, 2) normal QRS, 3) recurrent paroxysmal tachycardia. It should be noted that, unlike in WPW, episodes of tachycardia are required for the diagnosis of LGL. CONTROL TASKS AND QUESTIONS 1. How is the impulse conduction from the sinus node to the different parts of the heart performed? 2. What degrees of SA block is impossible to register on the ECG and why? 3. Name the ECG signs of the SA block of the II degree. 4. Name the ECG signs of the complete heart block. 5. Name the signs of the AV block of the II degree with Samoilov- Wenckebach periodics. 6. Name the signs of the AV block of the II degree, Mobitz I. 7. What does Pre-excitation Syndrome mean? 8. What is the difference between WPW & LGL syndromes? 63 9. Define the rhythm disturbance on the ECG given below (paper speed 25 mm/sec). № 1. № 2. № 3. № 4. № 5. № 6.
- 33. 64 UNIT 2 Theme 2. SUPRAVENTRICULAR ARRHYTHMIAS (PREMATURE ATRIAL AND JUNCTIONAL CONTRACTIONS, PAROXYSMAL SUPRAVENTRICULAR TACHYCARDIA, ATRIAL FIBRILLATION AND FLUTTER). VENTRICULAR ARRHYTHMIAS (VENTRICULAR PREMATURE BEATS, VENTRICULAR TACHYCARDIA, TORSADES DE POINTES AND THE LONG QT INTERVAL SYNDROME, AND VENTRICULAR FIBRILLATION). Goal: to get a notion about supraventricular and ventricular arrhythmias; to master skills. Knowledge objectives: to know the criteria of premature atrial and junctional contractions, paroxysmal supraventricular tachycardia, atrial fibrillation and flutter, ventricular premature beats, ventricular tachycardia, ventricular fibrillation, and the long QT interval syndrome; approach to ECG- rhythm analysis. Skill objectives: to develop practical skills in analyzing electrocardiogram with premature atrial and junctional contractions, paroxysmal supraventricular tachycardia, atrial fibrillation and flutter, ventricular premature beats, ventricular tachycardia, ventricular fibrillation, and the long QT interval syndrome. EDUCATIONAL MATERIAL SUPRAVENTRICULAR ARRHYTHMIAS Premature Atrial and Junctional Contractions Premature or Ectopic beats (contractions) arise in some focus other than the sino-atrial node and interrupt the regular sequence of normal sinus rhythm. The term extrasystole, often used synonymously, is only strictly accurate in relatively rare instances where the ectopic beat is literally interpolated between successive sinus beats (Fig. 41). 65 Fig. 41. True “extrasystole”. More often, the following sinus impulse finds the myocardium still refractory after its response to the ectopic stimulus, and the next beat is deferred for an additional cycle length - the so-called compensatory pause (Fig. 42). The total number of beats is unchanged. Fig. 42. The “Compensatory pause”. Premature Atrial and Junctional Contractions (PACs and PJCs) are commonly seen in patients who are otherwise well. They often are induced by the same stimuli that produce sinus tachycardia, especially caffeine or nicotine. However, in patients with congestive heart failure or chronic pulmonary disease, PACs or PJCs may progress to atrial fibrillation or flutter. Supraventricular foci characteristically produce a normal QRS-T pattern, since they excite the ventricles via the normal conduction system. Atrial beats are recognised by their initial P wave; depending on their site of origin within the atrial myocardium, this may be deformed (Fig. 43) or may precede the QRS complex by a longer or shorter interval than in the normal beats (Fig. 44). Fig. 43. Atrial ectopic beat with deformed P-wave.
- 34. 66 Fig. 44. Atrial ectopic beat with prolonged PR-interval (paper speed is 25 mm/sec). Because of its prematurity, an atrial ectopic impulse sometimes finds the A-V conducting system refractory and fails to excite a ventricular response (Fig. 45). Fig. 45. Atrial ectopic beat with functional AV-block. Another possibility is that only one or other bundle branch proves refractory, producing a functional bundle branch block - the atrial ectopic beat with “aberration” (Fig. 46). Only the premature occurrence of P distinguishes this from a ventricular focus. Fig. 46. Atrial ectopic beat with functional right bundle branch block. In beats of A-V nodal origin, P is either missing altogether, or appears, usually inverted, in close association with QRS due to retrograde atrial excitation (Fig. 47). Fig. 47. Junctional ectopic beat with retrograde P-wave. Another fundamental sign of supraventricular premature beat is that the compensatory pause is not complete, i.e. the interval between the preceding and following beat is less than twice the normal cycle length 67 (because an ectopic beat which causes atrial excitation discharges the impulse accumulating within the sino-atrial node). REMEMBER: Premature Atrial Contractions are reflected in the EGG by a premature morphologically abnormal P wave followed by a premature morphologically normal QRS complex. Premature Junctional contractions are reflected in the EGG by a retrograde P wave (negatively deflected in leads II, III, and aVF) that may follow, be hidden in, or precede a morphologically normal but premature QRS complex. Compensatory pause is not complete. PAROXYSMAL SUPRAVENTRICULAR TACHYCARDIA The term paroxysmal supraventricular tachycardia (PSVT) refers to a group of supraventricular arrhythmias that start and terminate abruptly and generally result from reentry. PSVT causes: 1. Atrioventricular nodal reentrant tachycardia (AVNRT). It is the most common cause of PSVT (accounting for two-thirds of all cases of PSVT). AVNRT occurs in the setting of two functionally distinct conduction pathways in the region of the AV node (called the fast and slow pathways). 2. Orthodromic AV reciprocating tachycardia (accessory pathway- mediated tachycardia). This type of tachycardia, accounting for approximately one-third of all cases of PSVT, results from the electrical impulse travelling from the atria to the ventricles via the AV node and returning to the atria via an accessory pathway that connects the atrium and ventricle. 3. Re-entrant or triggered atrial tachycardia. It accounts for less than 5% of all cases of PSVT. PSVT is defined as three or more consecutive PACs. The heart rate during episodes of PSVT may vary most commonly from 100 to 200 (240) beats/minute (Fig. 48). In general, PSVT involving an accessory pathway tends to be more rapid and PSVT caused by an atrial
- 35. 68 tachycardia tends to be slower. However, because of a tremendous amount of overlap, the rate of tachycardia is usually not helpful in establishing a diagnosis. Fig. 48. Paroxysmal atrial tachycardia with rate 168/minute (paper speed 25 mm/sec). There is a fixed relationship of the P wave to the QRS complex. If the impulse is generated in the AV node (as in AVNRT), the P wave may be buried in the QRS complex, but the process can be identified by the normal appearance of the QRS complex and the regularity of the rate. When the P wave is visible, it may follow the QRS complex (some nodal reentry rhythms, all accessory pathway reentry rhythms). It may also precede the QRS complex and may appear morphologically normal (atrial reentry or ectopic rhythm), in which case the diagnosis can be made (by EGG) only if the rate is high enough to make sinus tachycardia unlikely. The P wave also may be hidden in the T wave, but again, the regularity of the rate and the usually normal duration of the QRS complex establish the diagnosis. Multi-Focal Atrial Tachycardia (MFAT) is a chaotic supraventricular arrhythmia. It results from the presence of multiple, different atrial pacemaker foci. This rhythm disturbance is characterized by a tachycardia with beat-to-beat variation of the P wave morphology. QRS morphology is normal and every QRS complex is preceded by a P wave (Fig. 49). Fig. 49. Multifocal atrial tachycardia (note the variation in the morphology of the P-waves and the duration of the PR- intervals). 69 ATRIAL FIBRILLATION Atrial fibrillation is defined electrophysiologically as the generation of multiple reentry wave fronts by the atria. It is usually triggered by a PAC that triggers the development of these wave fronts and results in an atrial rate in excess of 300 beats/minute. These impulses enter the AV node randomly. Because of the unique conduction properties of the AV node, including slow conduction and decremental conduction, only a small proportion of the impulses are conducted to the ventricle. This results in a much slower and irregular ventricular rate. The prevalence of atrial fibrillation increases with age and the development of structural heart disease. When atrial fibrillation occurs in the absence of any evidence of structural heart disease in patients less than 50 years of age, it is called lone atrial fibrillation. In some patients, factors that trigger episodes of atrial fibrillation can be identified such as physical or emotional stress, alcohol, nicotine, or caffeine. Soaking in a hot tub while imbibing alcoholic beverages has become a recognized precipitating cause of atrial fibrillation. The major noncardiac illness associated with atrial fibrillation is hyperthyroidism; in the presence of a fast ventricular response refractory to digitalis, atrial fibrillation may be the first clue to the diagnosis. The incidence of atrial fibrillation increases greatly with age, and often appears shortly after the onset of symptomatic coronary heart disease. Hypertensive and rheumatic heart disease (especially when it involves the mitral valve) also predispose to the development of atrial fibrillation, but almost every kind of myocardial disorder has been associated with it. Also, the tachyarrhythmic component of the sick sinus syndrome may be atrial fibrillation. The EGG shows rapid irregular fibrillatory atrial activity at rates of 300 to 500/minute. No coordinated atrial excitation is possible, and in leads favourable to atrial activity P waves are replaced by a rapid irregular series of oscillation known as f-waves (Fig. 50, leadsV1-2); in other leads no atrial deflections can be distinguished (Fig. 50, lead V6).
- 36. 70 Fig. 50. Atrial fibrillation, ventricular response 60/minute (paper speed 25 mm/sec), note f-waves in V1-2; no P waves are present. Ventricular response to this bombardment is partial and irregular, being limited by the capacity of the AV conducting system. In cases uncontrolled by digitalis, it may be as high, as 200 /minute (Fig. 51). Fig. 51. Uncontrolled atrial fibrillation, ventricular response 190/minute (paper speed 25 mm/sec). Thus, the ventricular rhythm is irregularly irregular, at rates that at onset are usually 150 to 200/minute, unless there is a coexistent disease in the AV node, in which case slower rates are possible (Fig. 50). Depending on the number of ventricular complexes the following 3 forms of cardiac fibrillation are distinguished: - bradycardiac (less than 60 per minute), - normocardiac (60-90 (100) per minute), - tachycardiac (more than 90 (100) per minute). 71 The QRS complex is usually morphologically normal. Occasionally there is an aberrant conduction of an impulse in the ventricles, after a beat that has been preceded by a long pause. The aberrant beat usually has a right bundle branch block (RBBB) configuration. This so-called Ashman phenomenon is caused by prolonged refractoriness of the (usually) right bundle branch after the long pause (Fig. 51). These aberrant beats must be distinguished from ventricular premature beats. Apart from their typical relationship to a preceding long R-R interval, aberrant beats are often triphasic (RSR') in lead V1 and their initial vector is the same as that of the normally conducted beats; there is no compensatory pause after aberrant beat. Neither of these features is characteristic of ventricular premature beats. Fig. 51. Ashman phenomenon. In some cases atrial fibrillation is associated with AV complete heart block, then the ventricles function rhythmically and rarely (Fig. 52), while fibrillation concerns only the atria. This syndrome was described by Fredericke and is named after him. Fig. 51. Fredericke syndrome ATRIAL FLUTTER Atrial flutter is a reentrant arrhythmia that is confined to the right atrium and results in an atrial rate of about 300 beats/minute. Usually there is a 2:1 AV conduction block so that the ventricular response is about 150/minute, and unlike atrial fibrillation, both atrial and ventricular responses are regular. Atrial flutter is almost always seen in