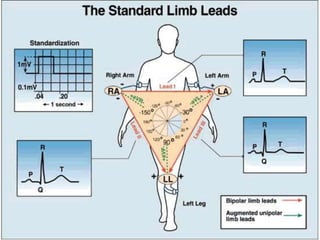
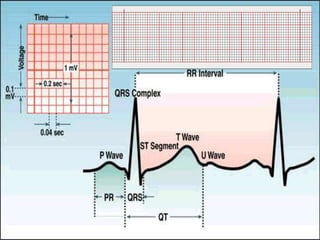
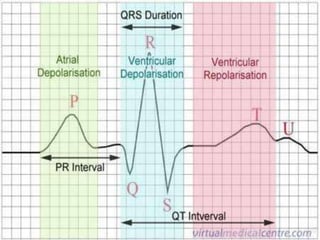
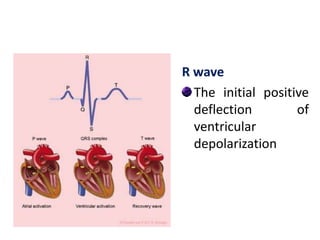
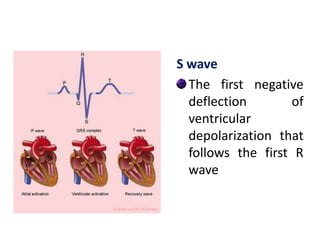
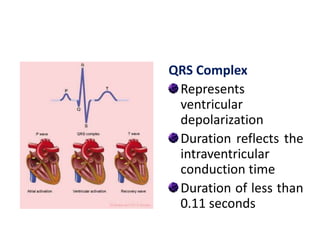
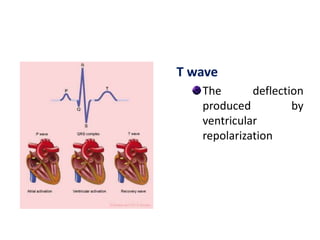
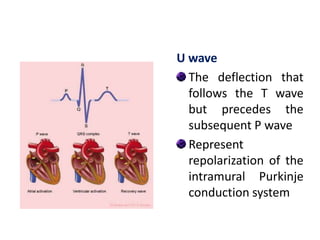
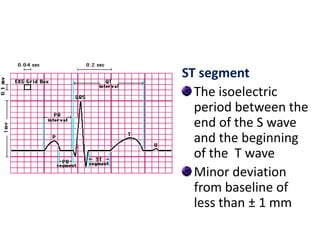
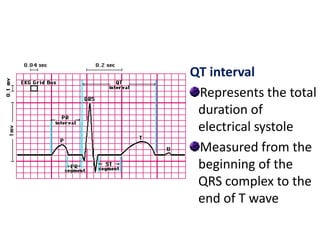
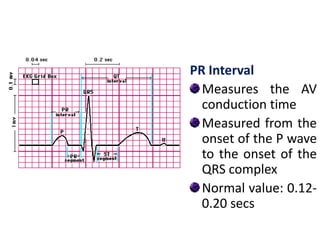
ECG
Introduction
The electrocardiogram (ECG or EKG) is a
diagnostic tool that measures and records the
electrical activity of the heart
ECG Leads
There are 12 conventional leads
Limb leads or extremity leads : 6
Chest leads or precordial leads: 6
Limb leads
Electrodes are placed on the three limbs
namely right arm, left arm, left leg. Right leg
electrode is the grounding electrode
There are
Standard limb leads: 3
Augmented limb leads : 3
Standard limb leads
Measures electrical activity between two limbs
Lead
LeadLead
Augmented limb leads
Measures the electrical activity from one limb at
a time. Also called unipolar leads
Chest leads
• Electrodes are placed on the precordium.
• There are 6 chest leads namely V1, V2, V3, V4 V5,
V6
DIFFERENT VIEW
•Inferior leads, ( II, III and aVF) Inferior part of the heart.
•Lateral leads, (I, aVL, V5 and V6) lateral wall of left
ventricle.
•Septal leads, (V1 and V2) septal wall of the left ventricle.
They are often grouped together with the anterior leads.
•Anterior leads, (V1, V2, V3 and V4) anterior wall of the
left ventricle.
•Lead aVR offers no specific view of the left ventricle.
Rather, it views the endocardial wall from its perspective on
the right shoulder.
ECG Graph paper
• The output of an ECG recorder is a graph with
time represented on the x-axis and voltage
represented on the y-axis.
Time is measured from the L to the R —
one large box = 0.20 sec and one small one = 0.04 sec.
Voltage or current strength is determined from the
magnitude or height of the various waveforms and is
measured in mV or mm
one small box normally = 0.1 Mv or 1 mm
one large box = 0.5 mV or 5 mm.
Components of electrocardiogram
• ECG consists of:-
1. Waves/complexes: deflections that can be positive
/negative or both.
Waves: P,Q,R,S,T
Complex: QRS
2. Segments: period of time between a wave or complex
and other wave or complex
Eg: S-T
3. Interval: period of time between two points on the ECG
Eg: P-R,R-R
ECG WAVEFORMS
P wave
Represents atrial
depolarization
A measure of the
time required for
depolarization to
spread through the
atria
Normal duration:
less than 0.12 secs
Q wave
The initial negative
deflection of
ventricular
depolarization
R wave
The initial positive
deflection of
ventricular
depolarization
S wave
The first negative
deflection of
ventricular
depolarization that
follows the first R
wave
QRS Complex
Represents
ventricular
depolarization
Duration reflects the
intraventricular
conduction time
Duration of less than
0.11 seconds
T wave
The deflection
produced by
ventricular
repolarization
U wave
The deflection that
follows the T wave
but precedes the
subsequent P wave
Represent
repolarization of the
intramural Purkinje
conduction system
ST segment
The isoelectric
period between the
end of the S wave
and the beginning
of the T wave
Minor deviation
from baseline of
less than ± 1 mm
QT interval
Represents the total
duration of
electrical systole
Measured from the
beginning of the
QRS complex to the
end of T wave
PR Interval
Measures the AV
conduction time
Measured from the
onset of the P wave
to the onset of the
QRS complex
Normal value: 0.12-
0.20 secs
RR Interval
The distance
between the two
consecutive R
waves
PP Interval
The distance between
two consecutive P
waves
Normally should be
the same as the RR
interval unless certain
arrhythmias or AV
block are present
Approach to Reading the ECG
1. Rate
2. Rhythm
3. P wave: morphology and duration
4. PR interval
5. QRS complex: morphology and duration
6. ST segment
7. T wave
8. U wave
9. QT interval
Estimation of Heart Rate
Heart Rate No. of large boxes
between RR intervals
300 1
150 2
100 3
75 4
60 5
50 6
43 7

Ecg

  • 1.
  • 2.
    Introduction The electrocardiogram (ECGor EKG) is a diagnostic tool that measures and records the electrical activity of the heart
  • 3.
    ECG Leads There are12 conventional leads Limb leads or extremity leads : 6 Chest leads or precordial leads: 6
  • 4.
    Limb leads Electrodes areplaced on the three limbs namely right arm, left arm, left leg. Right leg electrode is the grounding electrode There are Standard limb leads: 3 Augmented limb leads : 3
  • 5.
    Standard limb leads Measureselectrical activity between two limbs Lead LeadLead
  • 6.
    Augmented limb leads Measuresthe electrical activity from one limb at a time. Also called unipolar leads
  • 8.
    Chest leads • Electrodesare placed on the precordium. • There are 6 chest leads namely V1, V2, V3, V4 V5, V6
  • 11.
    DIFFERENT VIEW •Inferior leads,( II, III and aVF) Inferior part of the heart. •Lateral leads, (I, aVL, V5 and V6) lateral wall of left ventricle. •Septal leads, (V1 and V2) septal wall of the left ventricle. They are often grouped together with the anterior leads. •Anterior leads, (V1, V2, V3 and V4) anterior wall of the left ventricle. •Lead aVR offers no specific view of the left ventricle. Rather, it views the endocardial wall from its perspective on the right shoulder.
  • 12.
    ECG Graph paper •The output of an ECG recorder is a graph with time represented on the x-axis and voltage represented on the y-axis.
  • 14.
    Time is measuredfrom the L to the R — one large box = 0.20 sec and one small one = 0.04 sec. Voltage or current strength is determined from the magnitude or height of the various waveforms and is measured in mV or mm one small box normally = 0.1 Mv or 1 mm one large box = 0.5 mV or 5 mm.
  • 15.
    Components of electrocardiogram •ECG consists of:- 1. Waves/complexes: deflections that can be positive /negative or both. Waves: P,Q,R,S,T Complex: QRS 2. Segments: period of time between a wave or complex and other wave or complex Eg: S-T 3. Interval: period of time between two points on the ECG Eg: P-R,R-R
  • 18.
    ECG WAVEFORMS P wave Representsatrial depolarization A measure of the time required for depolarization to spread through the atria Normal duration: less than 0.12 secs
  • 19.
    Q wave The initialnegative deflection of ventricular depolarization
  • 20.
    R wave The initialpositive deflection of ventricular depolarization
  • 21.
    S wave The firstnegative deflection of ventricular depolarization that follows the first R wave
  • 22.
    QRS Complex Represents ventricular depolarization Duration reflectsthe intraventricular conduction time Duration of less than 0.11 seconds
  • 23.
    T wave The deflection producedby ventricular repolarization
  • 24.
    U wave The deflectionthat follows the T wave but precedes the subsequent P wave Represent repolarization of the intramural Purkinje conduction system
  • 25.
    ST segment The isoelectric periodbetween the end of the S wave and the beginning of the T wave Minor deviation from baseline of less than ± 1 mm
  • 26.
    QT interval Represents thetotal duration of electrical systole Measured from the beginning of the QRS complex to the end of T wave
  • 27.
    PR Interval Measures theAV conduction time Measured from the onset of the P wave to the onset of the QRS complex Normal value: 0.12- 0.20 secs
  • 28.
    RR Interval The distance betweenthe two consecutive R waves
  • 29.
    PP Interval The distancebetween two consecutive P waves Normally should be the same as the RR interval unless certain arrhythmias or AV block are present
  • 30.
    Approach to Readingthe ECG 1. Rate 2. Rhythm 3. P wave: morphology and duration 4. PR interval 5. QRS complex: morphology and duration 6. ST segment 7. T wave 8. U wave 9. QT interval
  • 31.
  • 32.
    Estimation of HeartRate Heart Rate No. of large boxes between RR intervals 300 1 150 2 100 3 75 4 60 5 50 6 43 7