Downloaded 2,006 times
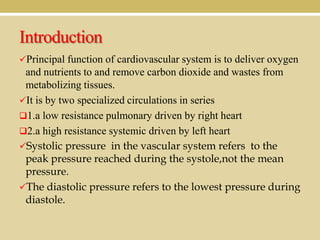
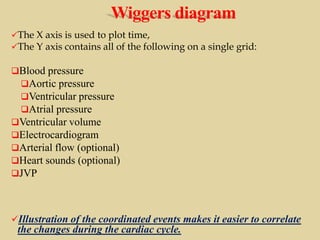
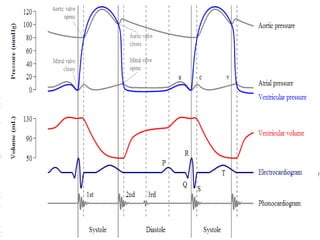
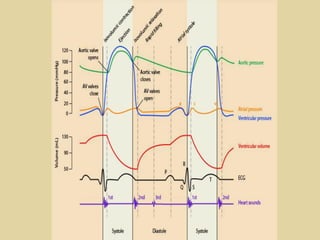
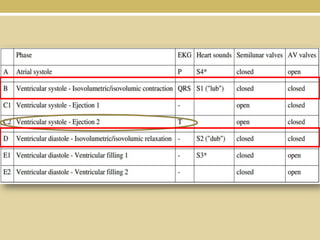
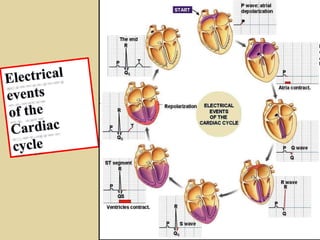
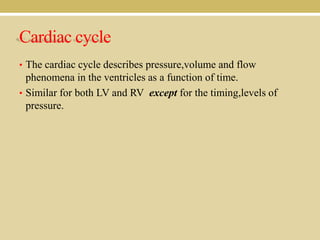
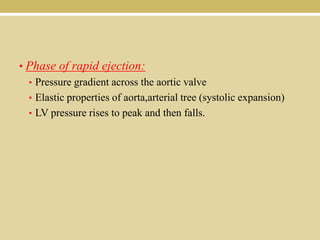
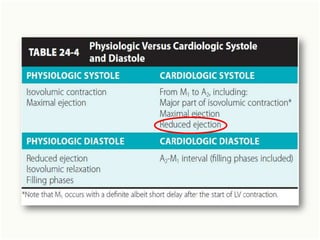
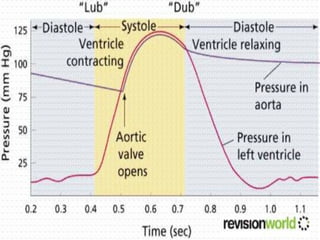
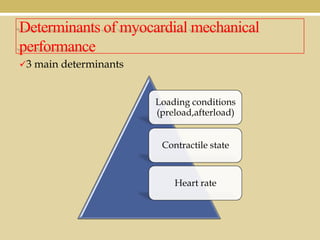
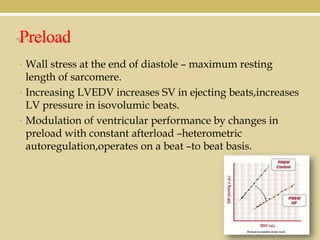

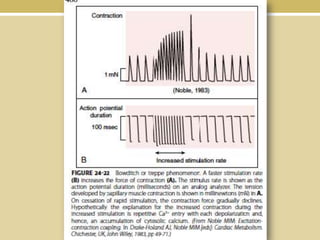
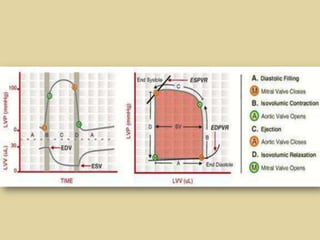
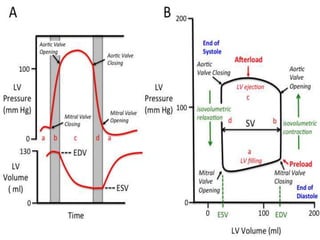
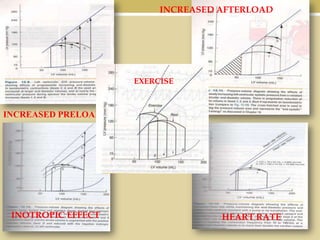
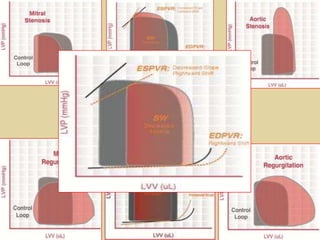
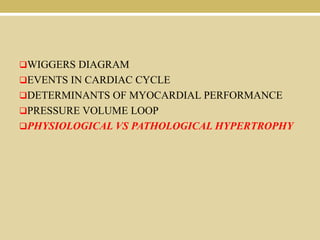
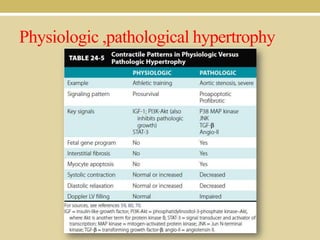
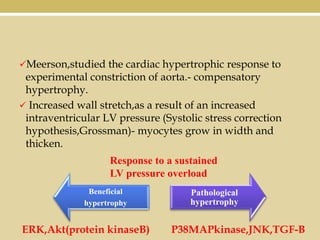
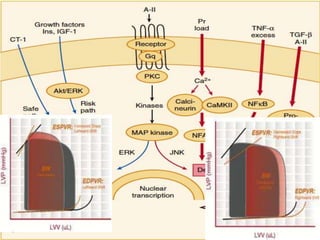
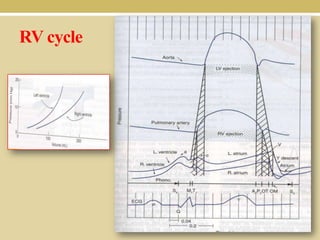
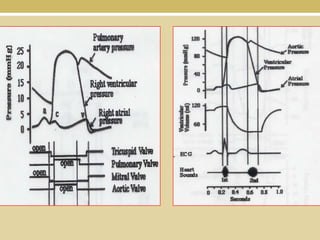


This document discusses cardiovascular physiology, beginning with an overview of the cardiac cycle and events in the cycle. It then covers determinants of myocardial performance including preload, afterload, contractility, and heart rate. Pressure-volume loops are introduced as a way to assess ventricular function. Physiological and pathological hypertrophy are compared. Key aspects covered include the Wiggers diagram, Frank-Starling mechanism, Anrep effect, Bowditch phenomenon, and formulas for calculating cardiac values.


