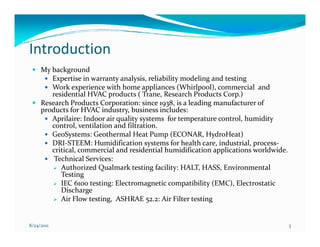
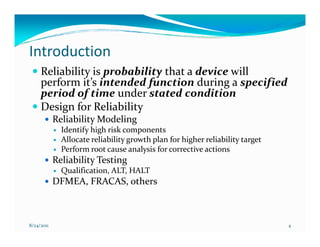
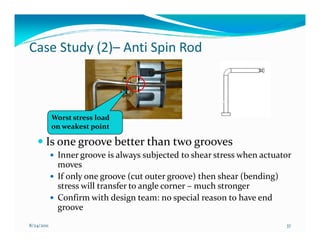
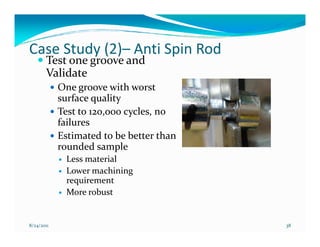
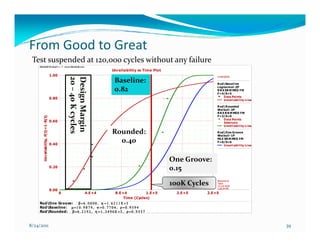
Effective Reliability 
                   Effective Reliability
                     Testing to Drive 
                     Testing to Drive
                       g     p
                  Design Improvement
                                Keyanna Qi
                             ©2011 ASQ & Presentation Qi
                            Presented live on Dec 08th, 2011


http://reliabilitycalendar.org/The_Re
liability_Calendar/Webinars_
liability Calendar/Webinars ‐
_English/Webinars_‐_English.html
ASQ Reliability Division 
                 ASQ Reliability Division
                 English Webinar Series
                 English Webinar Series
                  One of the monthly webinars 
                  One of the monthly webinars
                    on topics of interest to 
                      reliability engineers.
                    To view recorded webinar (available to ASQ Reliability 
                        Division members only) visit asq.org/reliability
                                             )              /

                     To sign up for the free and available to anyone live 
                    webinars visit reliabilitycalendar.org and select English 
                    Webinars to find links to register for upcoming events


http://reliabilitycalendar.org/The_Re
liability_Calendar/Webinars_
liability Calendar/Webinars ‐
_English/Webinars_‐_English.html
Keyanna Qi
Sr. Reliability and Test Engineer
Research Products Corporation
Agenda
     Introduction
     What and Why Reliability Testing
     Effective Test Plan Development
            Process Map
            Case Studies
     Summary
     Questions?


8/24/2011                               2
Introduction
     My background
        Expertise in warranty analysis, reliability modeling and testing
        Work experience with home appliances (Whirlpool), commercial and
        residential HVAC products ( Trane, Research Products Corp.)
     Research Products Corporation: since 1938, is a leading manufacturer of
     products for HVAC industry, business includes:
        Aprilaire: Indoor air quality systems for temperature control, humidity
        control, ventilation and filtration.
        GeoSystems: Geothermal Heat Pump (ECONAR, HydroHeat)
        DRI-STEEM: Humidification systems for health care, industrial, process-
        critical, commercial and residential humidification applications worldwide.
         Technical Services:
           Authorized Qualmark testing facility: HALT, HASS, Environmental
           Testing
           IEC 6100 testing: Electromagnetic compatibility (EMC), Electrostatic
           Discharge
           Air Flow testing, ASHRAE 52.2: Air Filter testing


8/24/2011                                                                             3
Introduction
     Reliability is probability that a device will
     perform it’s intended function during a specified
     period of time under stated condition
     Design for Reliability
            Reliability Modeling
              Identify high risk components
              Allocate reliability growth plan for higher reliability target
              Perform root cause analysis for corrective actions
            Reliability Testing
              Qualification, ALT, HALT
            DFMEA, FRACAS, others


8/24/2011                                                                      4
Reliability Test – Qualification
     Qualification Test
            Verify if new design/components meet design
            specification – function and operation
            condition, agency specification – UL or others
              Functional test under expected operating
              conditions specified in company engineering
              standard or design specification
              Comply with industry standard / regulation
            Not intended to fail, not test to failure (TTF)

8/24/2011                                                     5
Reliability Test – ALT
      Accelerated Life Testing
            Verify if the new design/components meet
            design life expectation
             Operational Cycling: on/off
             Continuous operating under specified conditions
             Elevated environmental stress
                 Thermal cycling / thermal shock
                 Corrosion resistance test
                 Vibration
            Test to failure
              Simulate field failure
              Compare different designs/suppliers
              Allow life prediction
8/24/2011                                                      6
Reliability Test – ALT
     Smaller sample size (4 – 16) depend on stress level
     Pair test: test with baseline part
            Current production samples
            Different suppliers
            Different Design
     Stress Levels to simulate real failure mode
            Understand failure mechanisms
            Operating condition and material limit
            Worse case scenarios
     What “Test to Failure” Results Reveal
            Same failure modes as seen in field
              Operation margin
              Root cause of failures
            Optimize design parameters


8/24/2011                                                  7
Reliability Test – HALT
      HALT (Highly Accelerated Life Testing)
        Identify weak links for new design or
        comparison test
            Temperature limits
            Vibration limits
            Thermal Shock
            Combined Thermal Shock and Vibration
        Compare different design or supplier quality
            Design margin
            Operating limit


8/24/2011                                              8
Testing Standards
     Industry Standards
            ANSI/AMCA (American National Standards Institute / The
            Air Movement & Control Association International Inc)
              ANSI/AMCA-204: Operation Vibration (fan motor)
            ASTM (American Society for Testing and Materials)
              B117: Salt Spray
            NEMA (National Electrical Manufacturing)
              NEMA MG-1: Motor
              NEMA 4: enclosures
            UL 1995: Heating and Cooling Equipment
     Company Engineering Standards or
     Specifications
            ES (Engineering Standard)
            Design Specification

8/24/2011                                                            9
Reliability Testing
     No industry standards available
     No specifications in design documents
     No testing procedures to follow
     Varied from part to part, from application to
     application
            Each test requires unique method
            Difficulties to simulate field failure in lab
            Even harder if complete new design or application


8/24/2011                                                       10
Test Plan Development Process
      Identify (I) failure modes and failure mechanisms
            Understand history – warranty performance and field feedback
            Evaluate/verify under conditions for seeable misuse, not just anticipated use
            condition
            Failure modes: list all well known and unknown
      Design (D) test method and test matrix
            Develop test methods for critical failure modes
            Determine failure detection, failure criteria, DOE
      Optimize (O) test method and testing parameter
            Run pilot tests to find out most reasonable setup
            Time and cost effective
      Validate (V) test method and failure modes
            Validate test method
            Verify testing part meet design specification – functionality and life
8/24/2011                                                                              11
Six Sigma Methodology: IDOV
      Road Map


            Success: replicate field failure and eliminate it
8/24/2011                                                       12
Test Plan Contents
     Functions of part
            Design limit: max. temperature, pressure, current,
            torque
            Operational load – mechanical, electrical, thermal
            Input / output signals – wiring diagram
     Operating condition
            Normal use condition
            Customer misuse
            Material properties
     Failure modes
            What, Where and How
            Root Cause Analysis (RCA) – true reason of failures

8/24/2011                                                         13
Test Plan Contents
     Testing Methods
            Follow industrial standard if possible: UL, ASTM,
            ASHRAE
            Apply correct load (stress) – thermal, mechanical,
            cycling, etc
            Set appropriate stress level to simulate real application
            condition
            ALT, HALT, functional check under certain conditions
     Failure criteria
            Define “Failure” for lab test setup and monitoring
            Testing Duration – how long going to test
     Failure detection

8/24/2011                                                               14
Subject Matter Experts Input
     Design Engineers have best knowledge of design functions
     (design specs)
     Product Engineers know customer requirement and
     operating conditions (operation mapping)
     Quality / Manufacturing Engineers know how it fails
     during production (failure mode, weak links, installation
     issue)
     Service Engineers know more customer complaints (failure
     mode)
     Material Engineers to help on failure mechanisms
     Agency Experts: like UL and material test
     Reliability Engineers to complete the puzzle: collect all
     inputs from different teams, develop test plan for reliability
     testing
     Lab Test Engineers and Technicians to make it happen

                     Teamwork is Essential!
8/24/2011                                                             15
Case Study (1) Door Handle Improvement
     Functions
            Provide service access into /           Identify
            out of unit for service
              Unit size from 3ftx3ft to 10ftx12ft
            Keep door closed while unit
            operating                                Design
     Background Information
            Failure mode: broken handle
            High failure rate but low
            warranty cost                           Optimize
     Possible Causes
            Impact load from shipping
            and handling                            Validate
            Misuse – use as ladder or
            grasp as moving handle
            Others

8/24/2011                                                16
Case Study (1) Door Handle Improvement
   Handle Broken by Impact Load
       Moving unit by fork truck or crane, collision            Identify
       happens, hit handle:
             Split Unit Weight Range: 2500 ~ 8000lb
             Moving Velocity: 1.6 ft/s (1 mile/h, 0.5 m/s)
             Impact Force range will be from 2000lb to 6400lb    Design
       Handles, guarding, and any protrusion may
       fail when encounter such huge impact force
                                                                Optimize
            Force = (W*V)/time
            Assume: Collision in 2s
                                                                Validate

                  Impact
                  Test
8/24/2011                                                            17
Case Study (1) Door Handle Improvement
     Impact Test                                  Identify
            Drop part to concrete floor
            Swing a ball to hit
                                                  Design
            Shoot a solid block
            Free drop solid block to hit handle
     How to measure impact load?                  Optimize
            Weight
            Hit velocity
                                                  Validate
            Hit time
            Height

8/24/2011                                              18
Case Study (1) Door Handle Improvement
      Optimize
            Free drop cylinder start from 1 food        Identify
             Measure drop height
      Validate                                           Design
            Run pilot test to confirm it will produce
            same failure mode
                                                        Optimize
      Other Tests
            Shear test: use handle as ladder
            Pull test: use handle as moving tool        Validate

            Operating rotation test not conducted
            because no prototype unit available
8/24/2011                                                     19
Door Handle Qualification Test
     Impact Test                                         New HDL: 2 feet,
            Apply impact load to center point of         no failure
                                                         Old: HDL: broken at 1
            handle                                       foot drop
            Drop throw a 10lbs cylinder, drop
            distance from 1 ft, increase drop
            distance until handle breaks
                                                       New HDL: base crew
     Shear Test                                        bend or pull out
                                                       Old: HDL: passed 250lb
            Apply 250 lb load on top of handle for 3
            minutes, repeat loading 3 times at 10
            minutes interval
            Inspect any damages in handle assembly
     Strap Test                                        New HDL: Not broke
                                                       until 500lb, but base
            Apply shipping strap load to end of        crew bend or pull out
            handle for 1 minutes, increase load from   Old: HDL: Broke @ 200lb
            300lbs until break handle

8/24/2011                                                                  20
Design Change on New Handle
     Increase base screw size and add hardened
     washer
            Re-test
            Success to fix old failure mode
     Approval for new product application
     Reliability model was updated, claimed to have
     70% improvement
     However, 3 months later in prototype units…..


8/24/2011                                             21
New Failure Mode
  Cam Roller Loosens
                                                                  Identify
    Noticed loosening handle at
    production floor
    Partially lost function, would
    not close door properly                                        Design
                                     Cam Roller
  Potential Causes                   loosening gap
    Torque specification             between cam
                                     roller and striker           Optimize
    Insert material hardness
    Bolt material

                                                                  Validate


             22                                       8/24/2011
Actions to Fix New Failure Mode (IDOV)
    P-Diagram to identify desired functions,           Identify
    noise factors, design control factors, error
    modes
                                                        Design
    Boundary Diagram to evaluate
    interferences
    FMEA                                               Optimize

            Put any potential failure modes into
            consideration
                                                       Validate
            Potential causes
              Design, material, assembly process
            Recommendations on Detection and Control
8/24/2011                                                   23
Test Plan for Improvement
     Identify failure modes           Insert Type   Washer   Cam Torque   Identify
            Cam Roller loosening       Current        1         Low
                                       Current        2         High
            Difficult to rotate        Current        1         Low
            Base screw loosening       Current        2         High
                                                                          Design
     Testing parameters                 Harder        1         High
                                        Harder        2         High
            Add 1 or 2 washers to       Harder        1         Low
            cam bolt                    Harder        2         Low
            Increase hardness of      No Insert       2         Low
                                                                          Optimize
            insert plate              No Insert       1         Low

            Find proper bolt Torque   No Insert       1         High
                                      No Insert       2         High
                                                                          Validate


8/24/2011                                                                      24
Test Setup
            Mount door handles on      Identify
            door panel
            How to Rotate Handles?
              Manual operation?         Design
              PLC control operation?
              Electrical drill?
              Other automaton?         Optimize

            Rotate handle 360 degree
            through striker by a       Validate
            electrical drill


8/24/2011                                   25
Test Result
      Old handle exhibited same failure mode    Identify
      at about 50 cycles operation
      Samples with one washer added meet
                                                 Design
      life cycle requirement
      Harder insert samples showed best
      result in terms of tightness and insert   Optimize
      plate damage
      No insert sample also demonstrated
      improvement on the tightness              Validate
            Cost benefit
            Easy to assembly


8/24/2011                                            26
Whole Plastic Handle
    • Impact Test                                                              Identify
            Apply impact load to the center point of the handle
            (drop throw a metal ball or other objects), using a
            10lbs object, drop distance from 1 ft, increase the drop
                                                                                Design
            distance until the handle breaks:


                                                                               Optimize


                                                                               Validate
            Current HDL after 4 ft drops   Whole Plastic HDL after 1 ft drop


8/24/2011                                                                           27
Corrective Actions based on Test Results
     Generic Corrective actions for improvement:
            Material change: material used did not meet design
            specification
            Manufacturing assembly change: part variation or
            manufacturing defect cause infant failures
            Design change: design concept change
     Door Handle
            Use harder insert material and torque tolerance limit was
            specified
            Apply hardened washers on both sides of insert plate
            Handle without insert material showed similar performance
            in terms of rotation cycling, but failed impact test and pull
            test, it is not recommended


8/24/2011                                                                   28
Handles in HVAC Unit
            This door handle becomes one of new features that our
            customers enjoy most

              High perceived quality
              Easy to rotate
              Very robust


8/24/2011                                                           29
Lessons Learned
      Focus well known failure modes, but never overlook
      unknown failure modes
            New design may introduce new failure modes while removing
            well known failure modes
            Use reliability engineering tools to identify potential failure
            modes before start test planning
      Do not skip steps, if not possible to do it, find alternative
      way


8/24/2011                                                                     30
Case Study (2) – Anti Spin Rod
     Anti-Spin Rod field failures
                                                                          Identify
            Fatigue at inner groove
            Design life: 30,000 cycles
                                                              Broken
                                                                           Design


                                         Mount plate
                                                                          Optimize
                                         Screw

                                     Actuator
                                                                          Validate
                                  Bracket

                                                       Fracture Surface

8/24/2011                                                                      31
Case Study (2) – Anti Spin Rod
      Current Design and Machining Quality
            Very rough groove surface                    Identify
            Sharp groove edge - no radius
            Some samples had less 90 degree bend angle
                                                          Design


                                                         Optimize


      ALT Samples
        Baseline: current production samples (bend,      Validate
        rough surface)
        Improved surface with radius

8/24/2011                                                     32
Case Study (2) – Anti-Spin Rod
     Test Fixture Design
                                                         Identify
            How to apply stress – air cylinder, weight
            blocks, actual damper?
            How to measure load?                          Design
     Optimize
            Not apply torque load to actuator, achieve   Optimize
            desired load by using fixed Jackshaft
            Simple
            but effective                                Validate


8/24/2011                                                     33
Case Study (2) – Anti-Spin Rod
     Validate
                                                   Identify
            Measure actuator torque which is
            same as part specified
            Be able to duplicate field failure –    Design
            fatigue at inner groove

                                                   Optimize


                                                   Validate


8/24/2011                                               34
Case Study (2) – Anti Spin Rod
     Test Results
            ReliaSoft W eibull++ 7 - www.ReliaSoft.com
                                                                                         Unreliability vs Time Plot
                                              1.000
                                                                                                                                             U nreliability
                                                              20 – 40 K cycles
                                                              Design Margin
                                                              Design Margin              Baseline:                                           Rod Baseline
                                                                                                                                             Lognormal-2P
                                                                                                                                             RRX SRM MED FM

                                                                                         82% FR                                              F=4/ S=5
                                                                                                                                                   Data Points
                                                                   40 K cycles

                                                                                                                                                   U nreliability Line
                                              0.800
                                                                                                                                             Rod Rounded
                                                                                                                                             W eibull-2P
                                                                                                                                             RRX RRM MED FM
                                                                                                                                             F=3/ S=0
                                                                                                                                                   Data Points
                                                                                                                                                   I ntervals
                                                                                                                                                   U nreliability Line

                                              0.600
                                                                                                                       Improved:
                Unreliability, F(t)=1-R(t )


                                                                                                                        40% FR
                                              0.400


                                              0.200

                                                                                                                       100K Cycles
                                                                                                                                             Keyanna Qi
                                                                                                                                             Trane
                                                                                                                                             11/ 22/ 2010
                                              0.000                                                                                          12:39:15 PM
                                                      0                          4.E+4   8.E+4                 1.E+5      2.E+5      2.E+5

                                                                                                 Time (Cycles)
            Rod Baseline:                            µ=10.9874, σ=0.7704, ρ=0.9594
            Rod Rounded:                              β=6.2192, η=1.3496Ε+5, ρ=0.9557


8/24/2011                                                                                                                                                                35
Case Study (2)– Anti Spin Rod
    Observe a lot from just watching
            Failure rate of the improved samples were 50% less than the
            baseline @ 100,000 cycles
            Rounded sample show no failures within design margin,
            failed part still works
            Good to go……but, can be better?

                                      Broke rod still functional


8/24/2011                                                                 36
Case Study (2)– Anti Spin Rod


            Worst stress load
            on weakest point

       Is one groove better than two grooves
             Inner groove is always subjected to shear stress when actuator
             moves
             If only one groove (cut outer groove) then shear (bending)
             stress will transfer to angle corner – much stronger
             Confirm with design team: no special reason to have end
             groove
8/24/2011                                                                37
Case Study (2)– Anti Spin Rod
       Test one groove and
       Validate
            One groove with worst
            surface quality
            Test to 120,000 cycles, no
            failures
            Estimated to be better than
            rounded sample
             Less material
             Lower machining
             requirement
             More robust


8/24/2011                                 38
From Good to Great
 Test suspended at 120,000 cycles without any failure
     ReliaSoft W eibull++ 7 - www.ReliaSoft.com
                                                                      Unreliabilit y vs Time Plot
                                     1.00                                                                         U nreliability
                                                20 – 40 K cycles
                                                Design Margin
                                                Design Margin          Baseline:                                  R odBas el i ne

                                                                       0.82                                       Lognorm al -2P
                                                                                                                  R R X SR M MED FM
                                                                                                                  F=4/S=5
                                                     40 K cycles


                                                                                                                       D ata Poi nts
                                     0.80                                                                              U nrel i abi l i ty Li ne

                                                                                                                  R odR ounded
                                                                                                                  Wei bul l -2P
                                                                                                                  R R X R R M MED FM
                                                                                                                  F=3/S=0
        Unreliability, F(t)=1-R(t)


                                                                                                                       D ata Poi nts
                                     0.60                                                                              Interval s
                                                                                                                       U nrel i abi l i ty Li ne

                                                                      Rounded:                                    R odOne Groove
                                                                                                                  Wei bul l -1P


                                     0.40
                                                                        0.40                                      MLE SR M MED FM
                                                                                                                  F=0/S=6
                                                                                                                      U nrel i abi l i ty Li ne


                                                                                                    One Groove:
                                     0.20
                                                                                                    0.15

                                                                                                    100K Cycles   Keyanna Qi
                                                                                                                  Trane
                                                                                                                  11/ 23/ 2010
                                                                                                                  3:38:34 PM
                                     0.00
                                            0                 4.E+4    8.E+4           1.E+5          2.E+5   2.E+5
                                                                           Time (Cycle s)
     RodO ne Groove : β = 6 . 0 0 0 0 , η = 1 . 6 2 1 1 Ε + 5
     RodBase line : µ = 1 0 . 9 8 7 4 , σ = 0 . 7 7 0 4 , ρ = 0 . 9 5 9 4
     RodRounde d: β = 6 . 2 1 9 2 , η = 1 . 3 4 9 6 Ε + 5 , ρ = 0 . 9 5 5 7


8/24/2011                                                                                                                                          39
Lessons Learned
     Make it from Good to Great
            Understand functions of components and design
            requirement
            Understand limit of manufacturing process
            Take one more step to make design more robust and cost
            effective
              Lower machining tolerance requirement
              Reduce material use
     As reliability and testing engineer, we are able to
     help more than what others thought
            New perspective to ask more questions

8/24/2011                                                        40
Never Skip System Validation
     Component passed qualification test alone, does
     not mean it works in the subsystem or system
     Validation tests to verify if the new component
     meets design specification and life expectation at
     system level
     System Validation Tests
            System / Subsystem Integration
              Follow normal installation process
              Subject to operating condition or accelerated stress level of operating
              conditions
            Meet life exception or confirm the old failure modes were
            removed

8/24/2011                                                                               41
Summary
     Reliability Engineer is not particular component expert (valve,
     sensor, electrical controls, or system design), but be able to
     collect information and collaborate with various engineering
     groups to develop comprehensive reliability test plans
     Reliability test plan development follows process of Identify –
     Design – Optimize – Validate
            Do not overlook any potential failure modes, especially unknown
            failure modes
            Apply DOE for design change optimization
            Always run validation test for final approval
     Put enthusiasm into your work to drive it from Good to Great


8/24/2011                                                                     42
Where to Get More Information
     Annual Book of ASTM Standards
            Materials, instrumentation evaluation or testing
     ASHRAE Handbook
            HVAC equipments and components
     MG 1-2006 by National Electrical Manufactures
     Association
            Motor testing
     Military Handbook: Reliability Prediction of Electronic
     Equipment (MIL-HDBD-217F)
       Consult with subject experts in your organization
             They know more than you thought
8/24/2011                                                      43
Questions


            Thank you for your attention.

            Do you have any questions?


8/24/2011                                   44

Effective reliability testing to drive design improvement

  • 1.
    Effective Reliability  Effective Reliability Testing to Drive  Testing to Drive g p Design Improvement Keyanna Qi ©2011 ASQ & Presentation Qi Presented live on Dec 08th, 2011 http://reliabilitycalendar.org/The_Re liability_Calendar/Webinars_ liability Calendar/Webinars ‐ _English/Webinars_‐_English.html
  • 2.
    ASQ Reliability Division  ASQ Reliability Division English Webinar Series English Webinar Series One of the monthly webinars  One of the monthly webinars on topics of interest to  reliability engineers. To view recorded webinar (available to ASQ Reliability  Division members only) visit asq.org/reliability ) / To sign up for the free and available to anyone live  webinars visit reliabilitycalendar.org and select English  Webinars to find links to register for upcoming events http://reliabilitycalendar.org/The_Re liability_Calendar/Webinars_ liability Calendar/Webinars ‐ _English/Webinars_‐_English.html
  • 3.
    Keyanna Qi Sr. Reliabilityand Test Engineer Research Products Corporation
  • 4.
    Agenda Introduction What and Why Reliability Testing Effective Test Plan Development Process Map Case Studies Summary Questions? 8/24/2011 2
  • 5.
    Introduction My background Expertise in warranty analysis, reliability modeling and testing Work experience with home appliances (Whirlpool), commercial and residential HVAC products ( Trane, Research Products Corp.) Research Products Corporation: since 1938, is a leading manufacturer of products for HVAC industry, business includes: Aprilaire: Indoor air quality systems for temperature control, humidity control, ventilation and filtration. GeoSystems: Geothermal Heat Pump (ECONAR, HydroHeat) DRI-STEEM: Humidification systems for health care, industrial, process- critical, commercial and residential humidification applications worldwide. Technical Services: Authorized Qualmark testing facility: HALT, HASS, Environmental Testing IEC 6100 testing: Electromagnetic compatibility (EMC), Electrostatic Discharge Air Flow testing, ASHRAE 52.2: Air Filter testing 8/24/2011 3
  • 6.
    Introduction Reliability is probability that a device will perform it’s intended function during a specified period of time under stated condition Design for Reliability Reliability Modeling Identify high risk components Allocate reliability growth plan for higher reliability target Perform root cause analysis for corrective actions Reliability Testing Qualification, ALT, HALT DFMEA, FRACAS, others 8/24/2011 4
  • 7.
    Reliability Test –Qualification Qualification Test Verify if new design/components meet design specification – function and operation condition, agency specification – UL or others Functional test under expected operating conditions specified in company engineering standard or design specification Comply with industry standard / regulation Not intended to fail, not test to failure (TTF) 8/24/2011 5
  • 8.
    Reliability Test –ALT Accelerated Life Testing Verify if the new design/components meet design life expectation Operational Cycling: on/off Continuous operating under specified conditions Elevated environmental stress Thermal cycling / thermal shock Corrosion resistance test Vibration Test to failure Simulate field failure Compare different designs/suppliers Allow life prediction 8/24/2011 6
  • 9.
    Reliability Test –ALT Smaller sample size (4 – 16) depend on stress level Pair test: test with baseline part Current production samples Different suppliers Different Design Stress Levels to simulate real failure mode Understand failure mechanisms Operating condition and material limit Worse case scenarios What “Test to Failure” Results Reveal Same failure modes as seen in field Operation margin Root cause of failures Optimize design parameters 8/24/2011 7
  • 10.
    Reliability Test –HALT HALT (Highly Accelerated Life Testing) Identify weak links for new design or comparison test Temperature limits Vibration limits Thermal Shock Combined Thermal Shock and Vibration Compare different design or supplier quality Design margin Operating limit 8/24/2011 8
  • 11.
    Testing Standards Industry Standards ANSI/AMCA (American National Standards Institute / The Air Movement & Control Association International Inc) ANSI/AMCA-204: Operation Vibration (fan motor) ASTM (American Society for Testing and Materials) B117: Salt Spray NEMA (National Electrical Manufacturing) NEMA MG-1: Motor NEMA 4: enclosures UL 1995: Heating and Cooling Equipment Company Engineering Standards or Specifications ES (Engineering Standard) Design Specification 8/24/2011 9
  • 12.
    Reliability Testing No industry standards available No specifications in design documents No testing procedures to follow Varied from part to part, from application to application Each test requires unique method Difficulties to simulate field failure in lab Even harder if complete new design or application 8/24/2011 10
  • 13.
    Test Plan DevelopmentProcess Identify (I) failure modes and failure mechanisms Understand history – warranty performance and field feedback Evaluate/verify under conditions for seeable misuse, not just anticipated use condition Failure modes: list all well known and unknown Design (D) test method and test matrix Develop test methods for critical failure modes Determine failure detection, failure criteria, DOE Optimize (O) test method and testing parameter Run pilot tests to find out most reasonable setup Time and cost effective Validate (V) test method and failure modes Validate test method Verify testing part meet design specification – functionality and life 8/24/2011 11
  • 14.
    Six Sigma Methodology:IDOV Road Map Success: replicate field failure and eliminate it 8/24/2011 12
  • 15.
    Test Plan Contents Functions of part Design limit: max. temperature, pressure, current, torque Operational load – mechanical, electrical, thermal Input / output signals – wiring diagram Operating condition Normal use condition Customer misuse Material properties Failure modes What, Where and How Root Cause Analysis (RCA) – true reason of failures 8/24/2011 13
  • 16.
    Test Plan Contents Testing Methods Follow industrial standard if possible: UL, ASTM, ASHRAE Apply correct load (stress) – thermal, mechanical, cycling, etc Set appropriate stress level to simulate real application condition ALT, HALT, functional check under certain conditions Failure criteria Define “Failure” for lab test setup and monitoring Testing Duration – how long going to test Failure detection 8/24/2011 14
  • 17.
    Subject Matter ExpertsInput Design Engineers have best knowledge of design functions (design specs) Product Engineers know customer requirement and operating conditions (operation mapping) Quality / Manufacturing Engineers know how it fails during production (failure mode, weak links, installation issue) Service Engineers know more customer complaints (failure mode) Material Engineers to help on failure mechanisms Agency Experts: like UL and material test Reliability Engineers to complete the puzzle: collect all inputs from different teams, develop test plan for reliability testing Lab Test Engineers and Technicians to make it happen Teamwork is Essential! 8/24/2011 15
  • 18.
    Case Study (1)Door Handle Improvement Functions Provide service access into / Identify out of unit for service Unit size from 3ftx3ft to 10ftx12ft Keep door closed while unit operating Design Background Information Failure mode: broken handle High failure rate but low warranty cost Optimize Possible Causes Impact load from shipping and handling Validate Misuse – use as ladder or grasp as moving handle Others 8/24/2011 16
  • 19.
    Case Study (1)Door Handle Improvement Handle Broken by Impact Load Moving unit by fork truck or crane, collision Identify happens, hit handle: Split Unit Weight Range: 2500 ~ 8000lb Moving Velocity: 1.6 ft/s (1 mile/h, 0.5 m/s) Impact Force range will be from 2000lb to 6400lb Design Handles, guarding, and any protrusion may fail when encounter such huge impact force Optimize Force = (W*V)/time Assume: Collision in 2s Validate Impact Test 8/24/2011 17
  • 20.
    Case Study (1)Door Handle Improvement Impact Test Identify Drop part to concrete floor Swing a ball to hit Design Shoot a solid block Free drop solid block to hit handle How to measure impact load? Optimize Weight Hit velocity Validate Hit time Height 8/24/2011 18
  • 21.
    Case Study (1)Door Handle Improvement Optimize Free drop cylinder start from 1 food Identify Measure drop height Validate Design Run pilot test to confirm it will produce same failure mode Optimize Other Tests Shear test: use handle as ladder Pull test: use handle as moving tool Validate Operating rotation test not conducted because no prototype unit available 8/24/2011 19
  • 22.
    Door Handle QualificationTest Impact Test New HDL: 2 feet, Apply impact load to center point of no failure Old: HDL: broken at 1 handle foot drop Drop throw a 10lbs cylinder, drop distance from 1 ft, increase drop distance until handle breaks New HDL: base crew Shear Test bend or pull out Old: HDL: passed 250lb Apply 250 lb load on top of handle for 3 minutes, repeat loading 3 times at 10 minutes interval Inspect any damages in handle assembly Strap Test New HDL: Not broke until 500lb, but base Apply shipping strap load to end of crew bend or pull out handle for 1 minutes, increase load from Old: HDL: Broke @ 200lb 300lbs until break handle 8/24/2011 20
  • 23.
    Design Change onNew Handle Increase base screw size and add hardened washer Re-test Success to fix old failure mode Approval for new product application Reliability model was updated, claimed to have 70% improvement However, 3 months later in prototype units….. 8/24/2011 21
  • 24.
    New Failure Mode Cam Roller Loosens Identify Noticed loosening handle at production floor Partially lost function, would not close door properly Design Cam Roller Potential Causes loosening gap Torque specification between cam roller and striker Optimize Insert material hardness Bolt material Validate 22 8/24/2011
  • 25.
    Actions to FixNew Failure Mode (IDOV) P-Diagram to identify desired functions, Identify noise factors, design control factors, error modes Design Boundary Diagram to evaluate interferences FMEA Optimize Put any potential failure modes into consideration Validate Potential causes Design, material, assembly process Recommendations on Detection and Control 8/24/2011 23
  • 26.
    Test Plan forImprovement Identify failure modes Insert Type Washer Cam Torque Identify Cam Roller loosening Current 1 Low Current 2 High Difficult to rotate Current 1 Low Base screw loosening Current 2 High Design Testing parameters Harder 1 High Harder 2 High Add 1 or 2 washers to Harder 1 Low cam bolt Harder 2 Low Increase hardness of No Insert 2 Low Optimize insert plate No Insert 1 Low Find proper bolt Torque No Insert 1 High No Insert 2 High Validate 8/24/2011 24
  • 27.
    Test Setup Mount door handles on Identify door panel How to Rotate Handles? Manual operation? Design PLC control operation? Electrical drill? Other automaton? Optimize Rotate handle 360 degree through striker by a Validate electrical drill 8/24/2011 25
  • 28.
    Test Result Old handle exhibited same failure mode Identify at about 50 cycles operation Samples with one washer added meet Design life cycle requirement Harder insert samples showed best result in terms of tightness and insert Optimize plate damage No insert sample also demonstrated improvement on the tightness Validate Cost benefit Easy to assembly 8/24/2011 26
  • 29.
    Whole Plastic Handle • Impact Test Identify Apply impact load to the center point of the handle (drop throw a metal ball or other objects), using a 10lbs object, drop distance from 1 ft, increase the drop Design distance until the handle breaks: Optimize Validate Current HDL after 4 ft drops Whole Plastic HDL after 1 ft drop 8/24/2011 27
  • 30.
    Corrective Actions basedon Test Results Generic Corrective actions for improvement: Material change: material used did not meet design specification Manufacturing assembly change: part variation or manufacturing defect cause infant failures Design change: design concept change Door Handle Use harder insert material and torque tolerance limit was specified Apply hardened washers on both sides of insert plate Handle without insert material showed similar performance in terms of rotation cycling, but failed impact test and pull test, it is not recommended 8/24/2011 28
  • 31.
    Handles in HVACUnit This door handle becomes one of new features that our customers enjoy most High perceived quality Easy to rotate Very robust 8/24/2011 29
  • 32.
    Lessons Learned Focus well known failure modes, but never overlook unknown failure modes New design may introduce new failure modes while removing well known failure modes Use reliability engineering tools to identify potential failure modes before start test planning Do not skip steps, if not possible to do it, find alternative way 8/24/2011 30
  • 33.
    Case Study (2)– Anti Spin Rod Anti-Spin Rod field failures Identify Fatigue at inner groove Design life: 30,000 cycles Broken Design Mount plate Optimize Screw Actuator Validate Bracket Fracture Surface 8/24/2011 31
  • 34.
    Case Study (2)– Anti Spin Rod Current Design and Machining Quality Very rough groove surface Identify Sharp groove edge - no radius Some samples had less 90 degree bend angle Design Optimize ALT Samples Baseline: current production samples (bend, Validate rough surface) Improved surface with radius 8/24/2011 32
  • 35.
    Case Study (2)– Anti-Spin Rod Test Fixture Design Identify How to apply stress – air cylinder, weight blocks, actual damper? How to measure load? Design Optimize Not apply torque load to actuator, achieve Optimize desired load by using fixed Jackshaft Simple but effective Validate 8/24/2011 33
  • 36.
    Case Study (2)– Anti-Spin Rod Validate Identify Measure actuator torque which is same as part specified Be able to duplicate field failure – Design fatigue at inner groove Optimize Validate 8/24/2011 34
  • 37.
    Case Study (2)– Anti Spin Rod Test Results ReliaSoft W eibull++ 7 - www.ReliaSoft.com Unreliability vs Time Plot 1.000 U nreliability 20 – 40 K cycles Design Margin Design Margin Baseline: Rod Baseline Lognormal-2P RRX SRM MED FM 82% FR F=4/ S=5 Data Points 40 K cycles U nreliability Line 0.800 Rod Rounded W eibull-2P RRX RRM MED FM F=3/ S=0 Data Points I ntervals U nreliability Line 0.600 Improved: Unreliability, F(t)=1-R(t ) 40% FR 0.400 0.200 100K Cycles Keyanna Qi Trane 11/ 22/ 2010 0.000 12:39:15 PM 0 4.E+4 8.E+4 1.E+5 2.E+5 2.E+5 Time (Cycles) Rod Baseline: µ=10.9874, σ=0.7704, ρ=0.9594 Rod Rounded: β=6.2192, η=1.3496Ε+5, ρ=0.9557 8/24/2011 35
  • 38.
    Case Study (2)–Anti Spin Rod Observe a lot from just watching Failure rate of the improved samples were 50% less than the baseline @ 100,000 cycles Rounded sample show no failures within design margin, failed part still works Good to go……but, can be better? Broke rod still functional 8/24/2011 36
  • 39.
    Case Study (2)–Anti Spin Rod Worst stress load on weakest point Is one groove better than two grooves Inner groove is always subjected to shear stress when actuator moves If only one groove (cut outer groove) then shear (bending) stress will transfer to angle corner – much stronger Confirm with design team: no special reason to have end groove 8/24/2011 37
  • 40.
    Case Study (2)–Anti Spin Rod Test one groove and Validate One groove with worst surface quality Test to 120,000 cycles, no failures Estimated to be better than rounded sample Less material Lower machining requirement More robust 8/24/2011 38
  • 41.
    From Good toGreat Test suspended at 120,000 cycles without any failure ReliaSoft W eibull++ 7 - www.ReliaSoft.com Unreliabilit y vs Time Plot 1.00 U nreliability 20 – 40 K cycles Design Margin Design Margin Baseline: R odBas el i ne 0.82 Lognorm al -2P R R X SR M MED FM F=4/S=5 40 K cycles D ata Poi nts 0.80 U nrel i abi l i ty Li ne R odR ounded Wei bul l -2P R R X R R M MED FM F=3/S=0 Unreliability, F(t)=1-R(t) D ata Poi nts 0.60 Interval s U nrel i abi l i ty Li ne Rounded: R odOne Groove Wei bul l -1P 0.40 0.40 MLE SR M MED FM F=0/S=6 U nrel i abi l i ty Li ne One Groove: 0.20 0.15 100K Cycles Keyanna Qi Trane 11/ 23/ 2010 3:38:34 PM 0.00 0 4.E+4 8.E+4 1.E+5 2.E+5 2.E+5 Time (Cycle s) RodO ne Groove : β = 6 . 0 0 0 0 , η = 1 . 6 2 1 1 Ε + 5 RodBase line : µ = 1 0 . 9 8 7 4 , σ = 0 . 7 7 0 4 , ρ = 0 . 9 5 9 4 RodRounde d: β = 6 . 2 1 9 2 , η = 1 . 3 4 9 6 Ε + 5 , ρ = 0 . 9 5 5 7 8/24/2011 39
  • 42.
    Lessons Learned Make it from Good to Great Understand functions of components and design requirement Understand limit of manufacturing process Take one more step to make design more robust and cost effective Lower machining tolerance requirement Reduce material use As reliability and testing engineer, we are able to help more than what others thought New perspective to ask more questions 8/24/2011 40
  • 43.
    Never Skip SystemValidation Component passed qualification test alone, does not mean it works in the subsystem or system Validation tests to verify if the new component meets design specification and life expectation at system level System Validation Tests System / Subsystem Integration Follow normal installation process Subject to operating condition or accelerated stress level of operating conditions Meet life exception or confirm the old failure modes were removed 8/24/2011 41
  • 44.
    Summary Reliability Engineer is not particular component expert (valve, sensor, electrical controls, or system design), but be able to collect information and collaborate with various engineering groups to develop comprehensive reliability test plans Reliability test plan development follows process of Identify – Design – Optimize – Validate Do not overlook any potential failure modes, especially unknown failure modes Apply DOE for design change optimization Always run validation test for final approval Put enthusiasm into your work to drive it from Good to Great 8/24/2011 42
  • 45.
    Where to GetMore Information Annual Book of ASTM Standards Materials, instrumentation evaluation or testing ASHRAE Handbook HVAC equipments and components MG 1-2006 by National Electrical Manufactures Association Motor testing Military Handbook: Reliability Prediction of Electronic Equipment (MIL-HDBD-217F) Consult with subject experts in your organization They know more than you thought 8/24/2011 43
  • 46.
    Questions Thank you for your attention. Do you have any questions? 8/24/2011 44