Download as PDF, PPTX


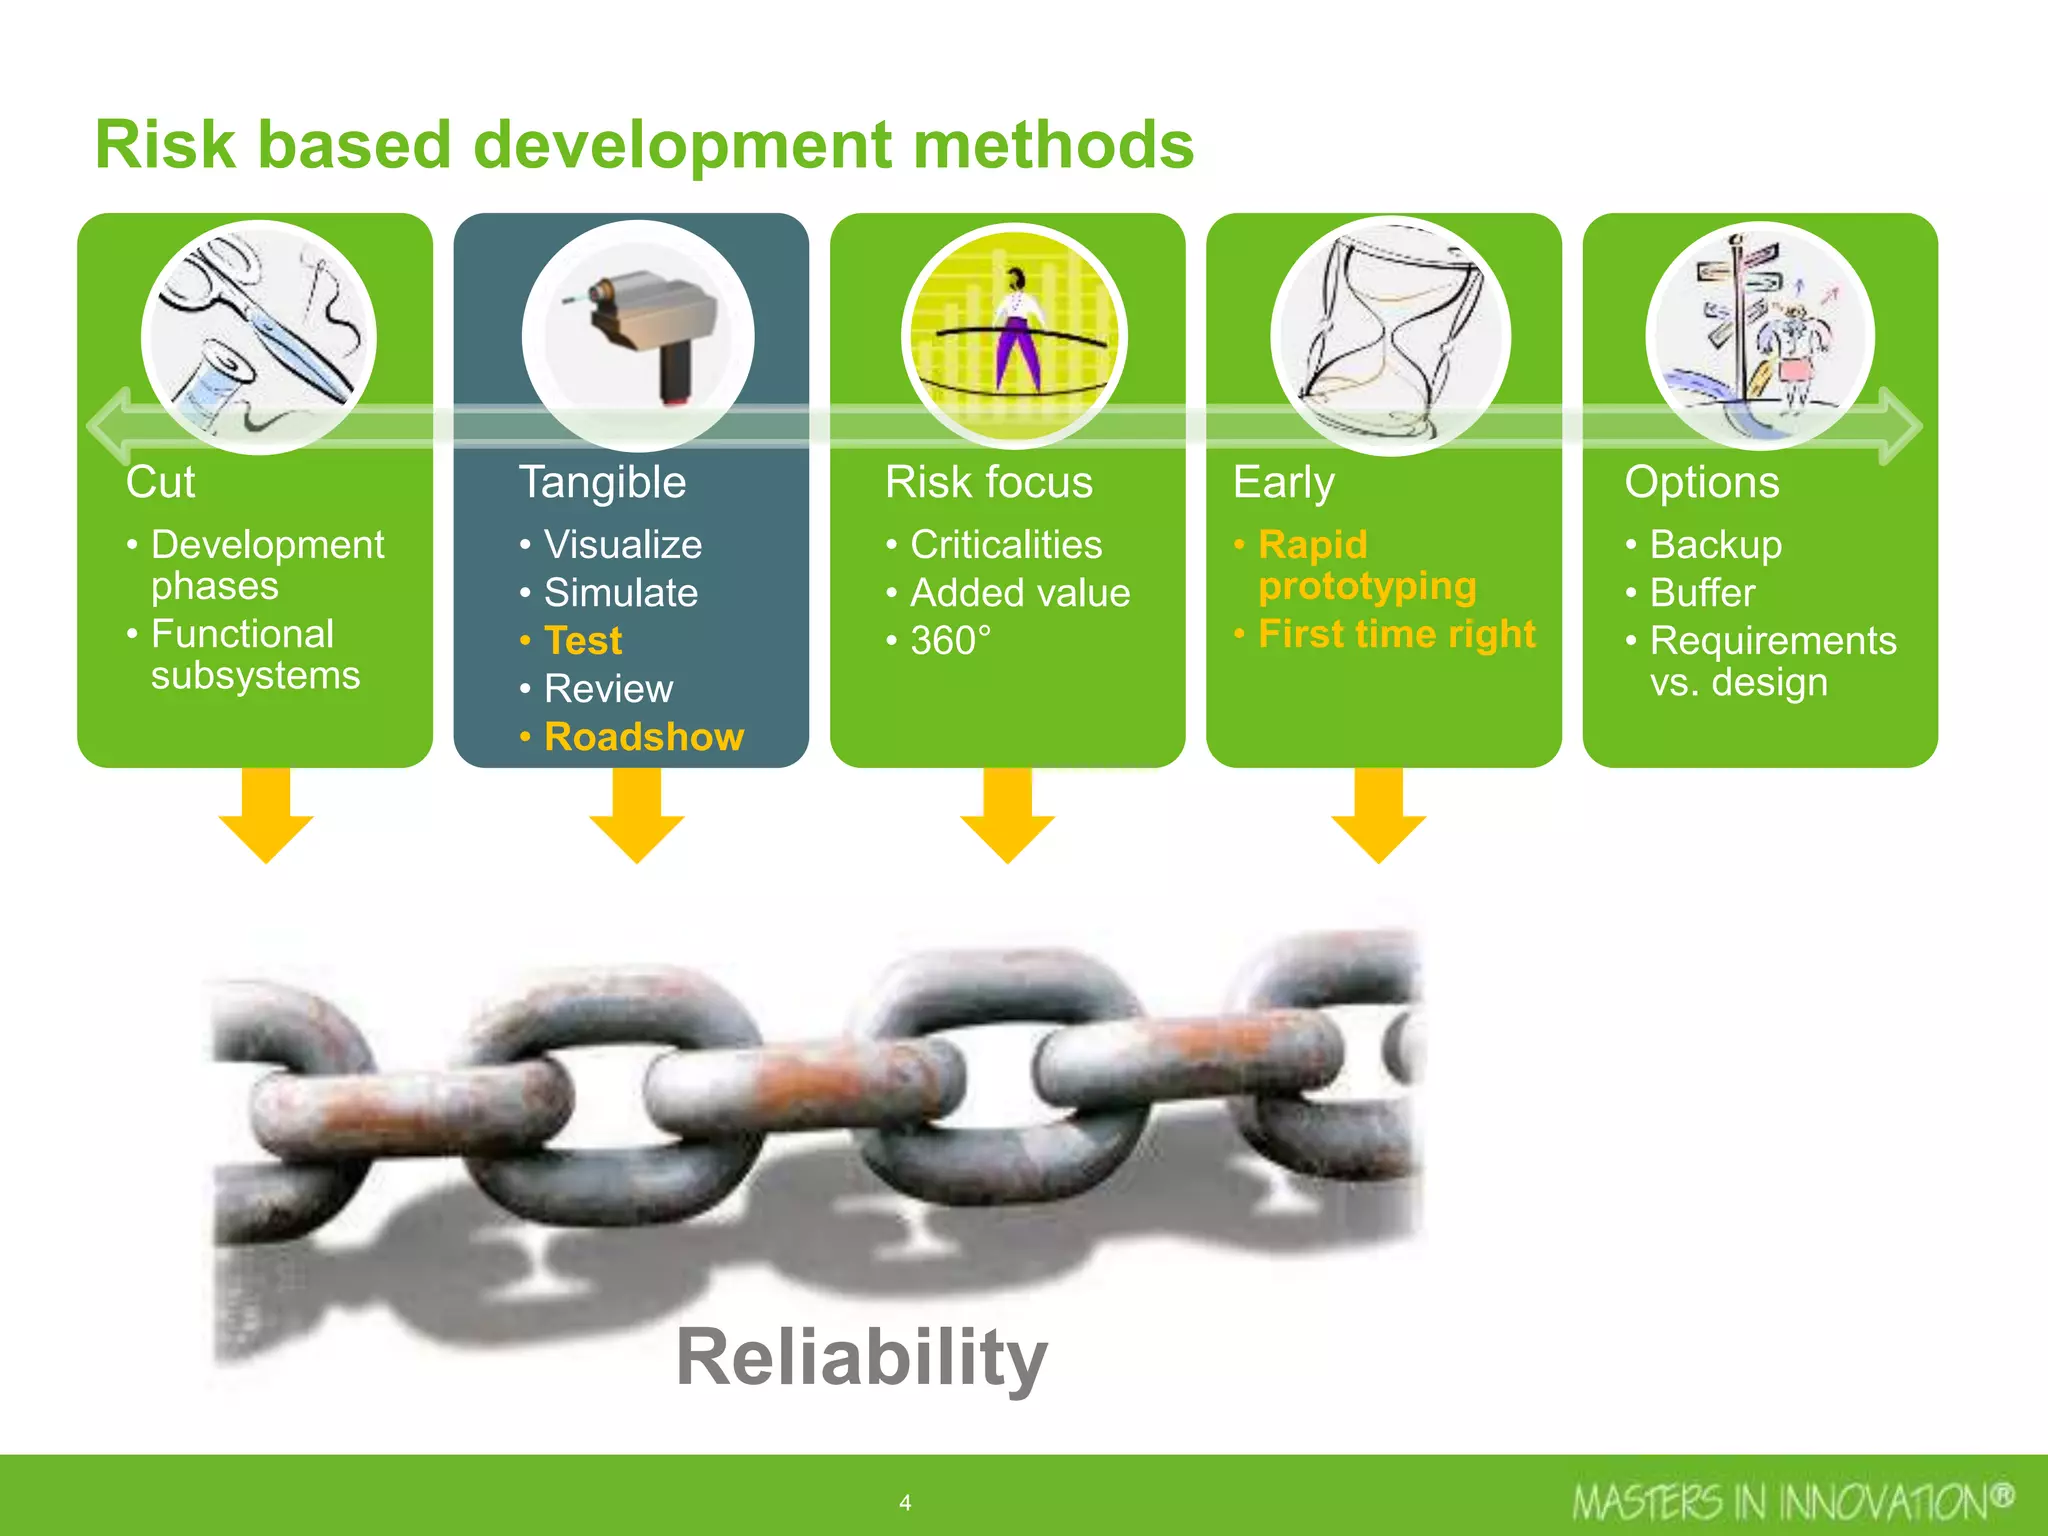
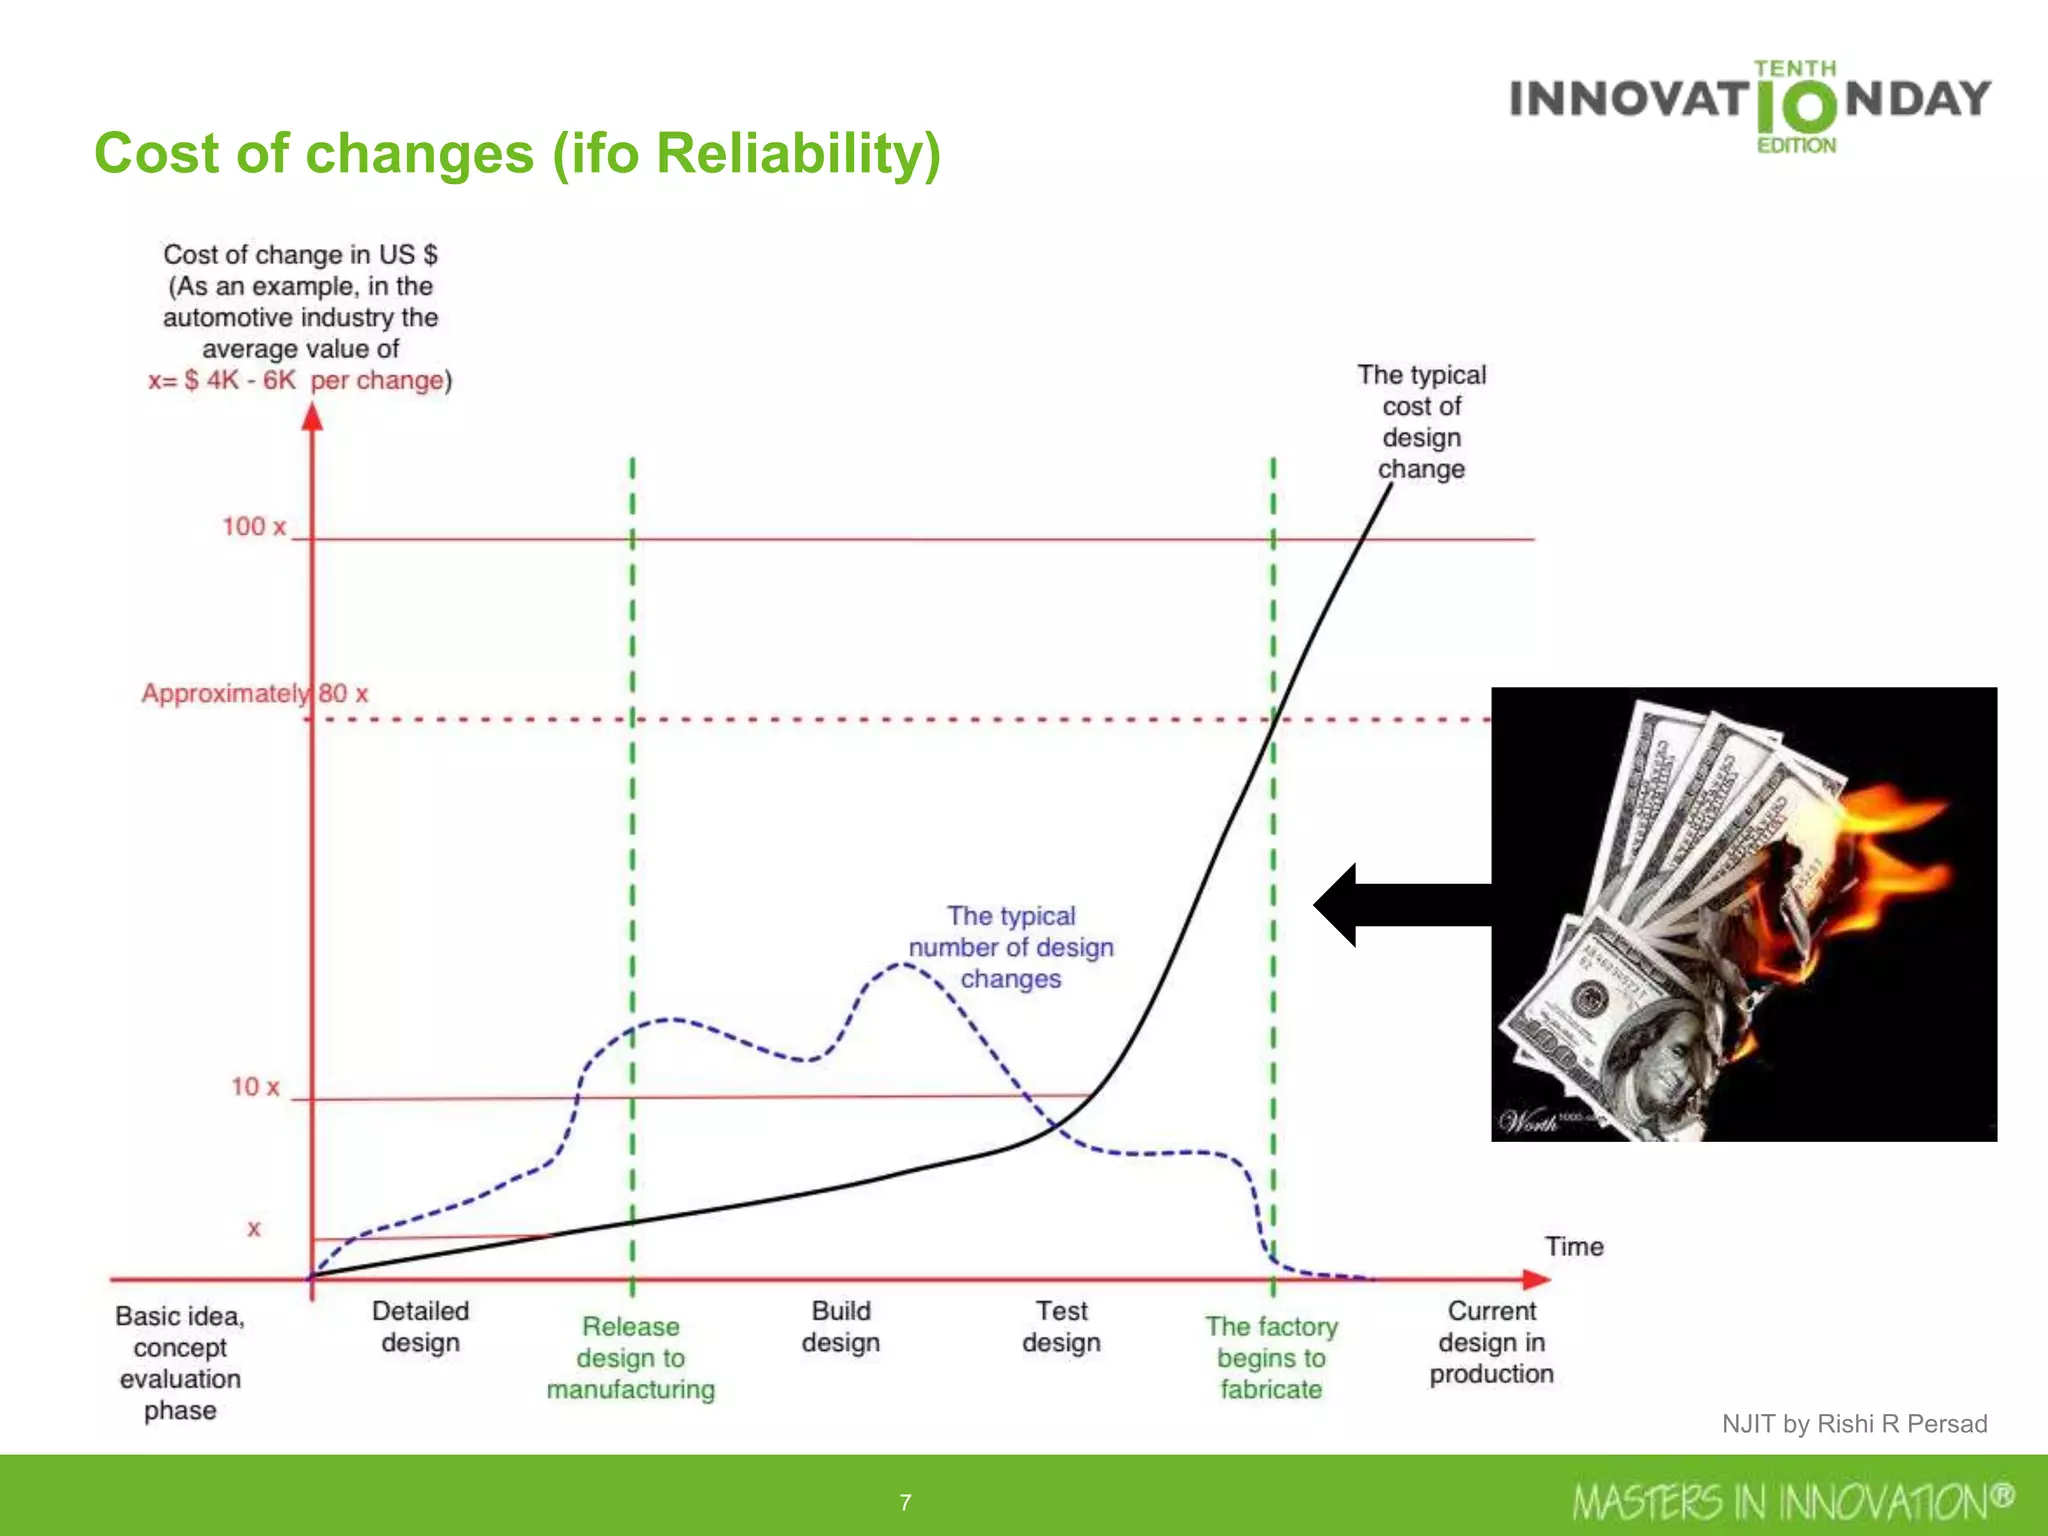
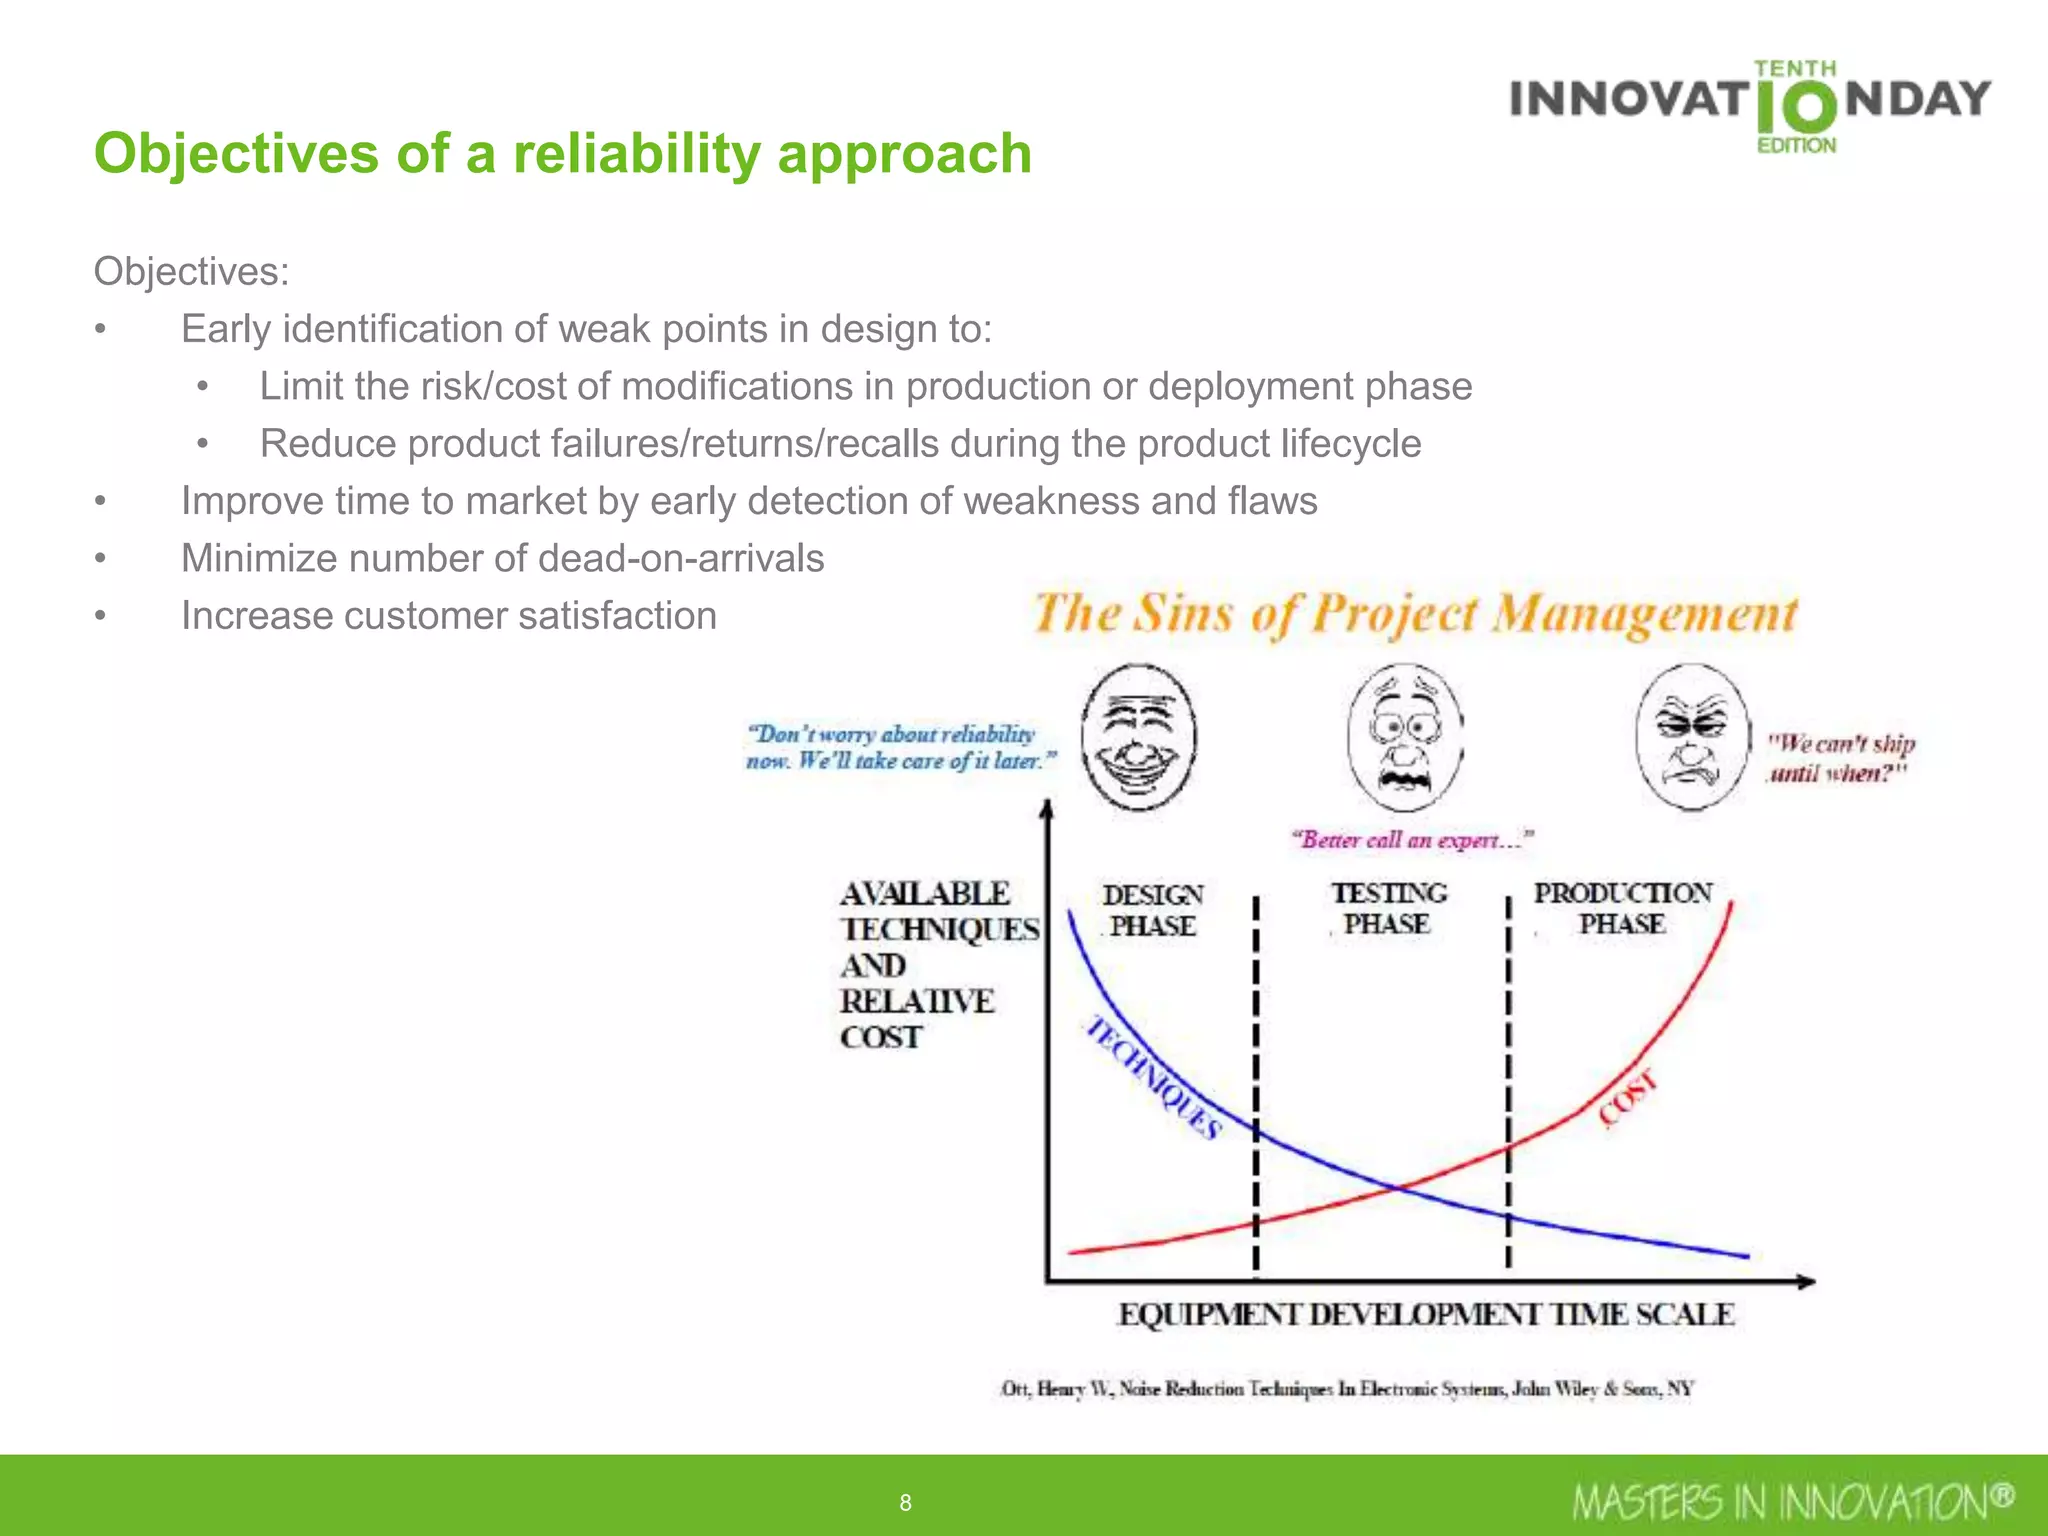
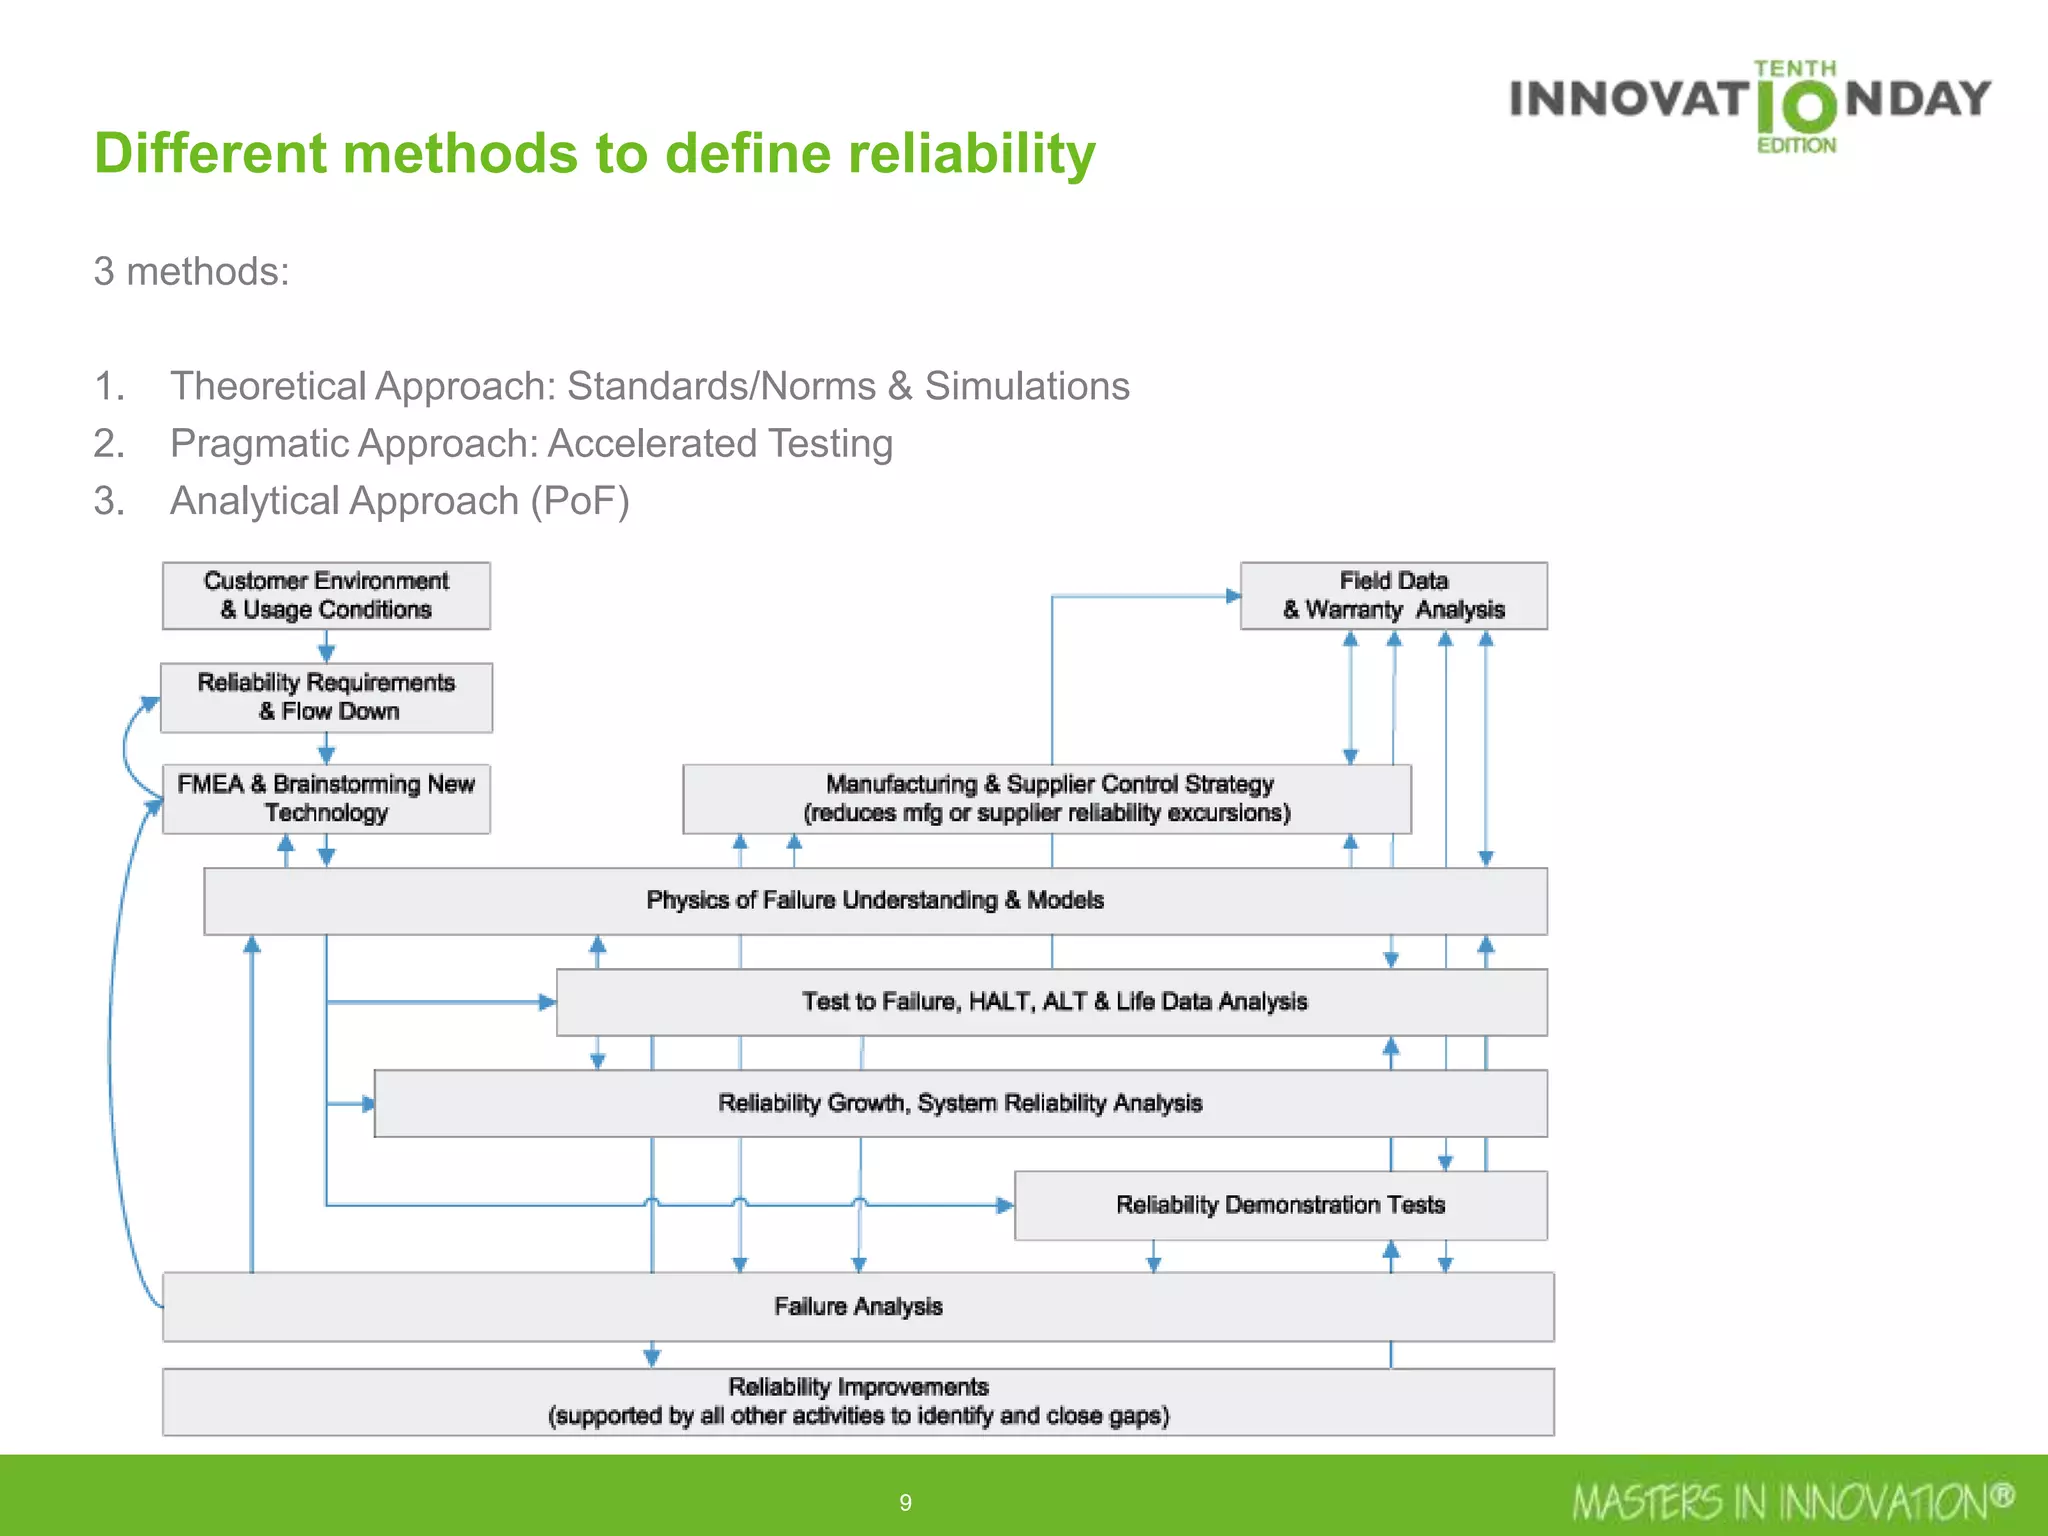
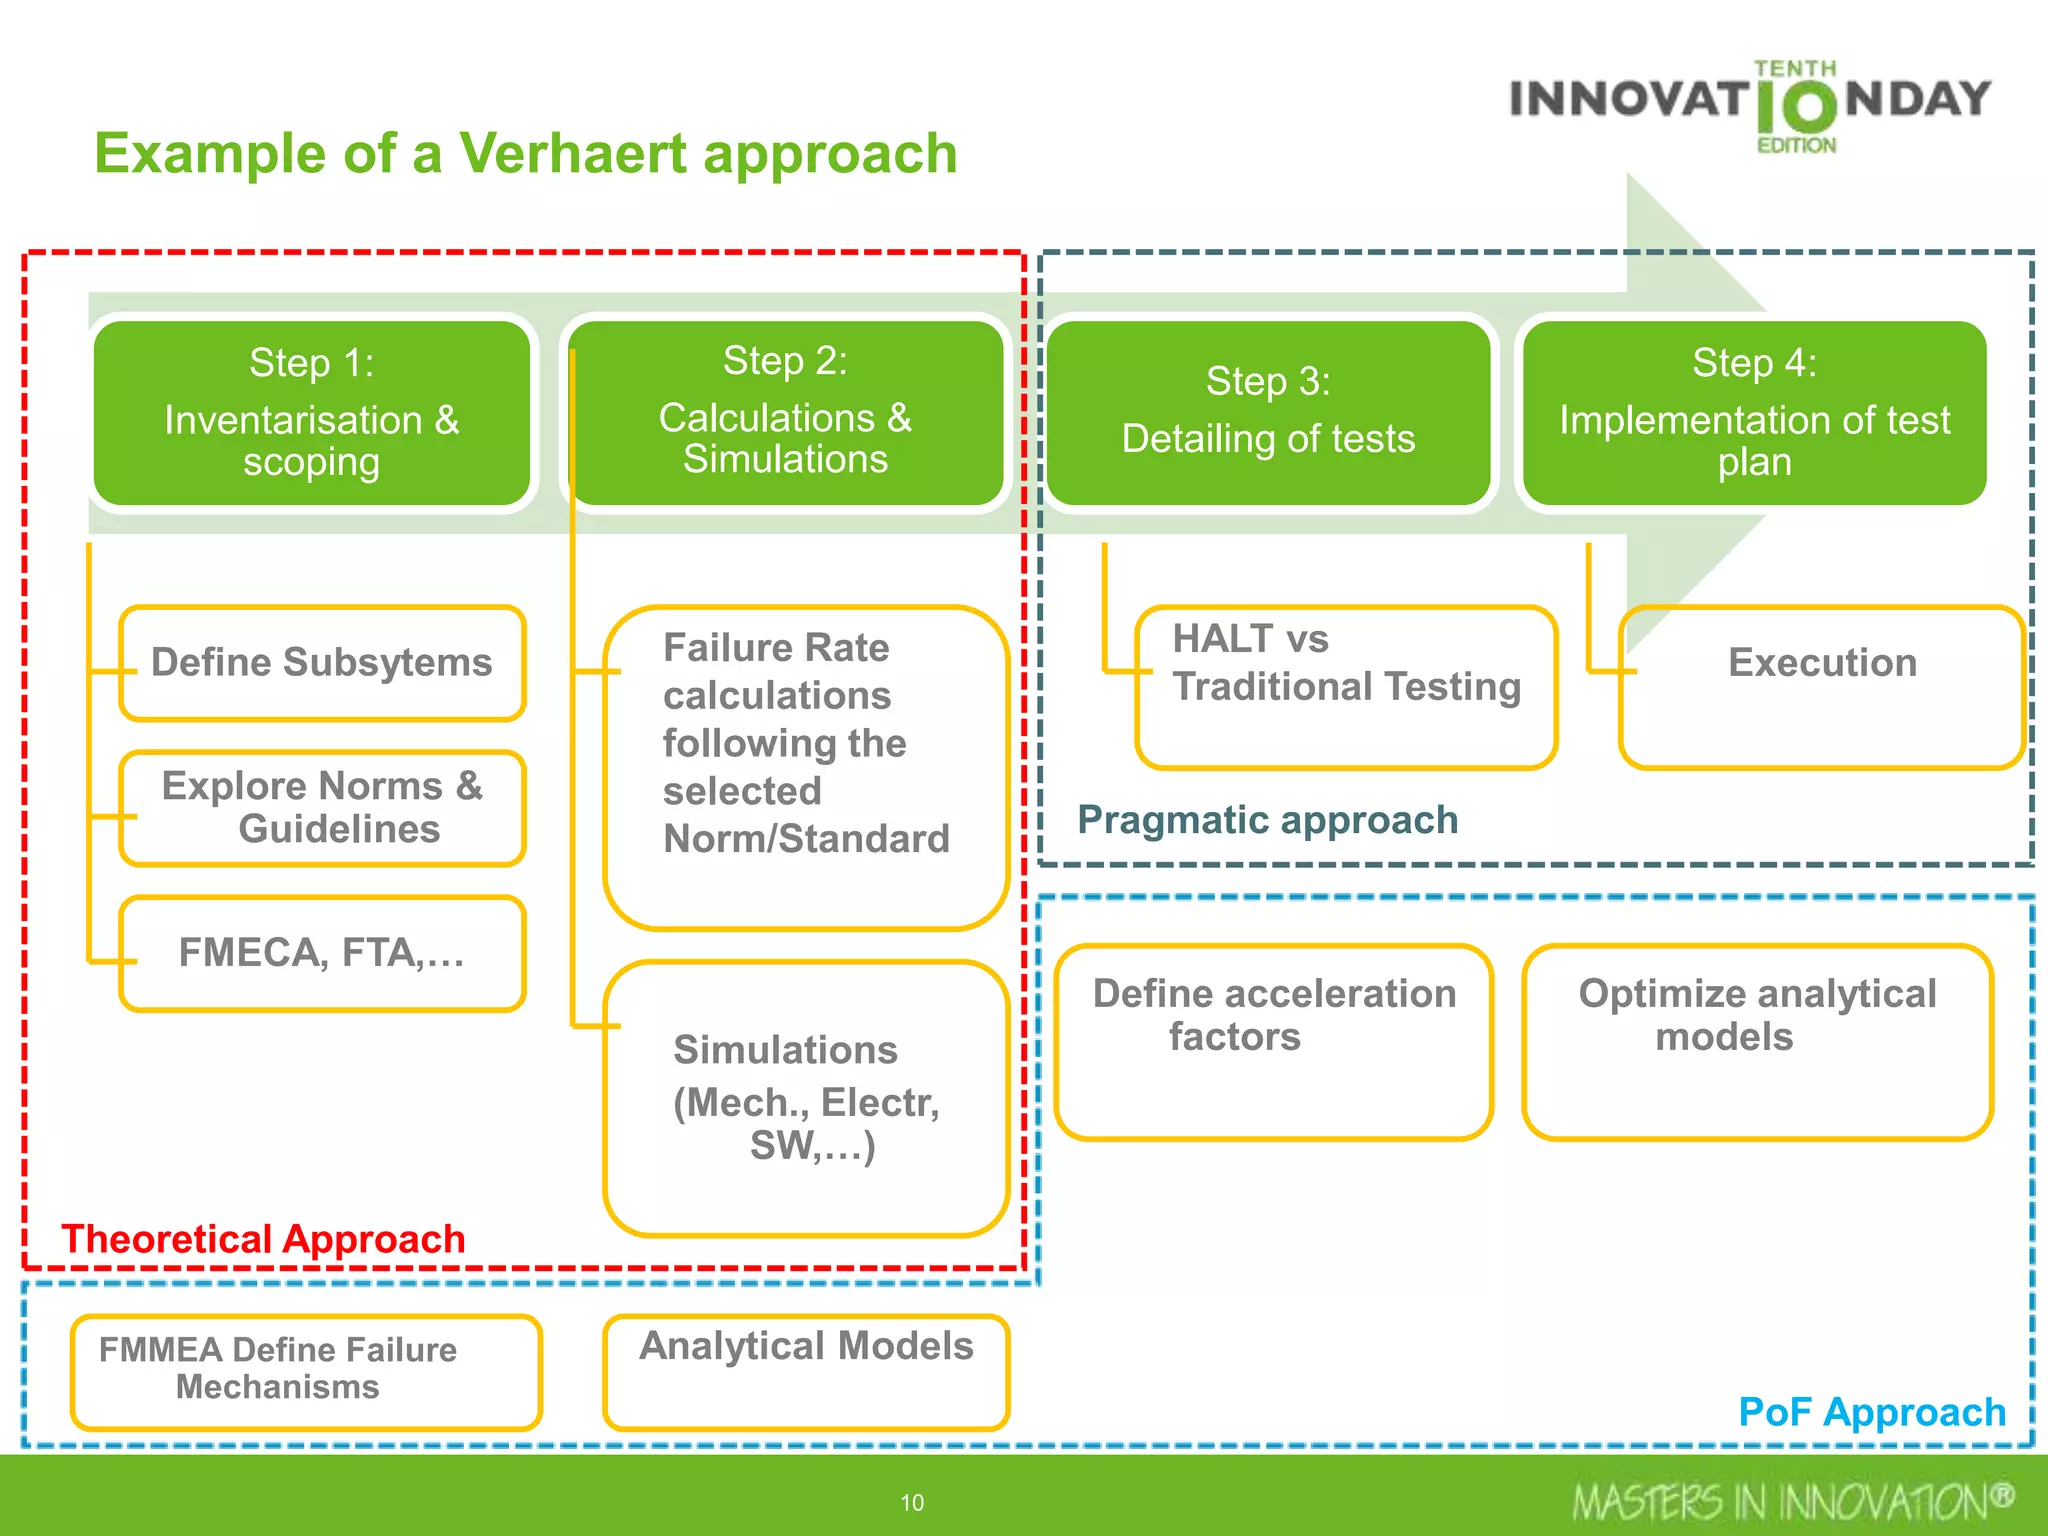
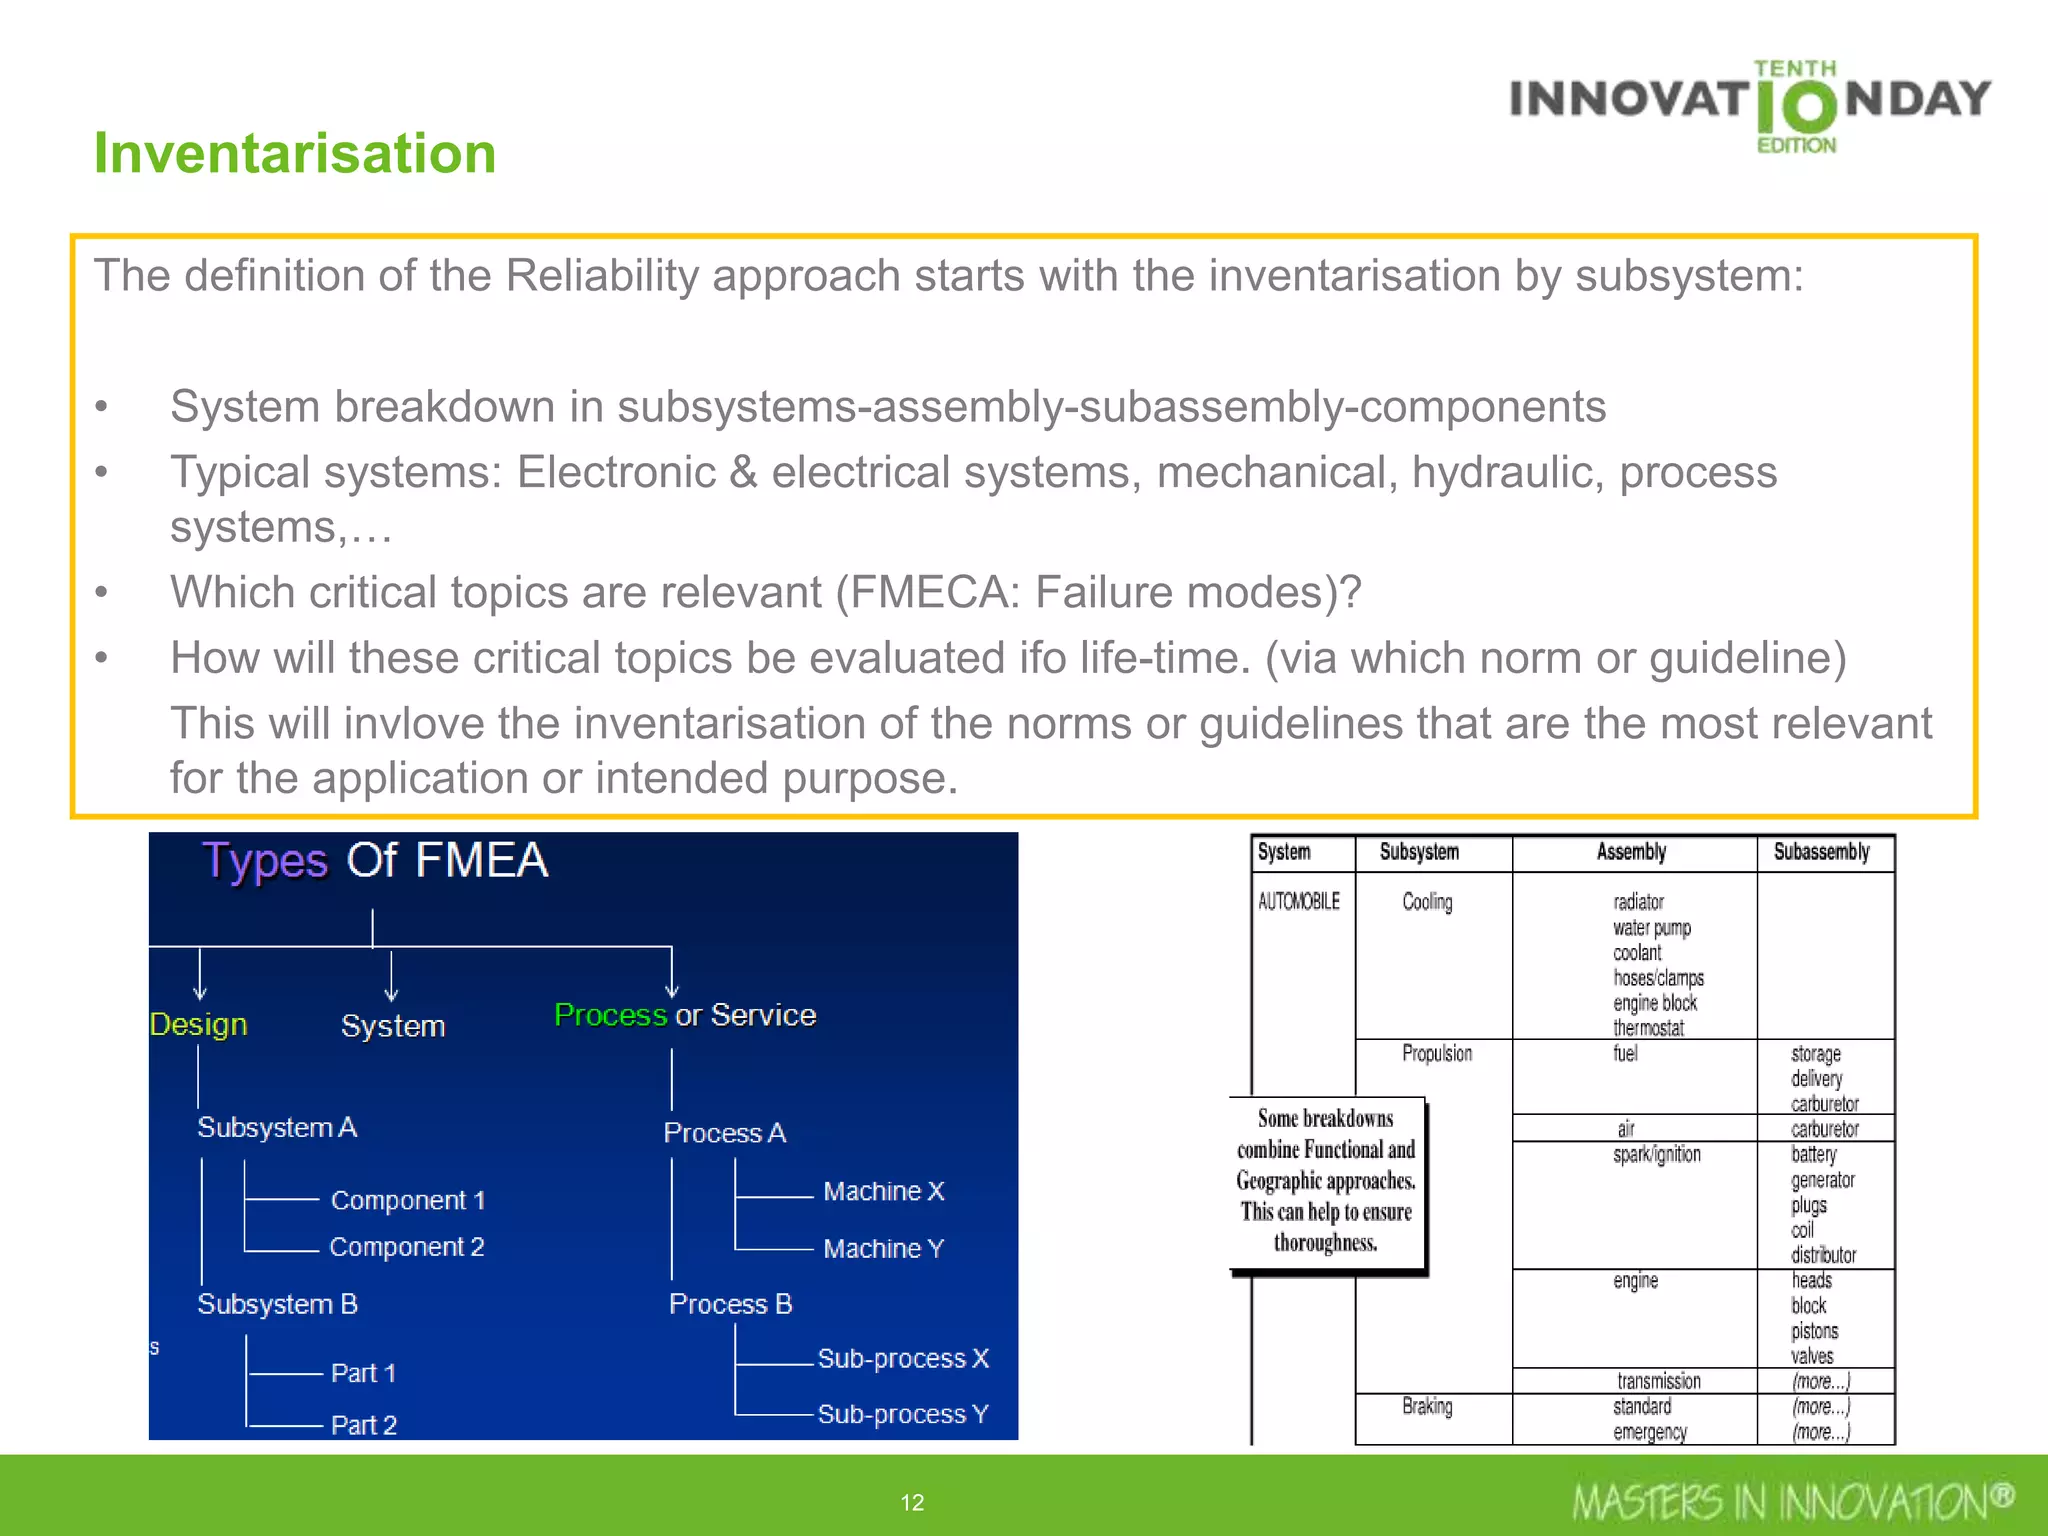
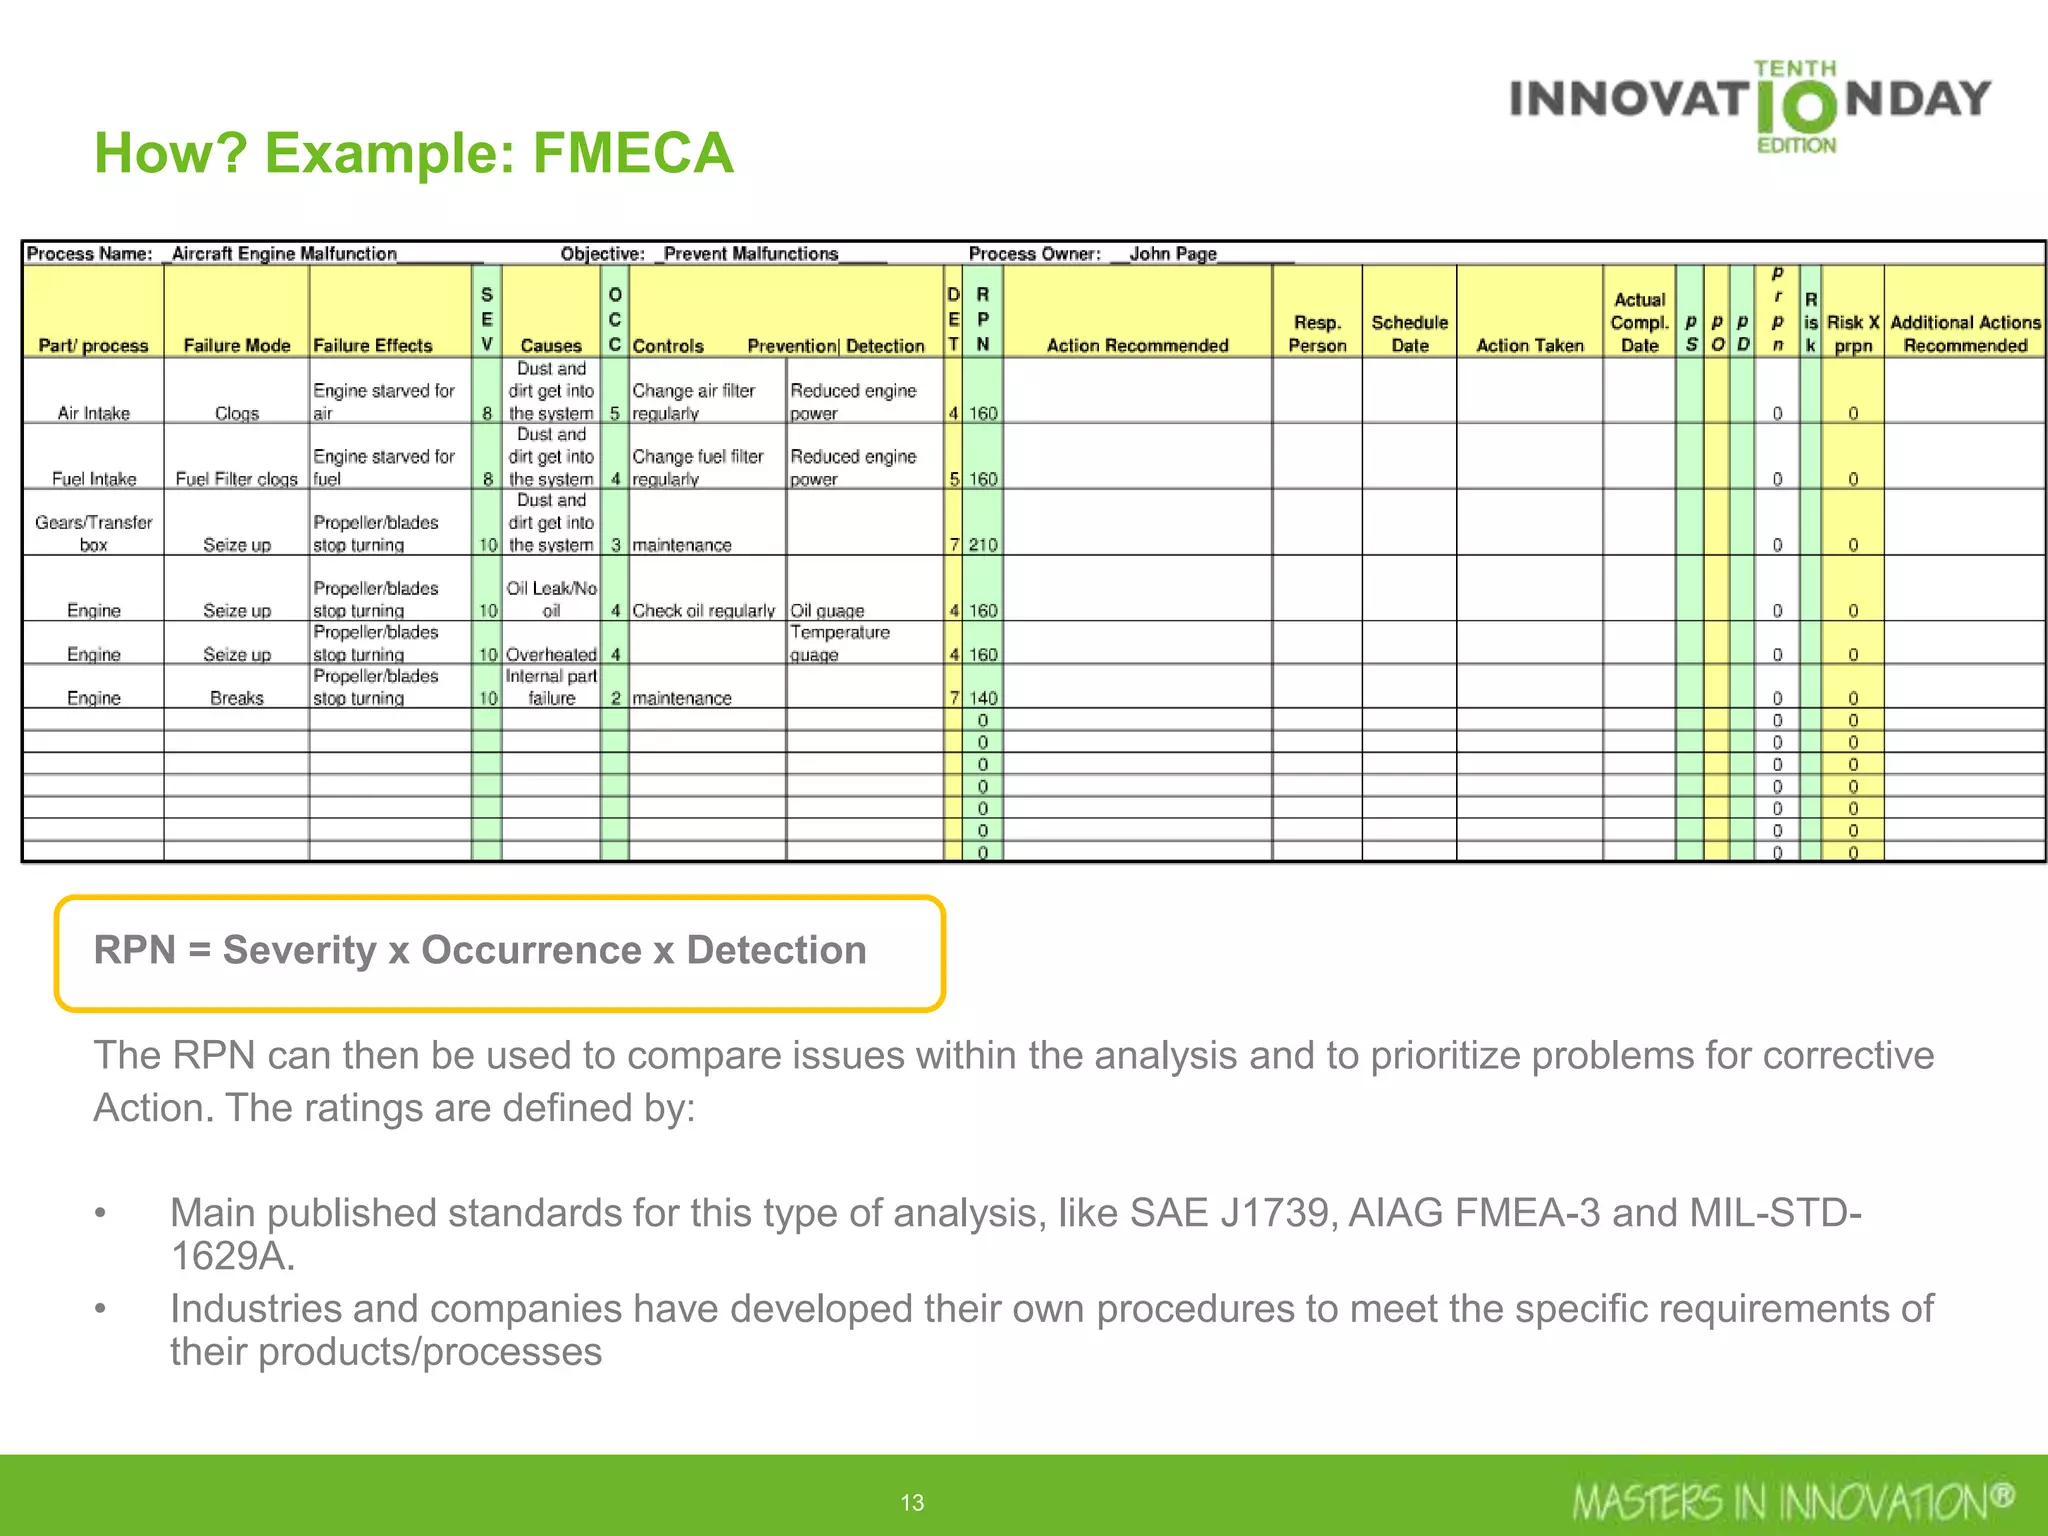
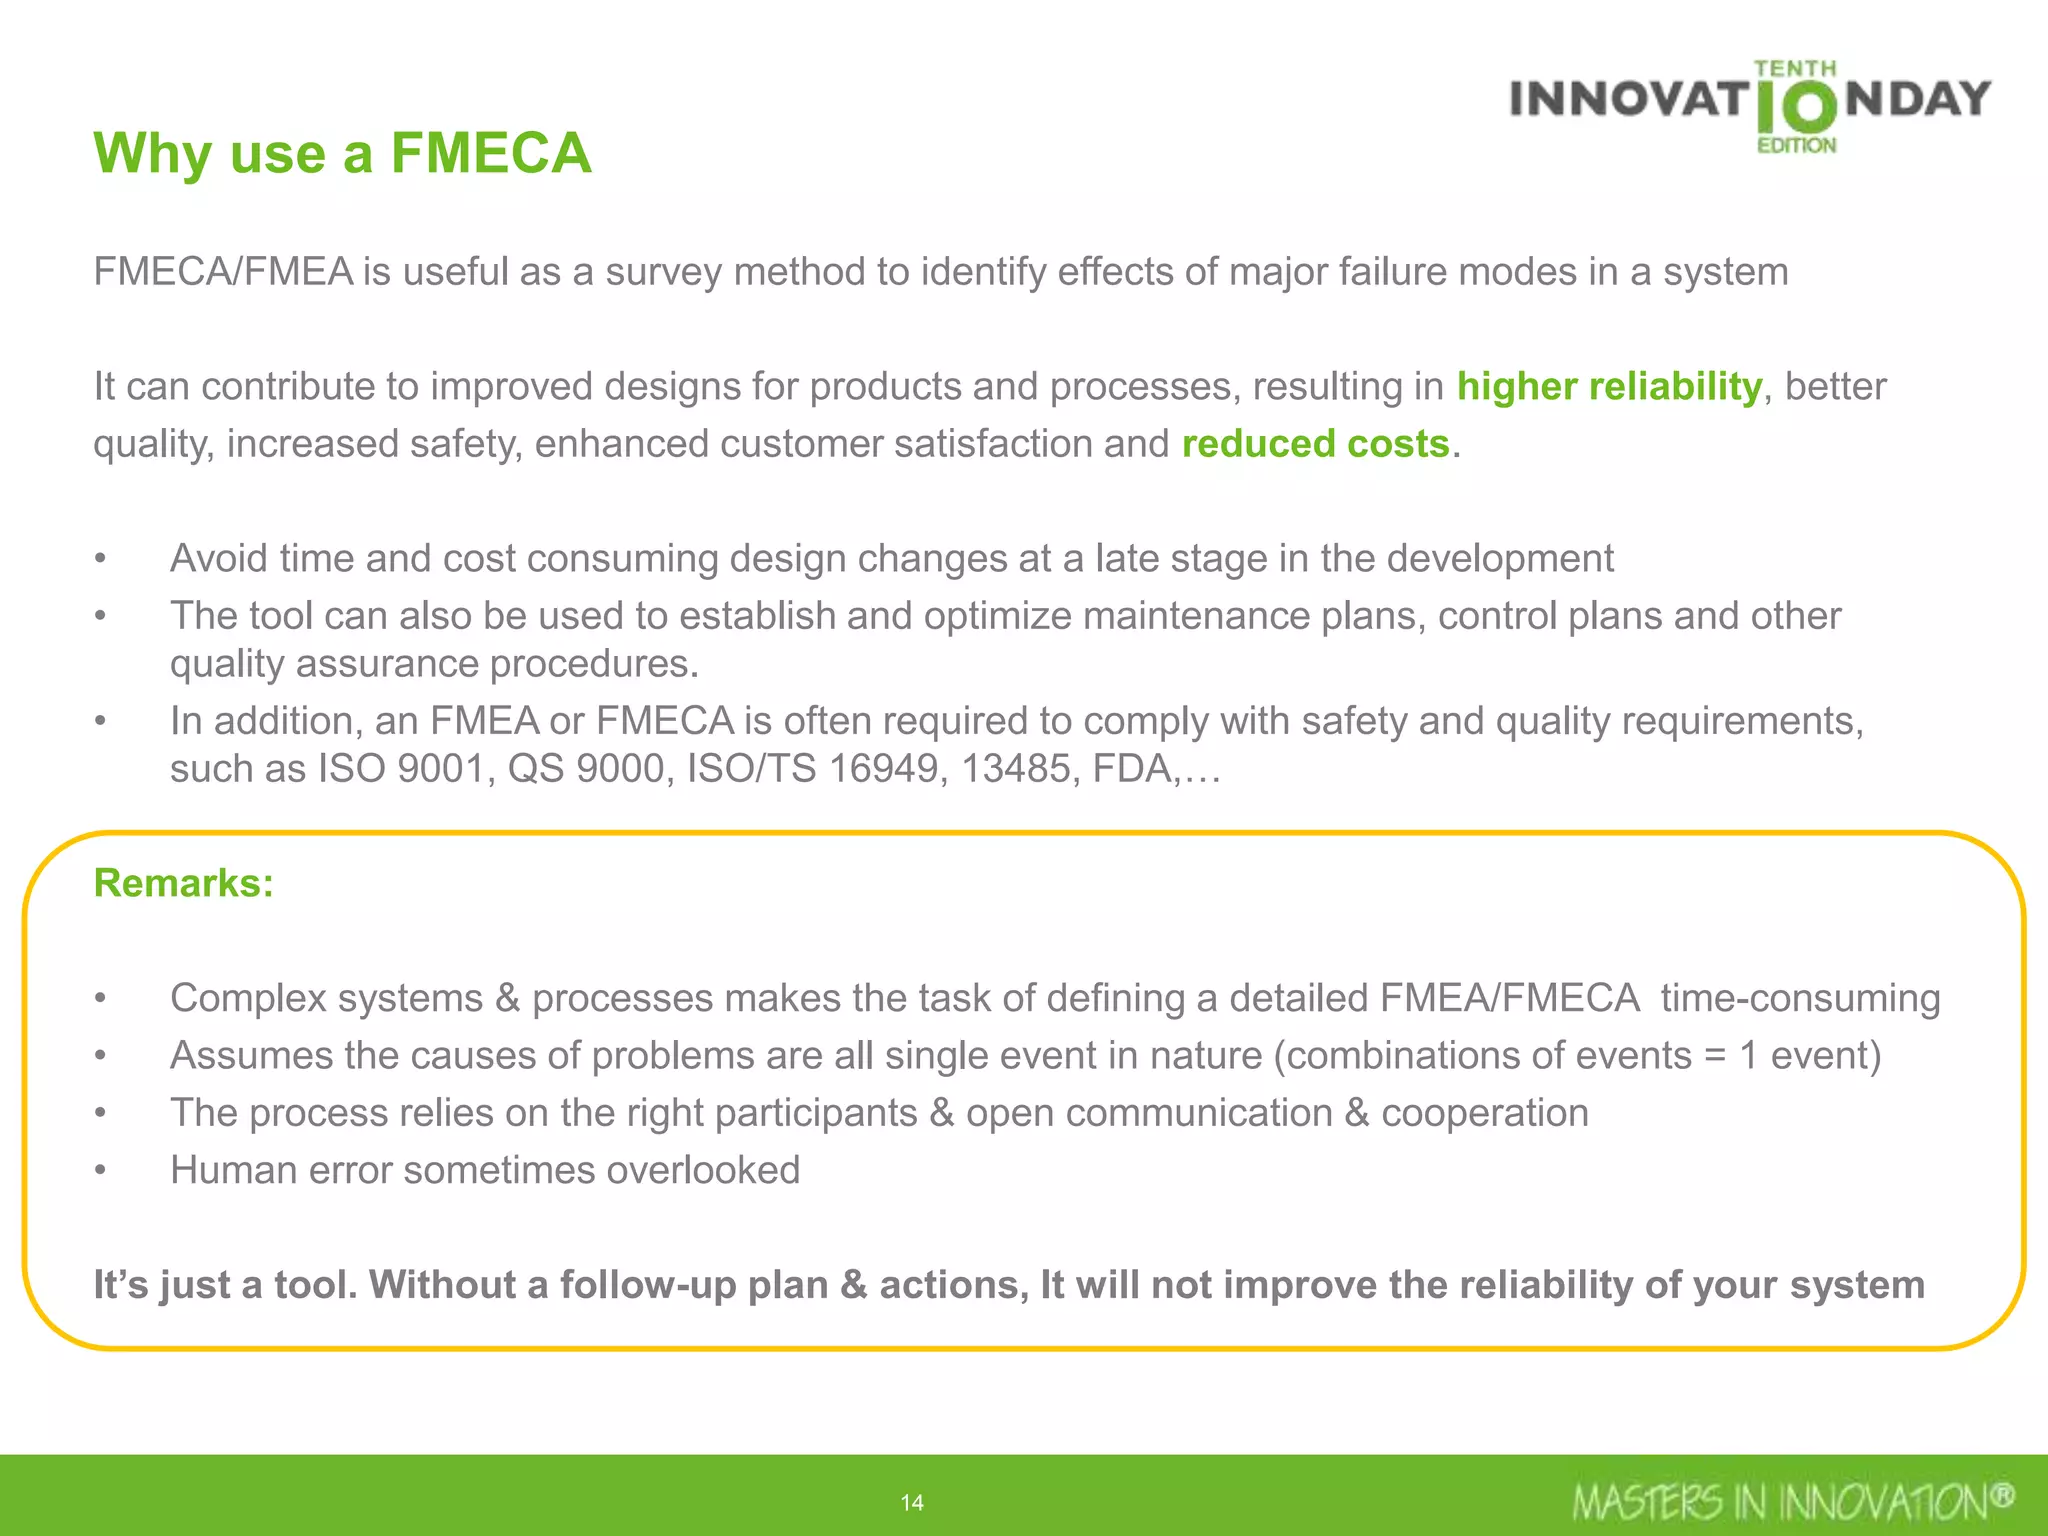
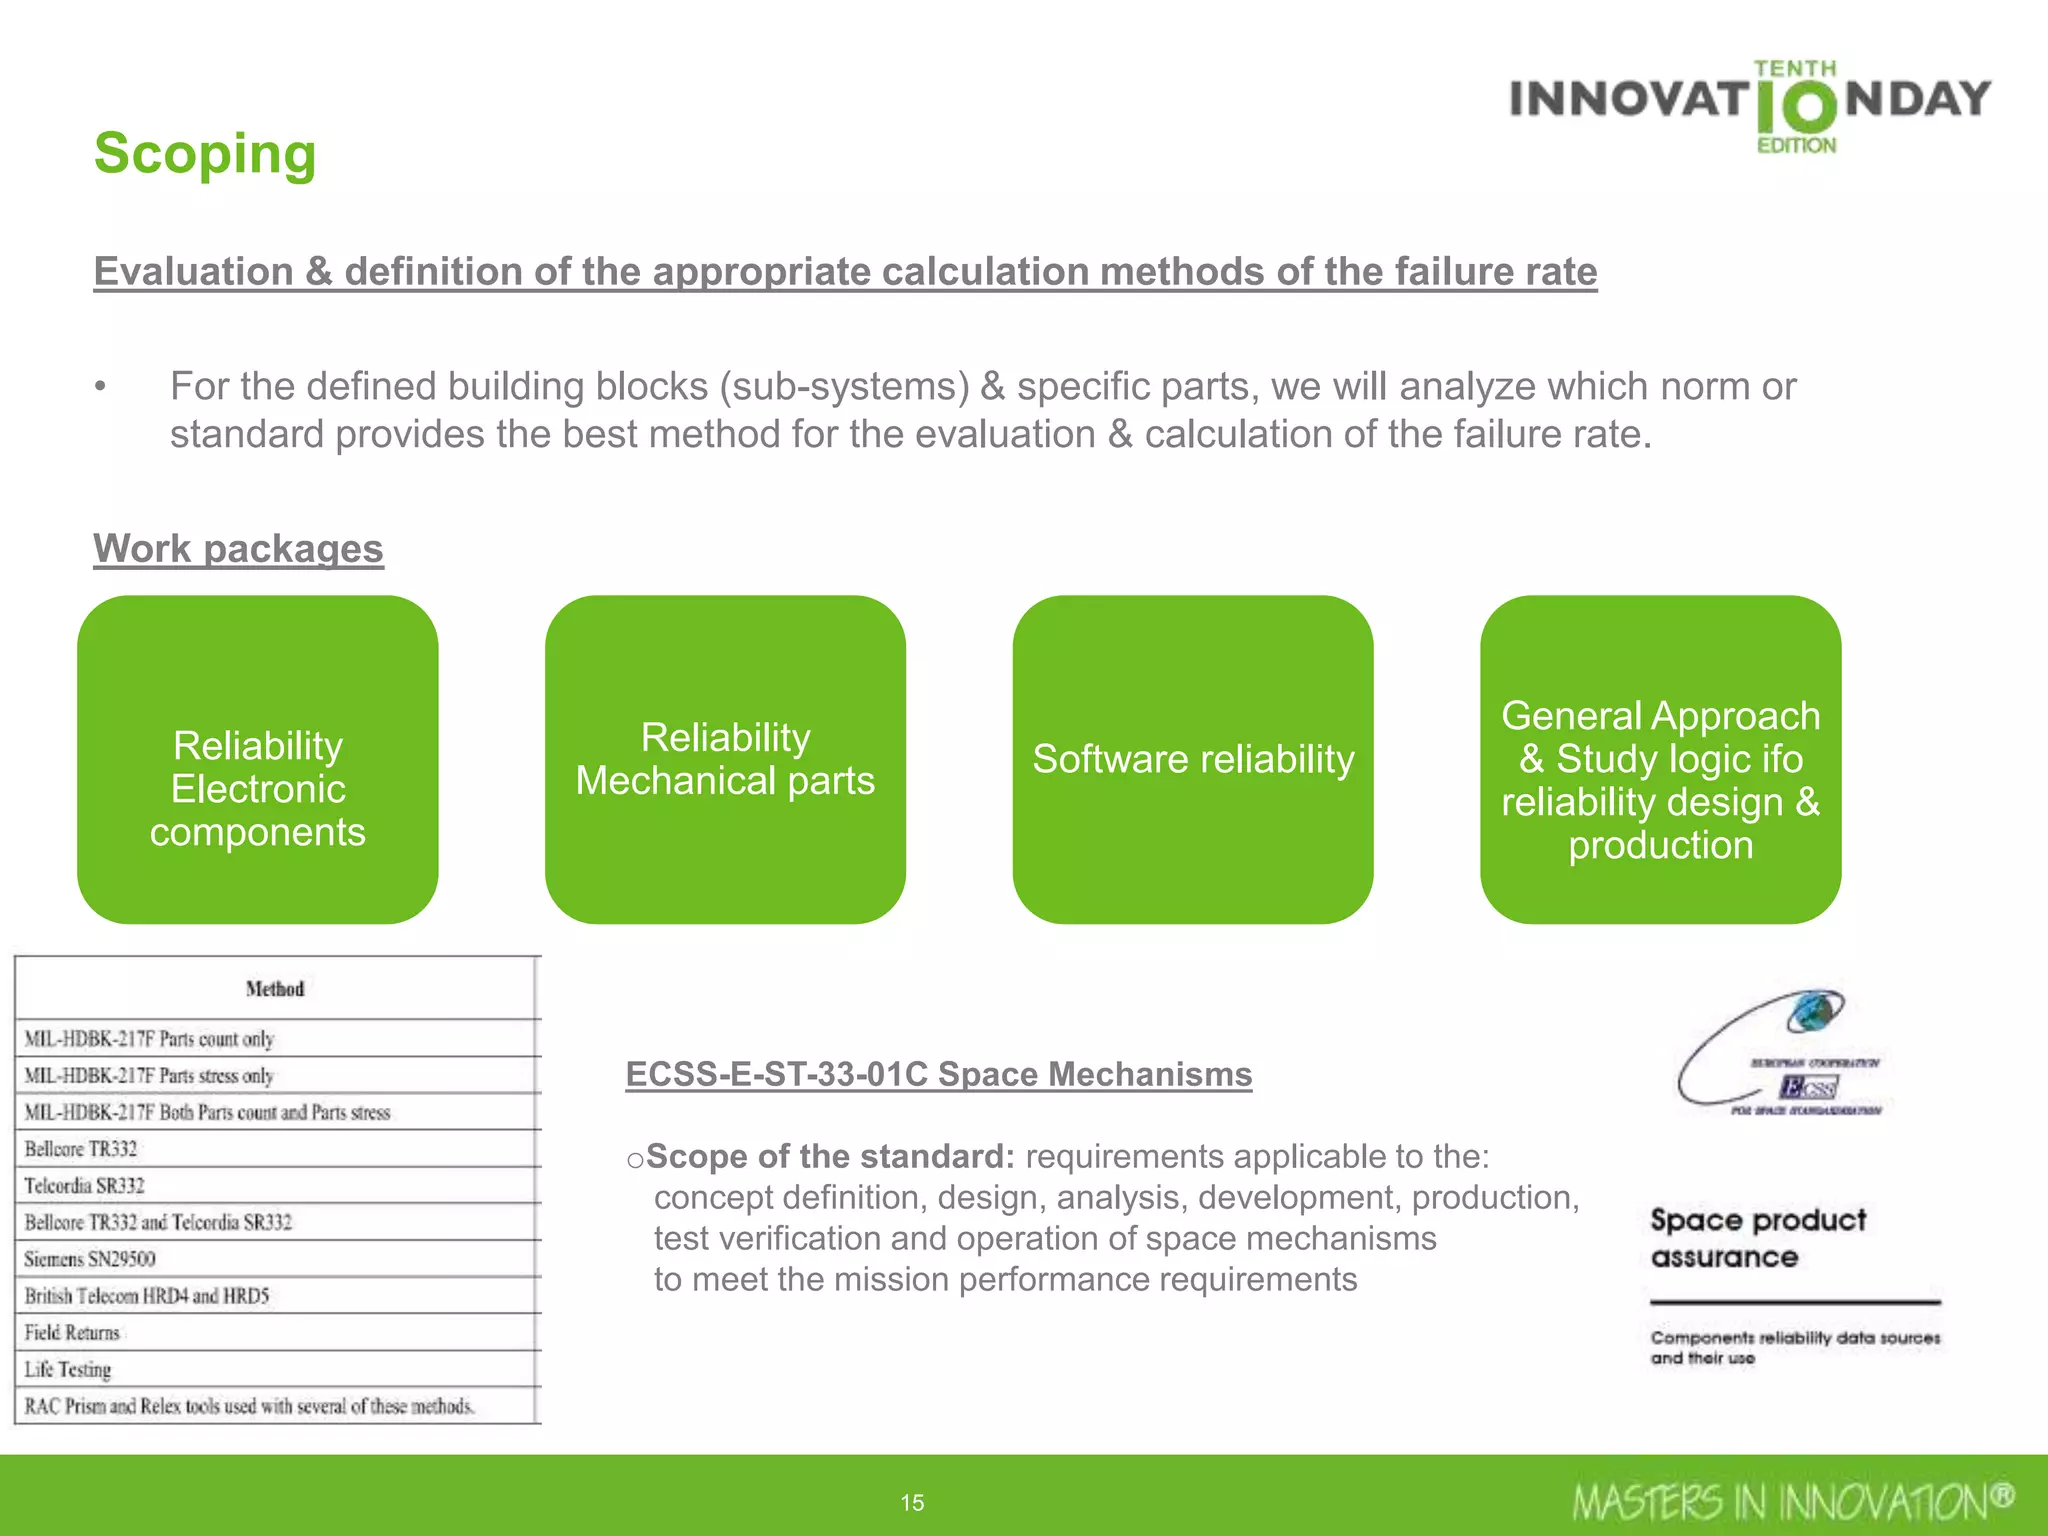

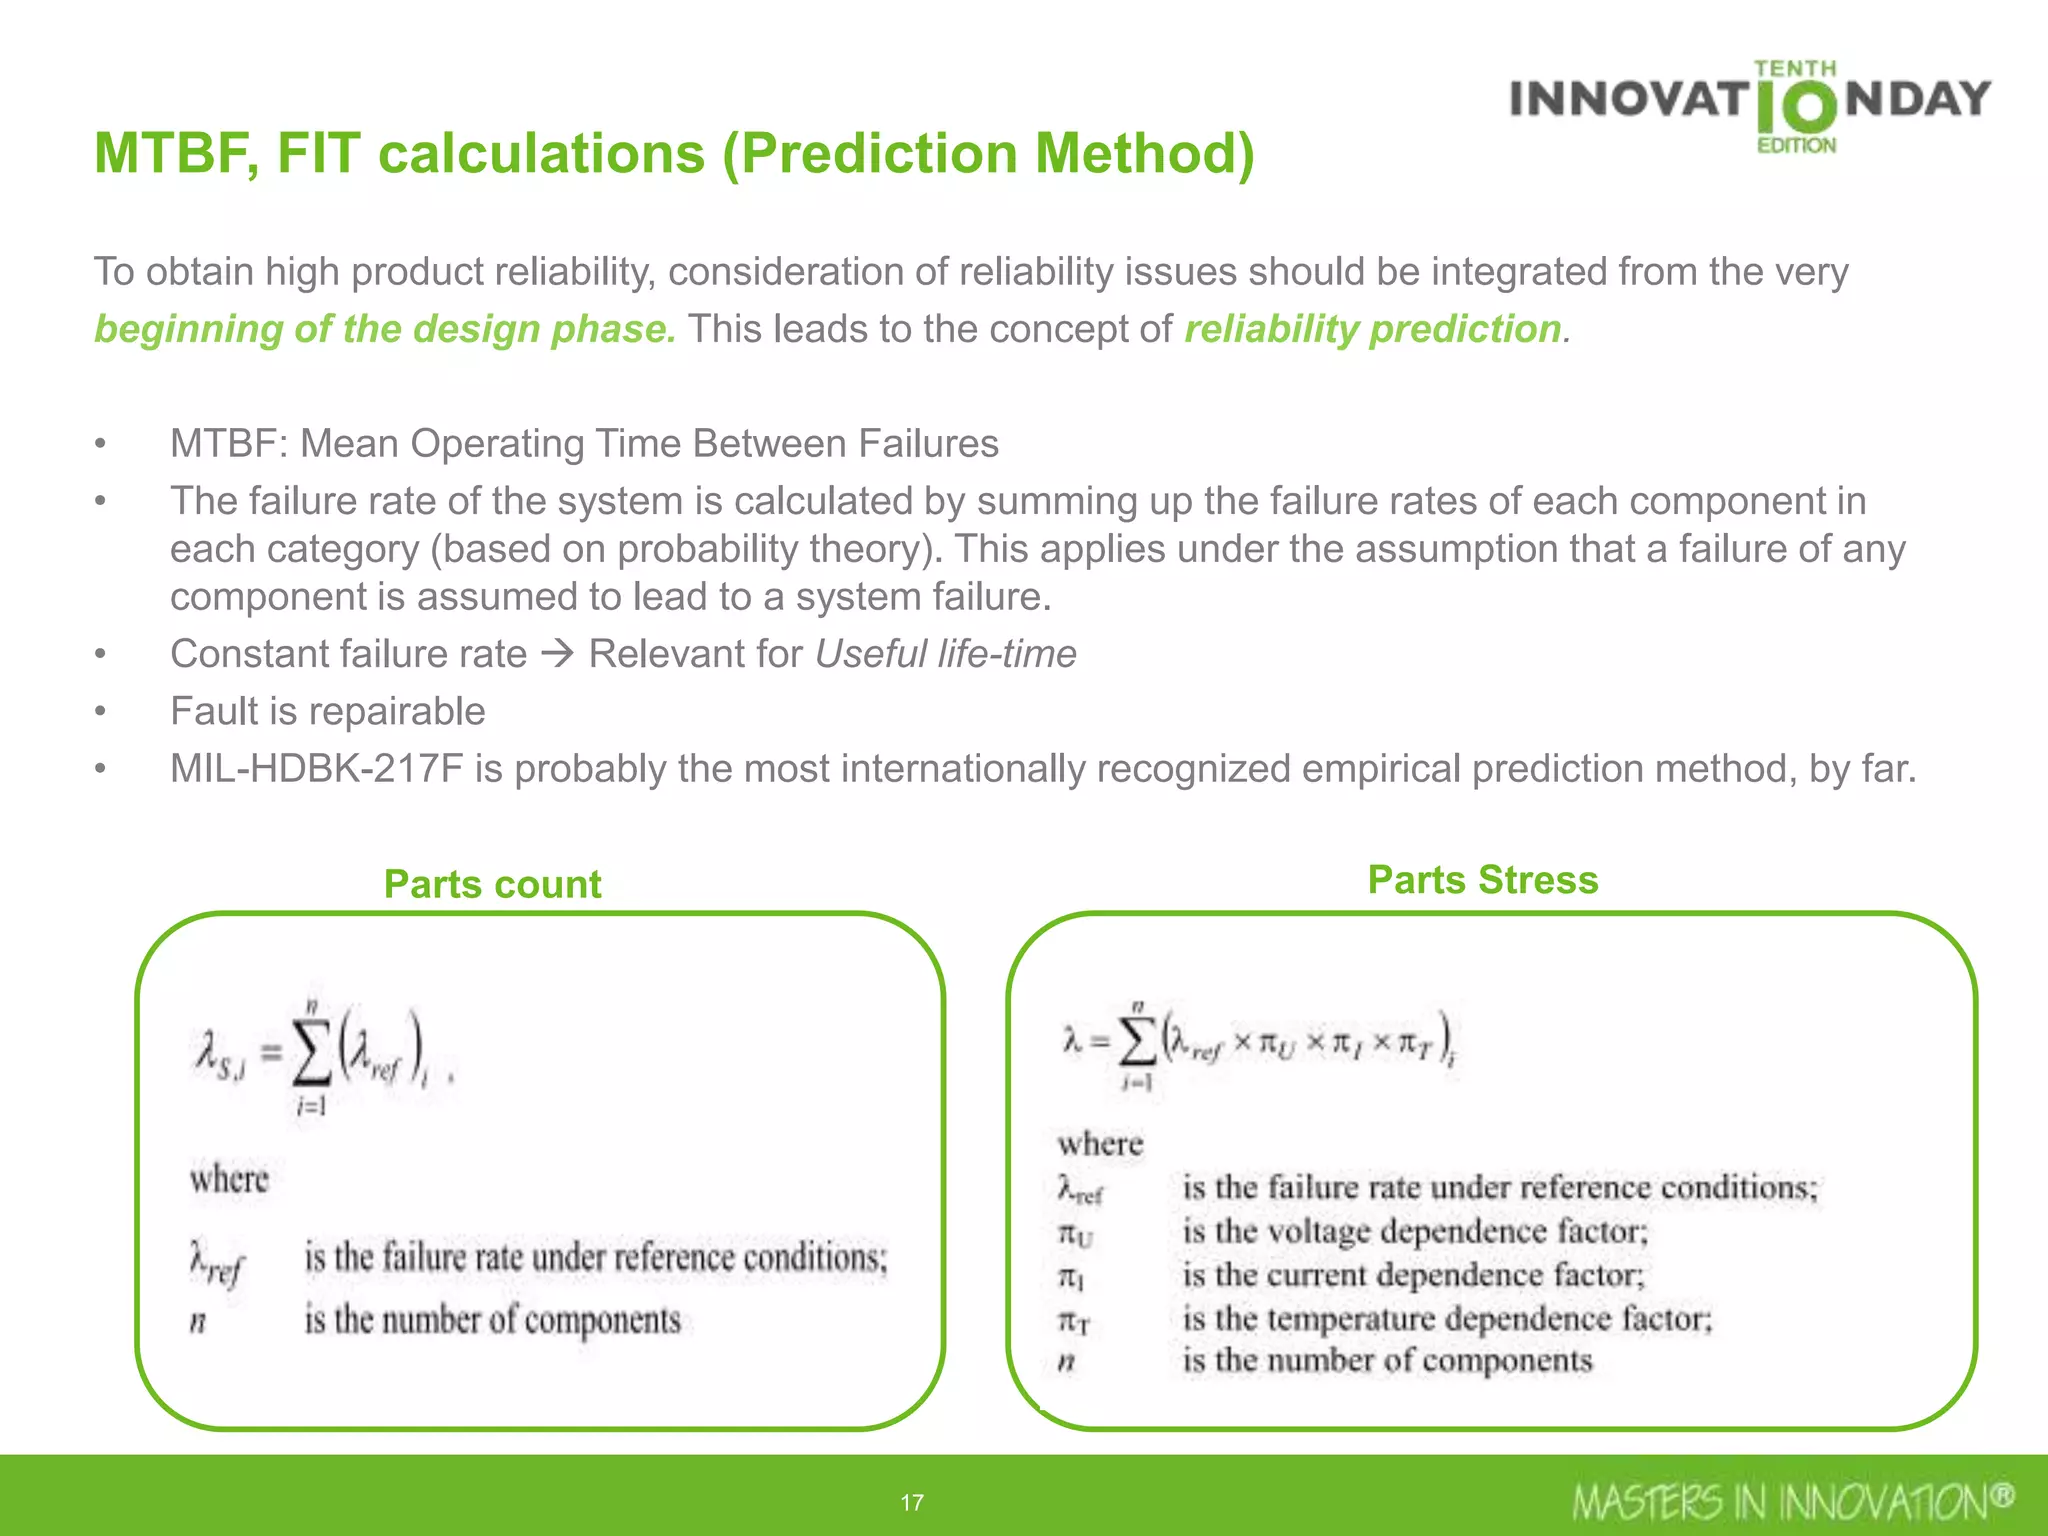
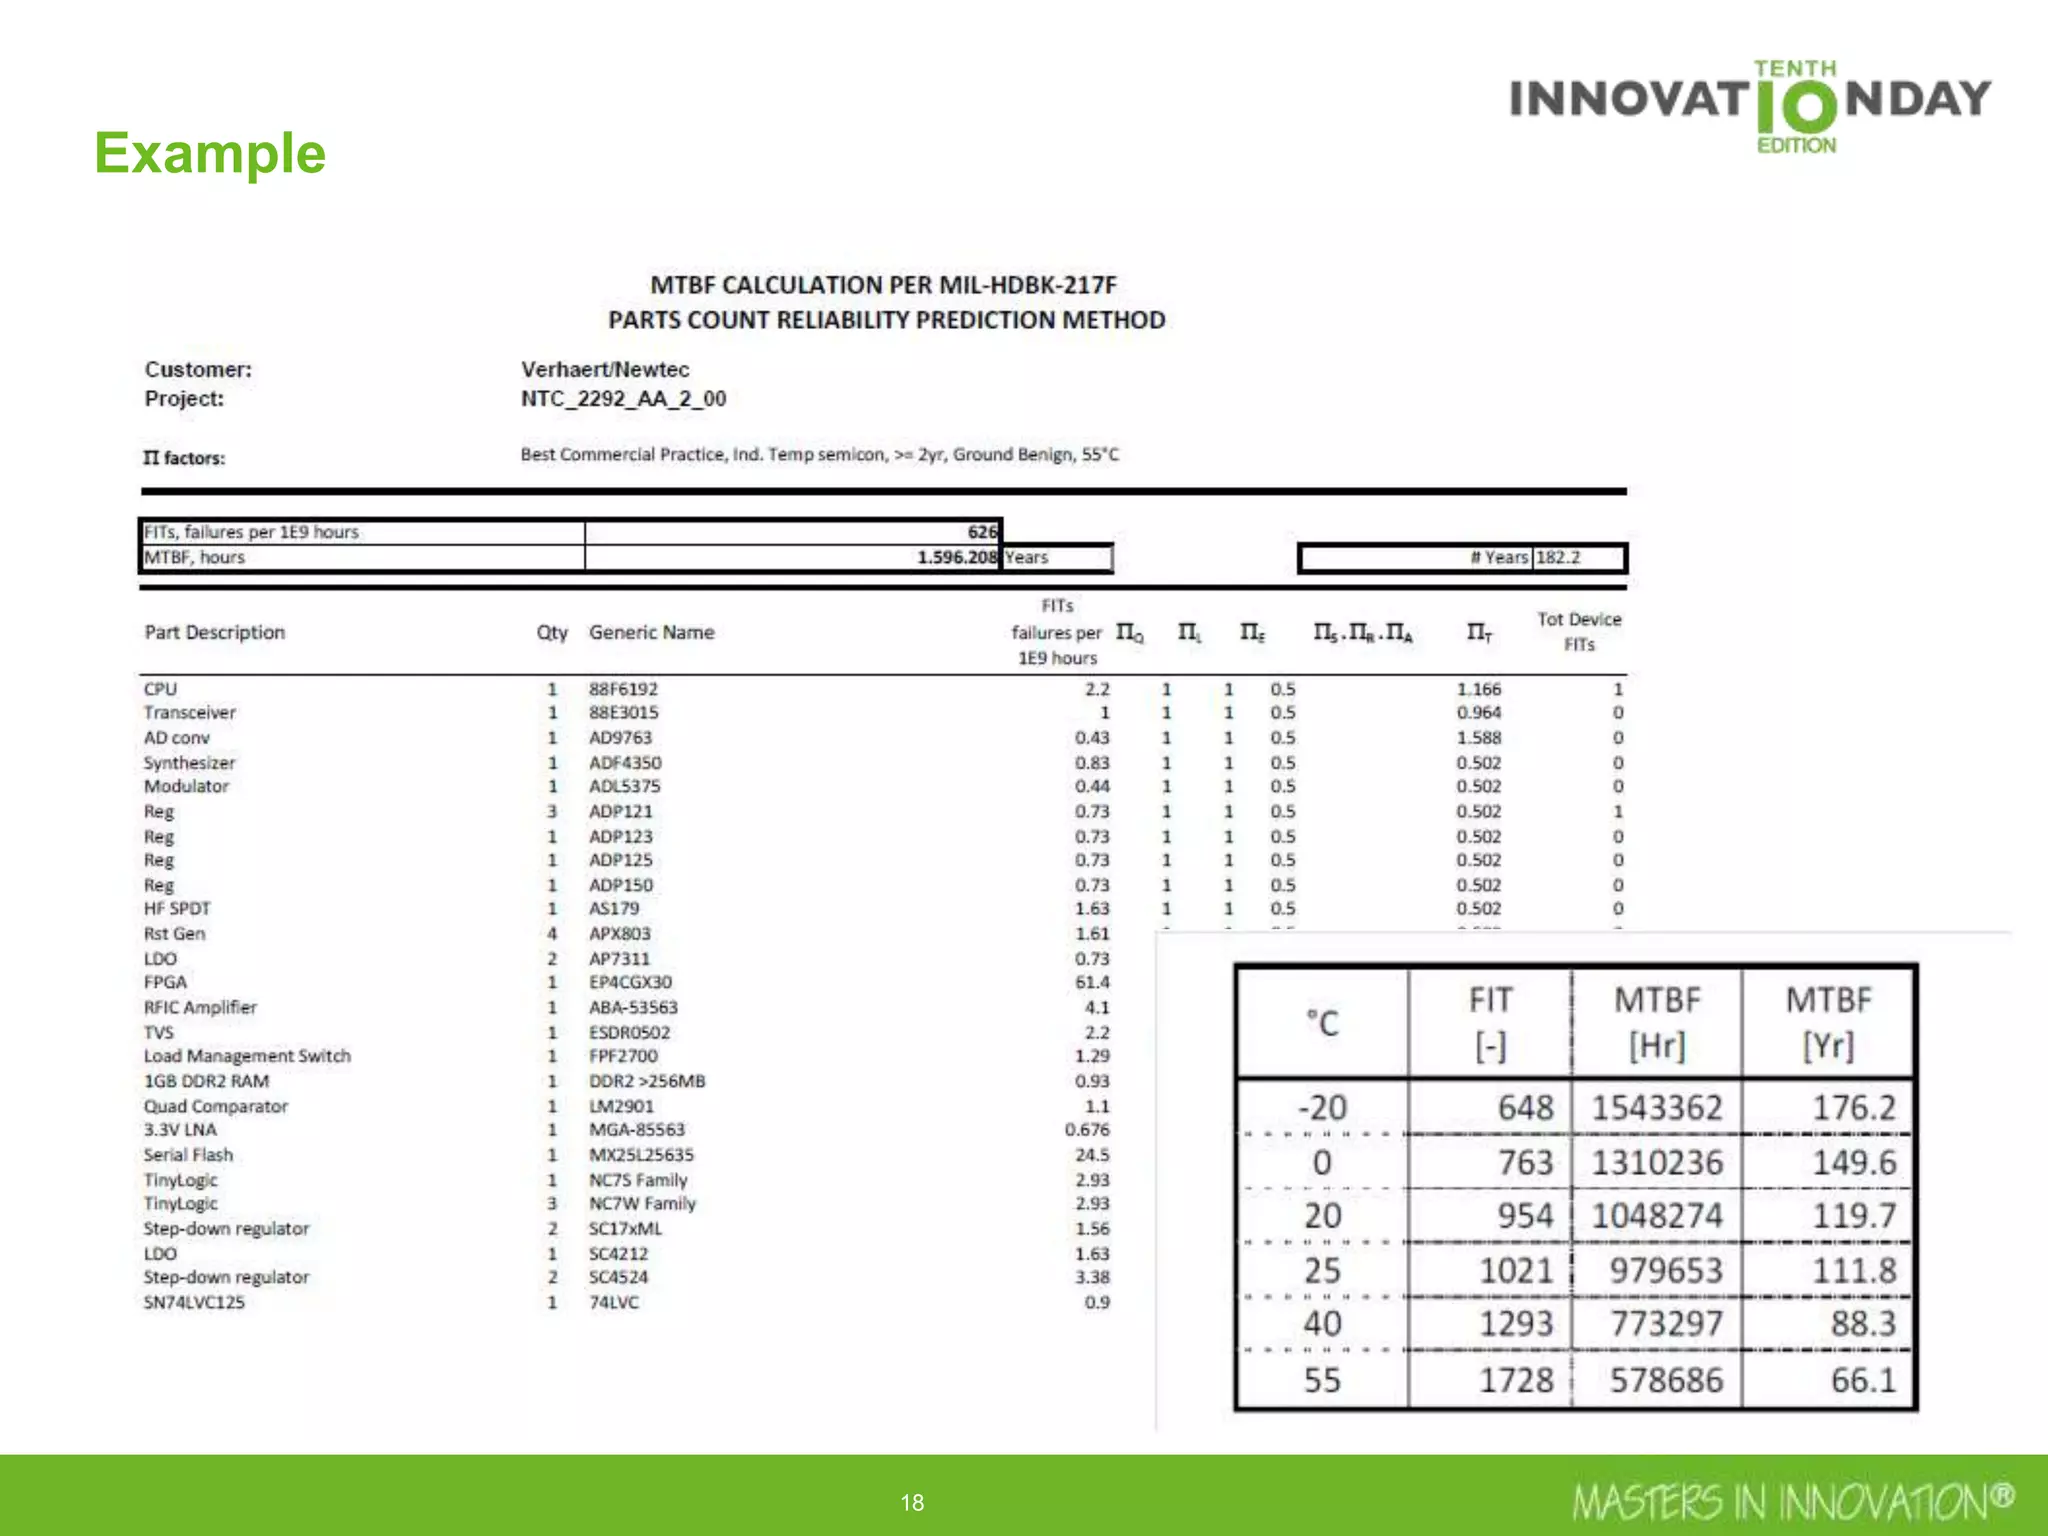

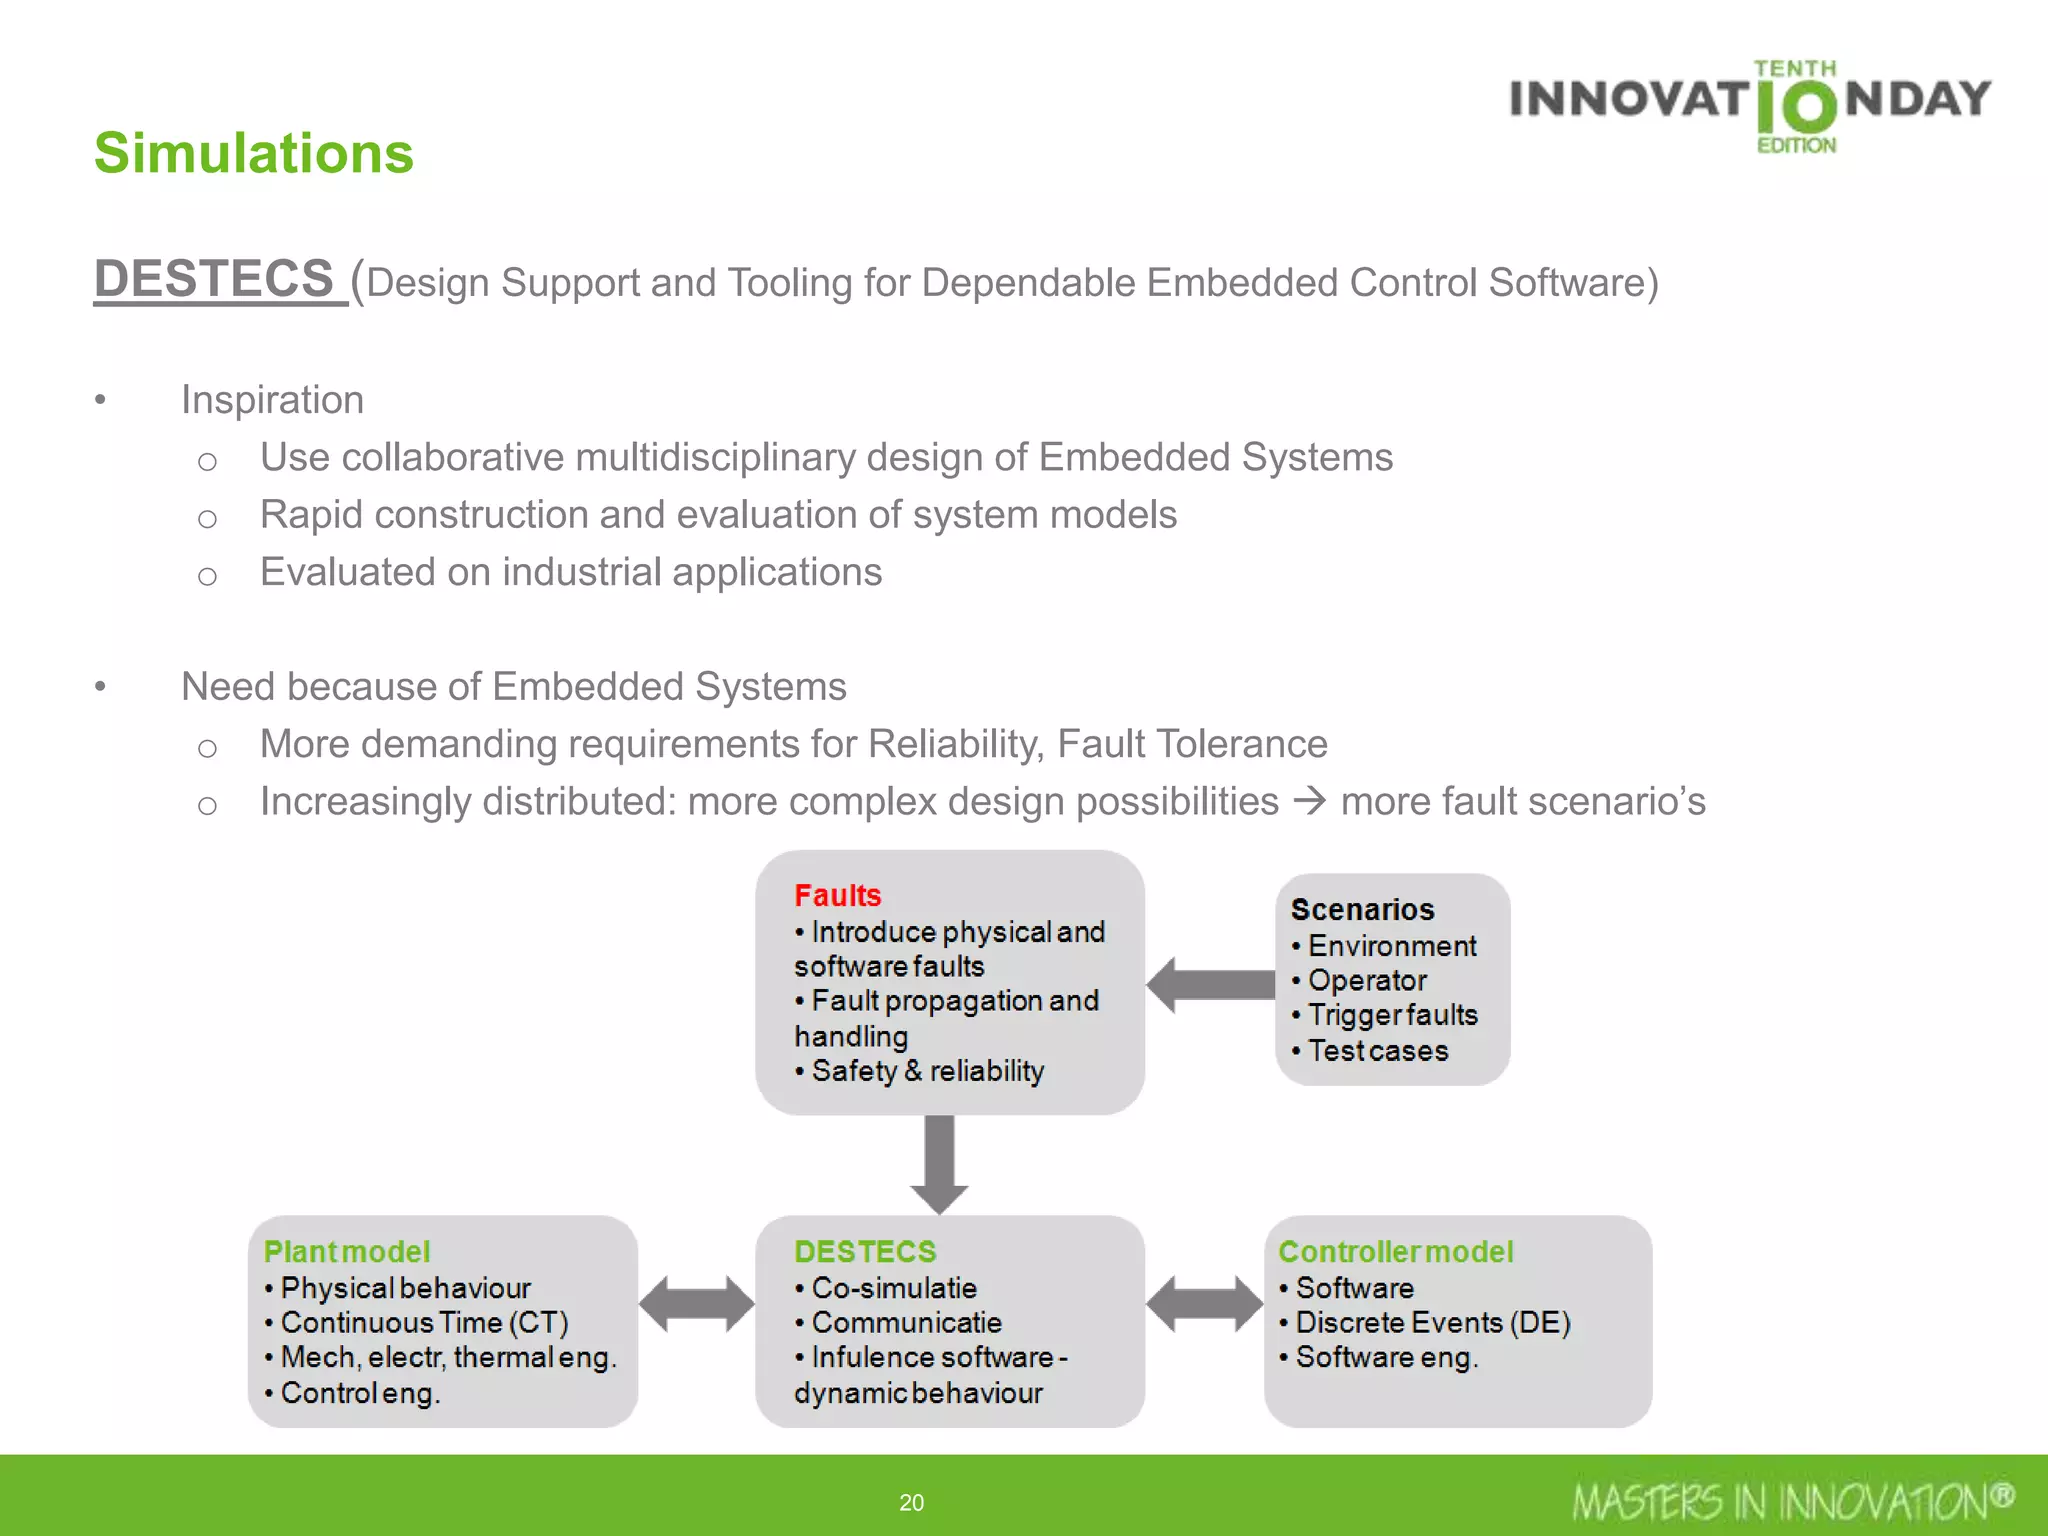

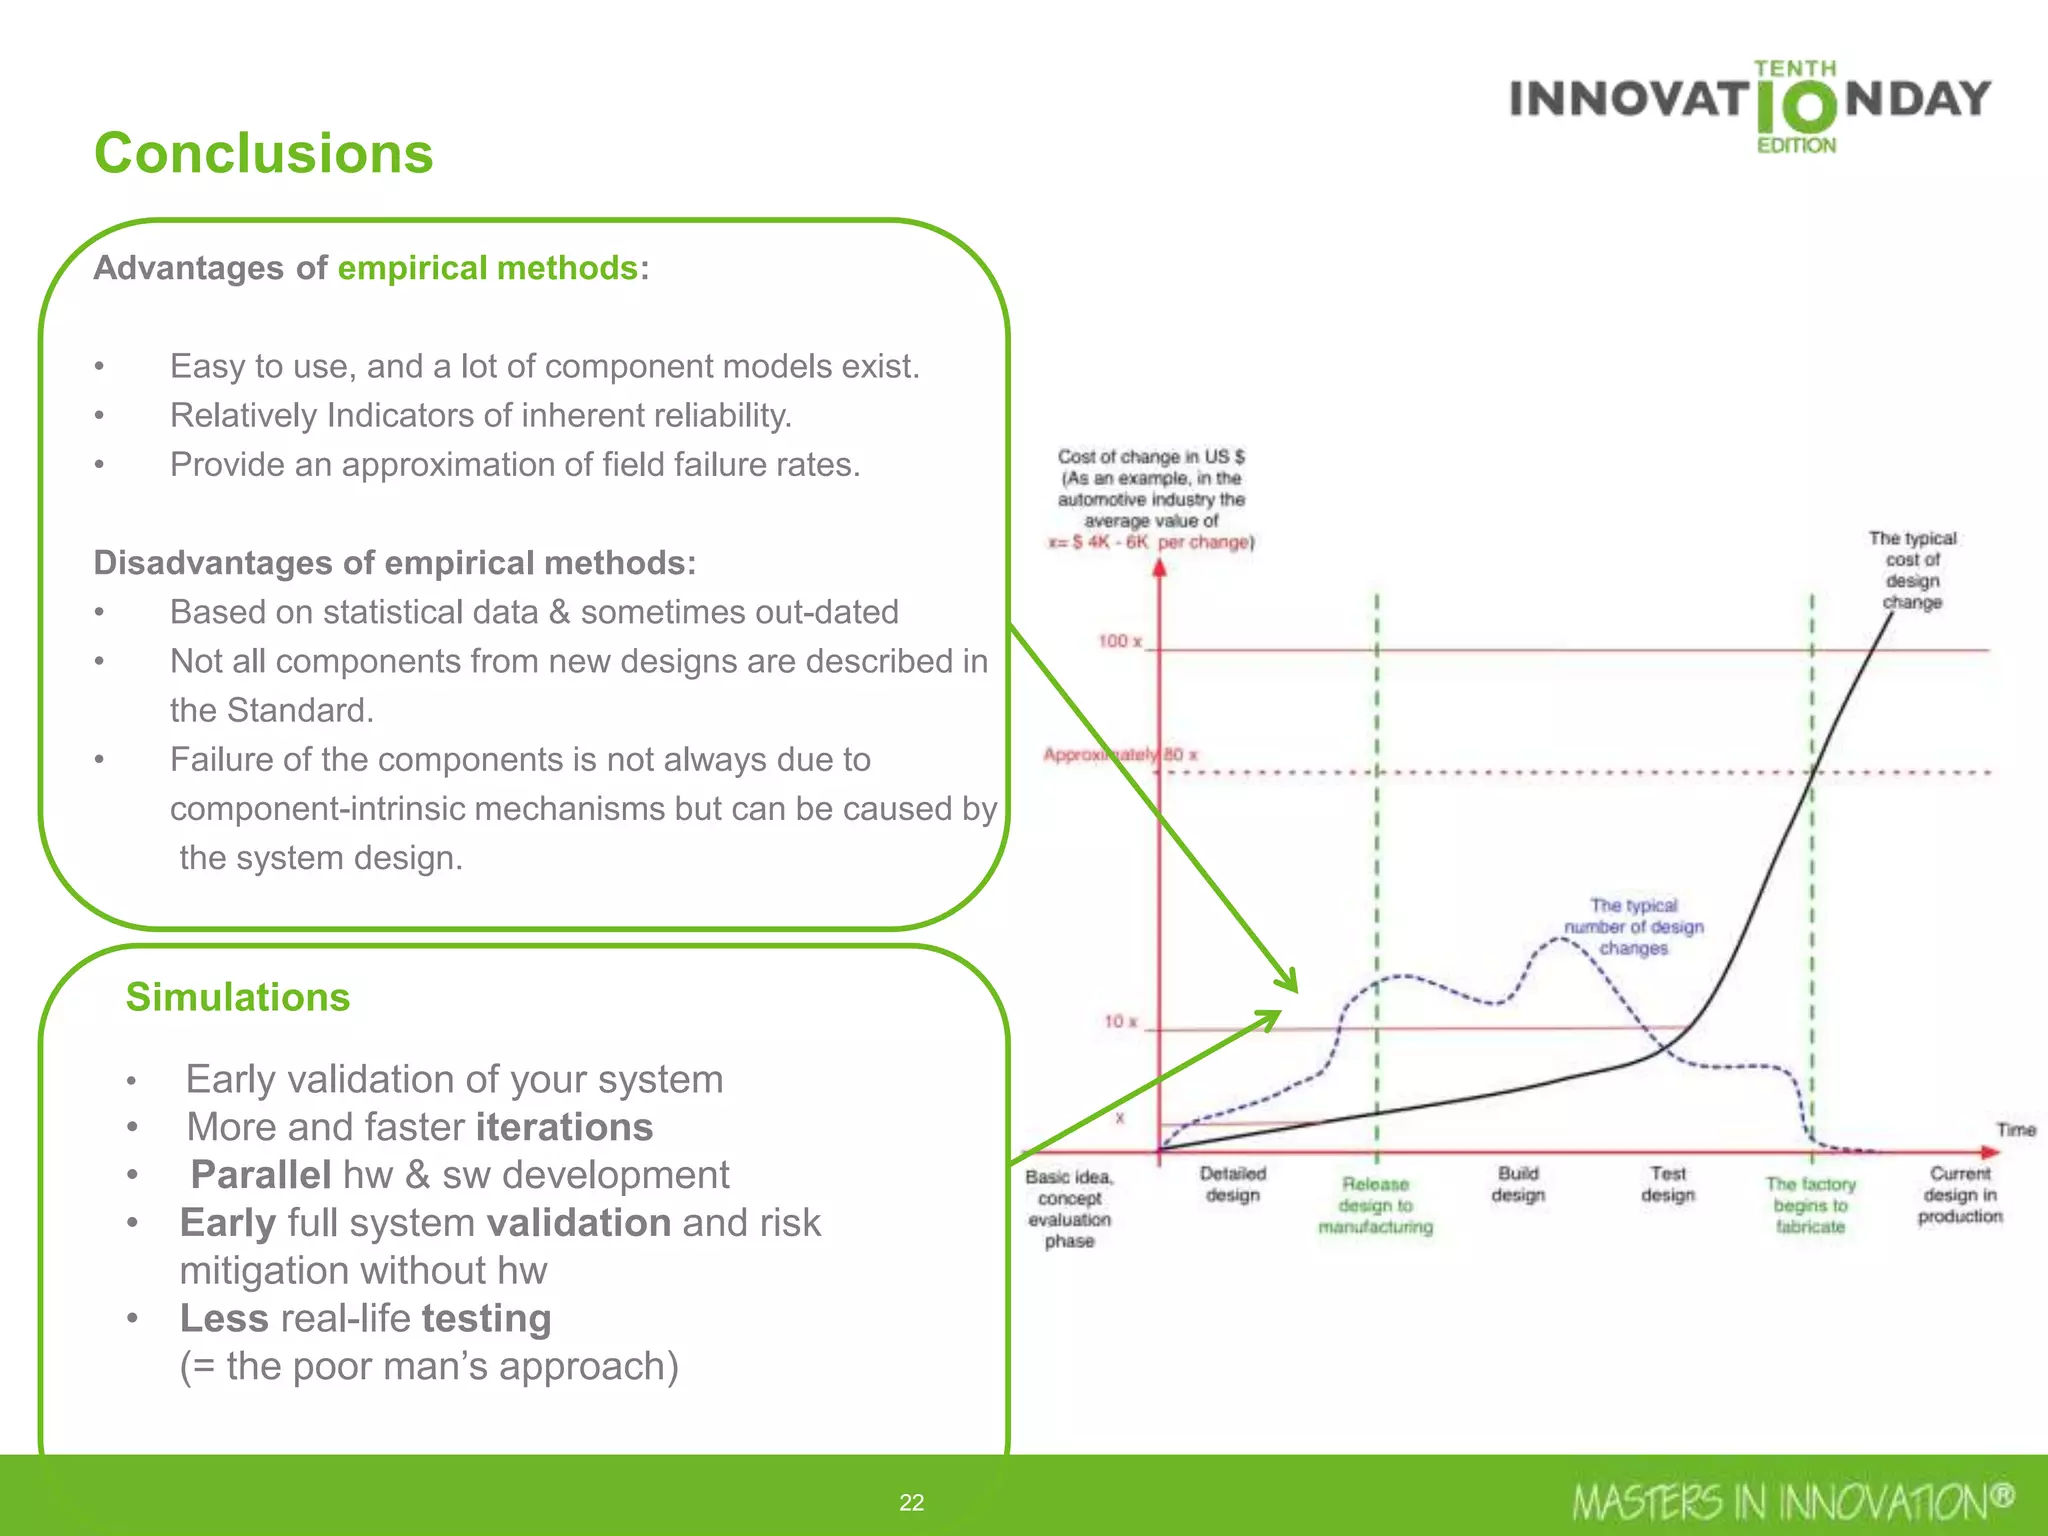
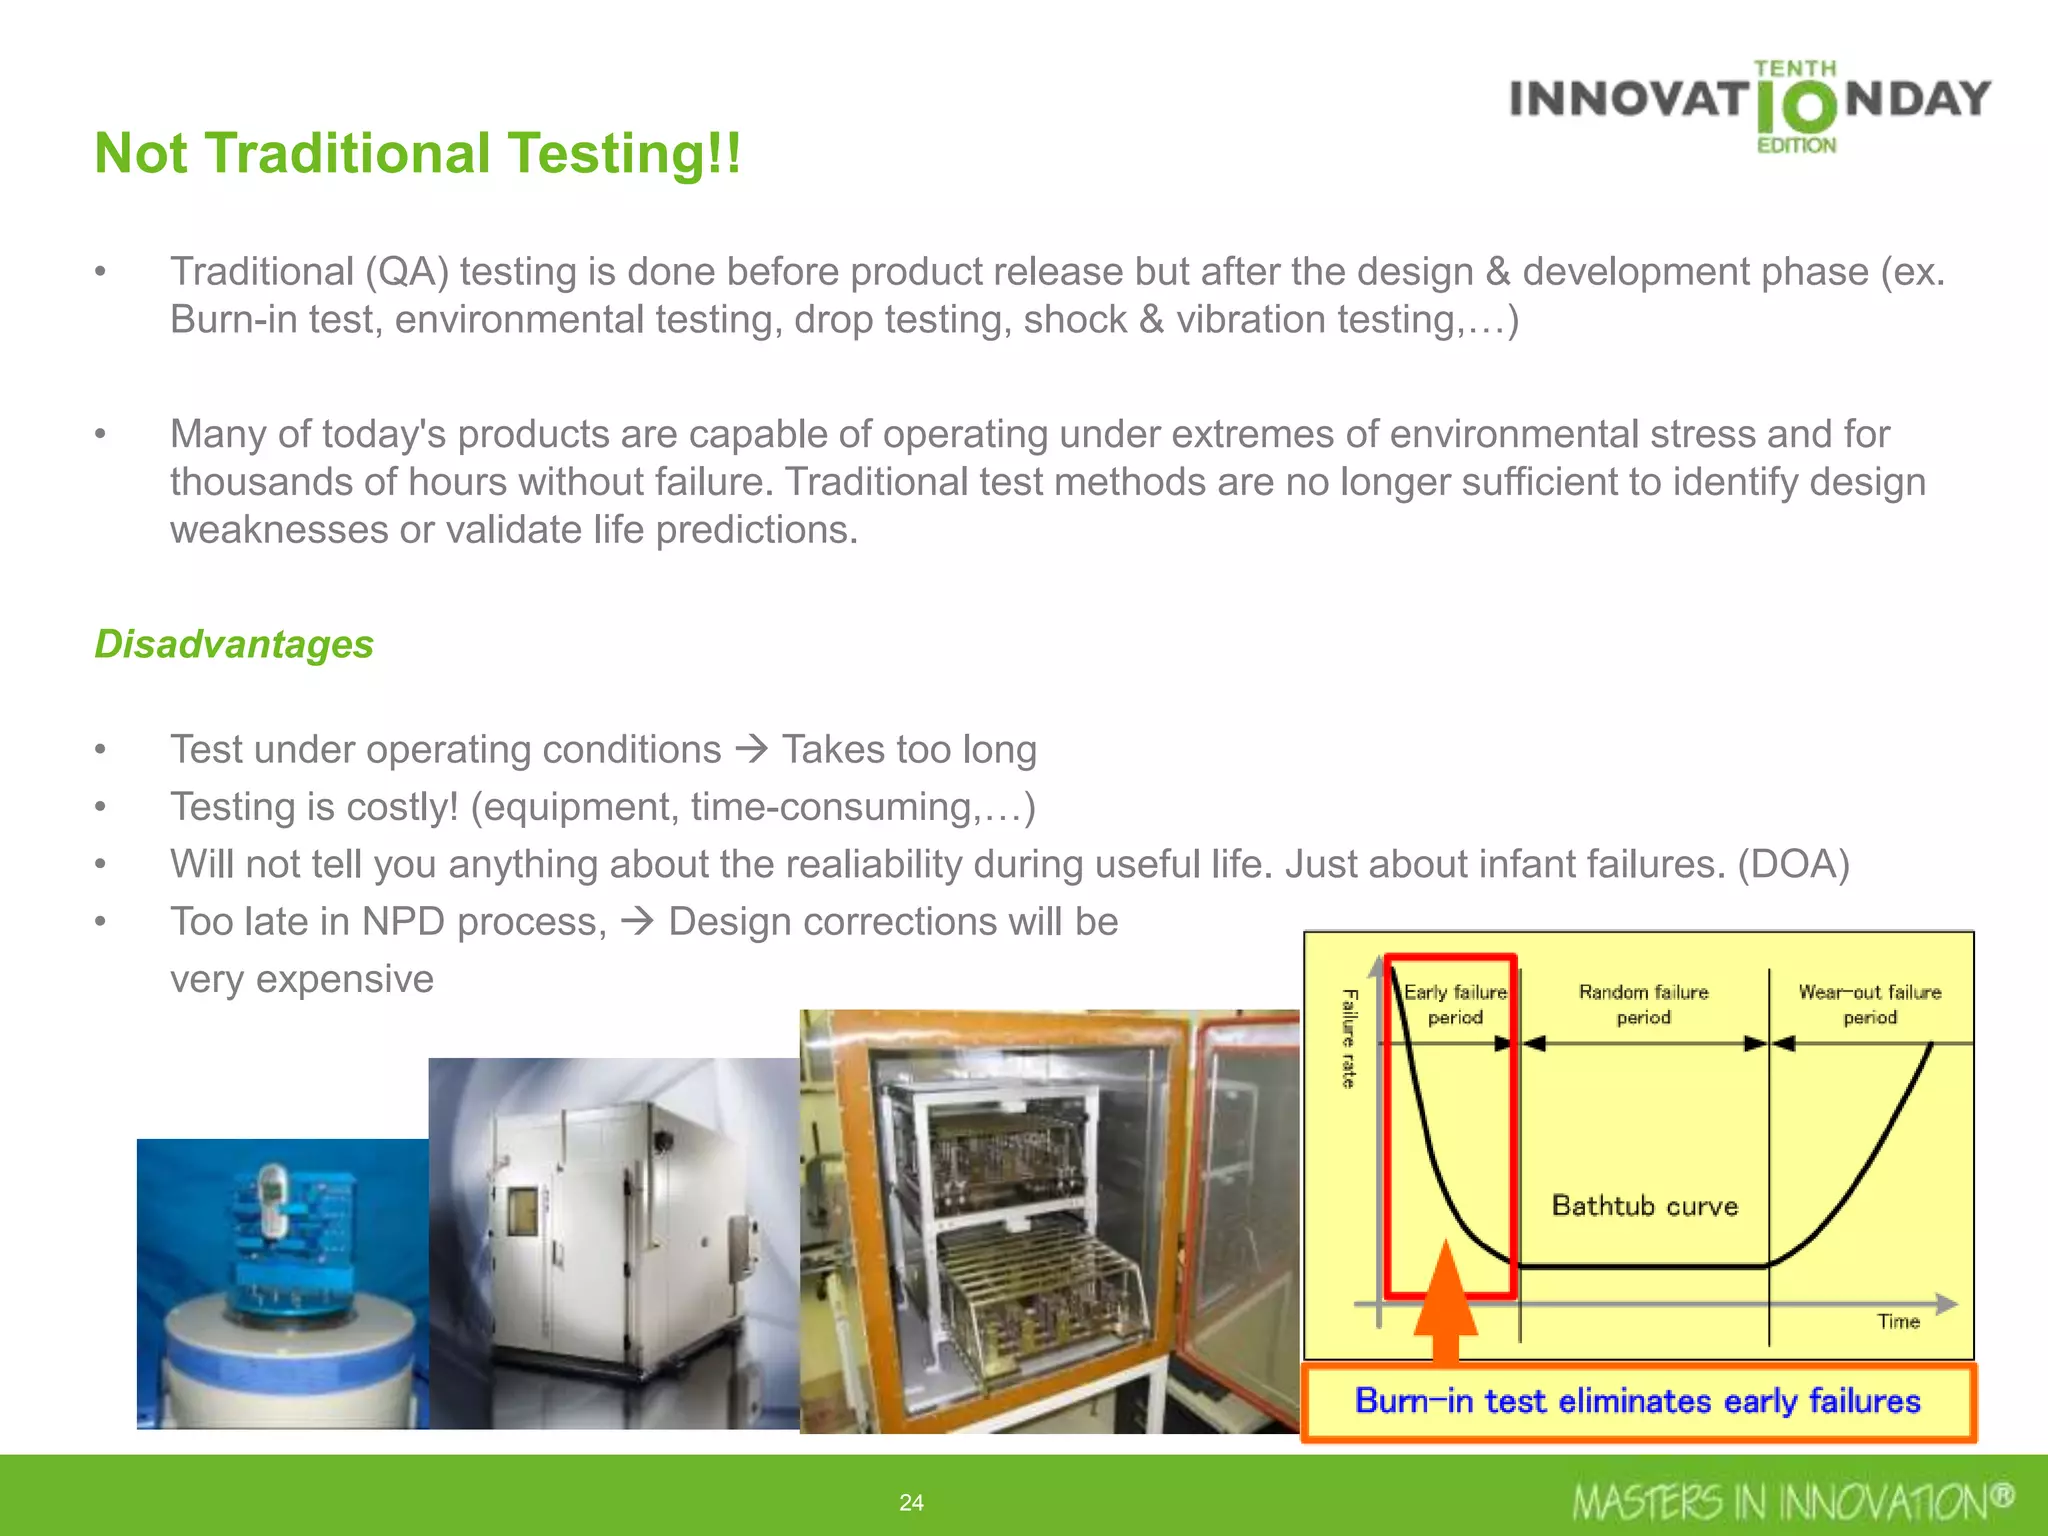
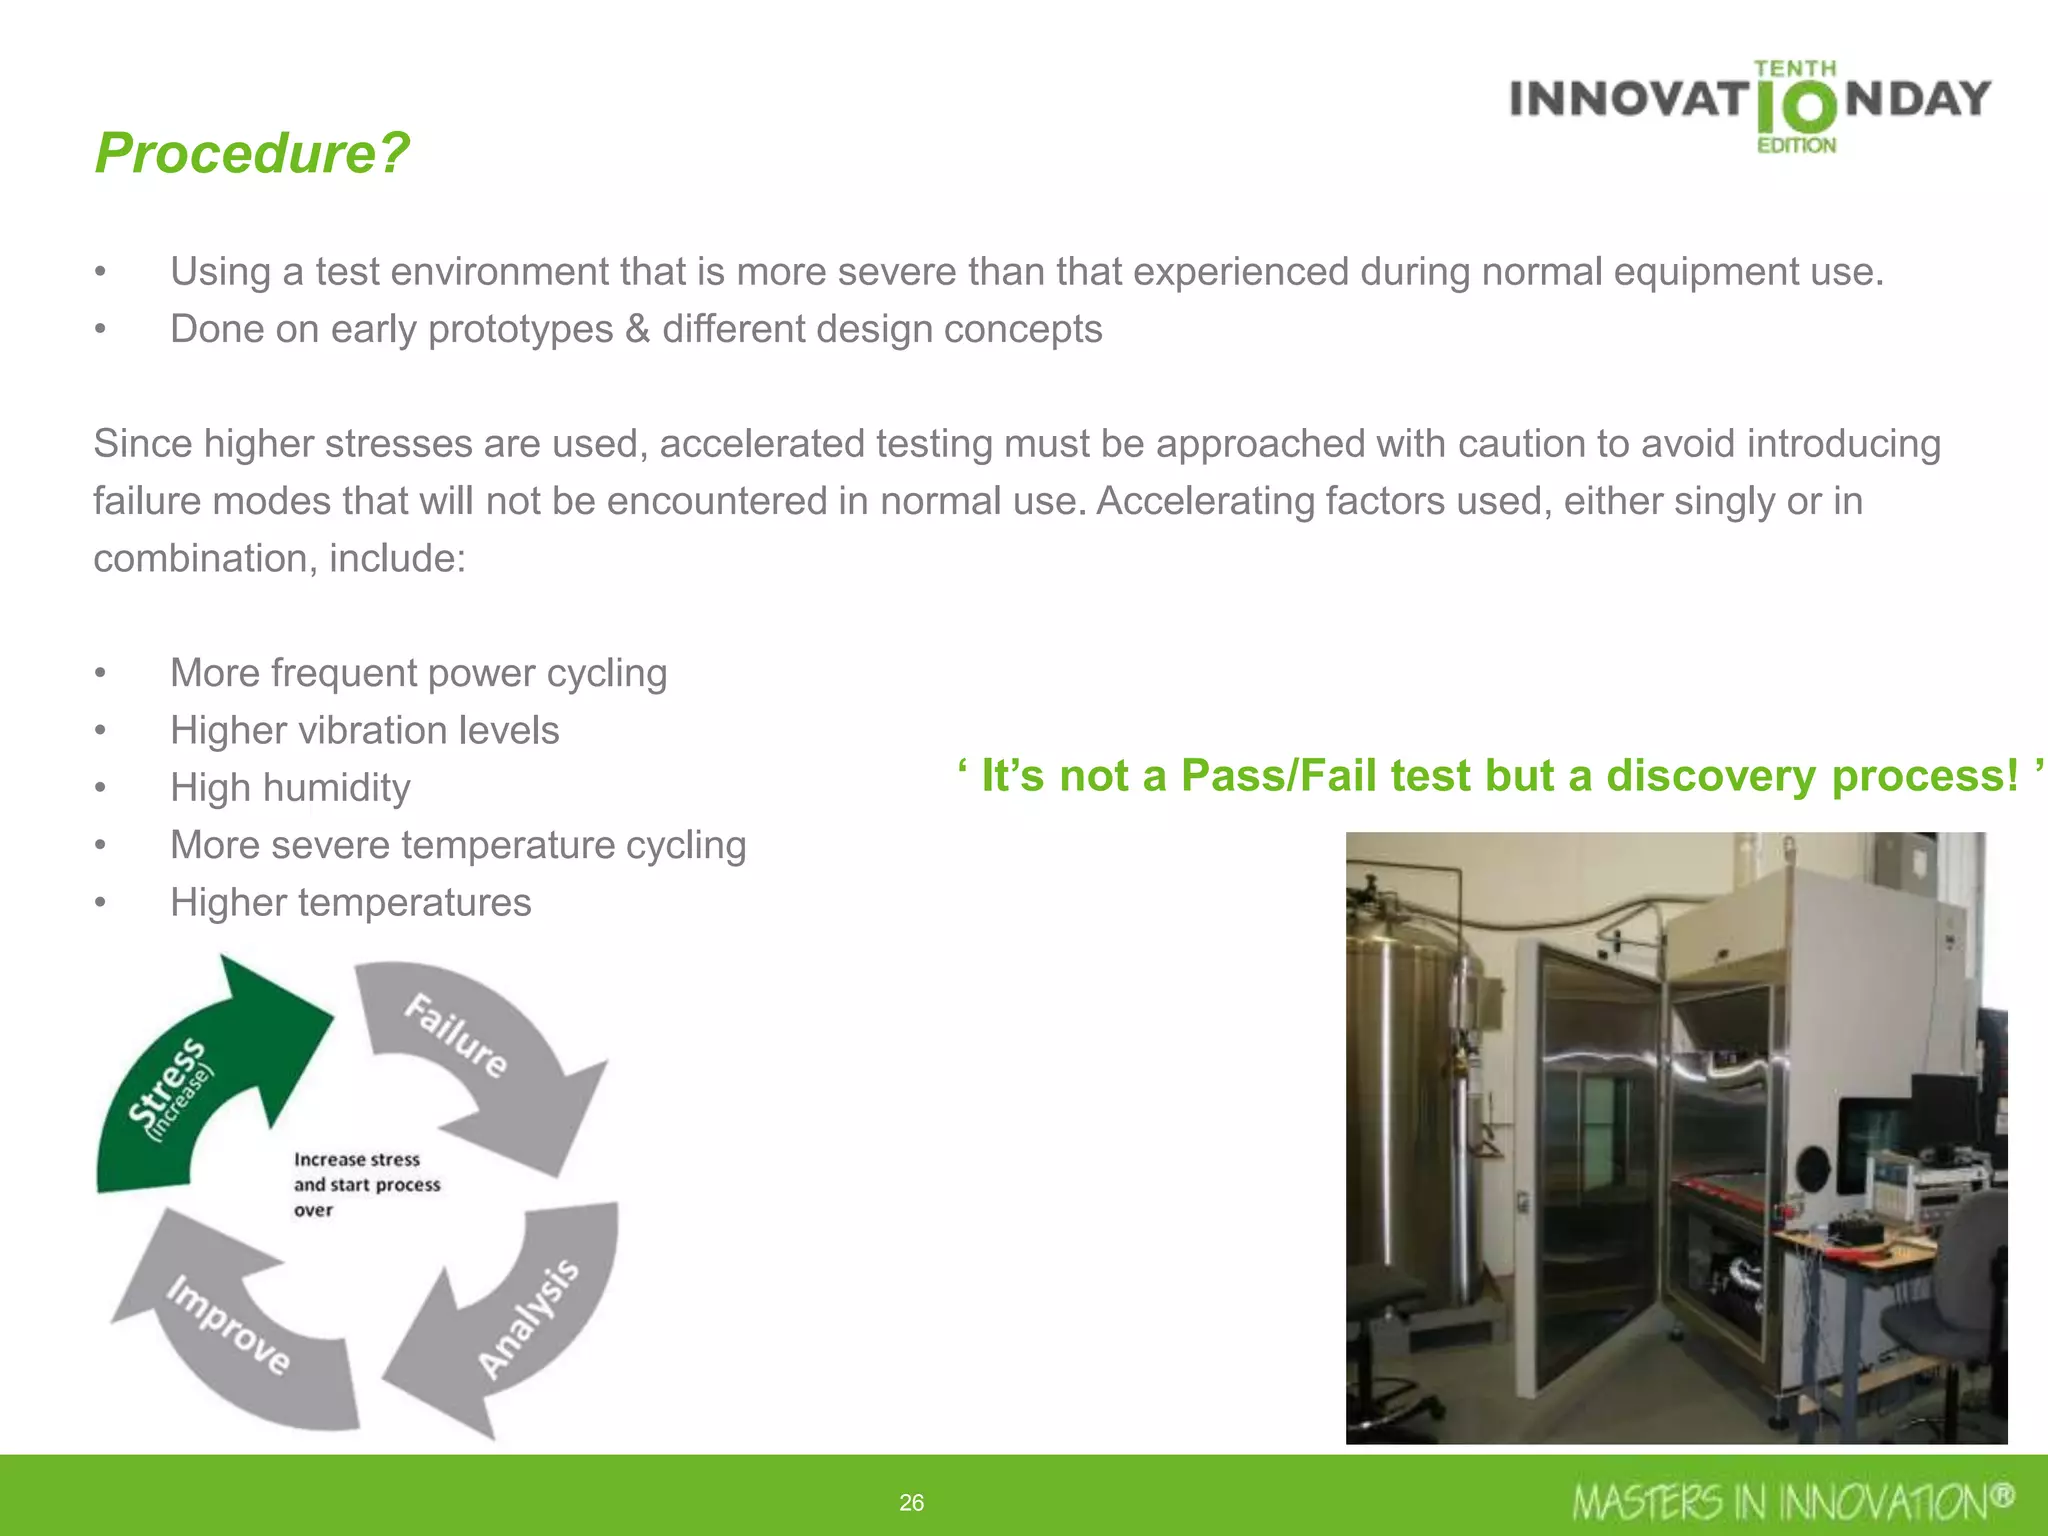
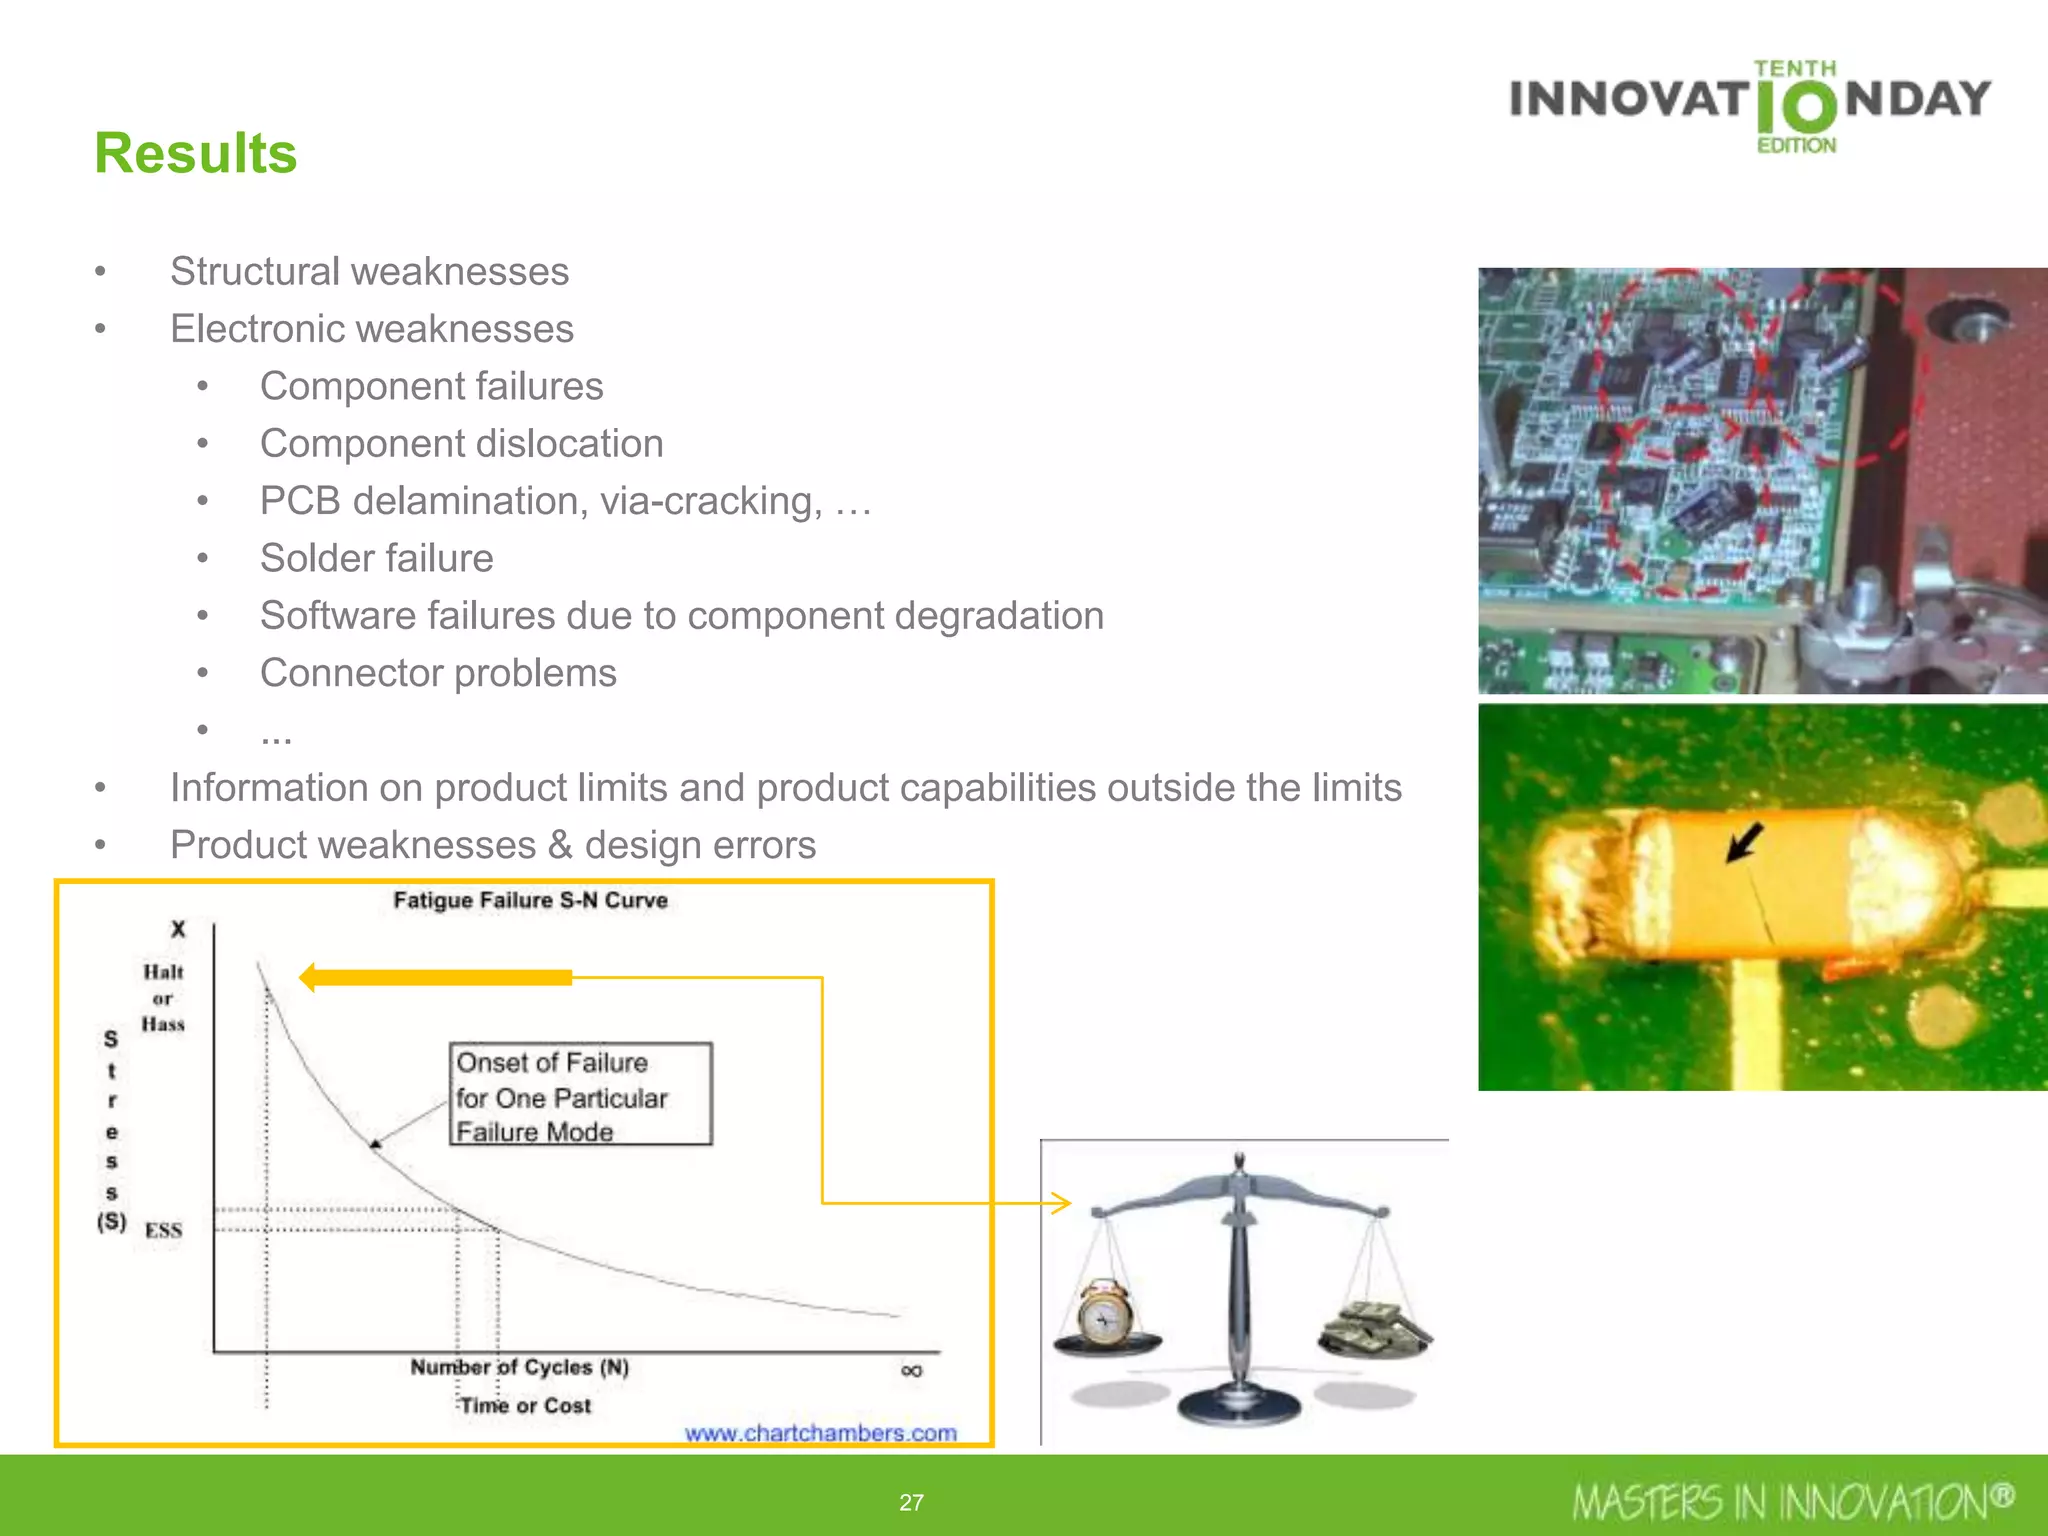
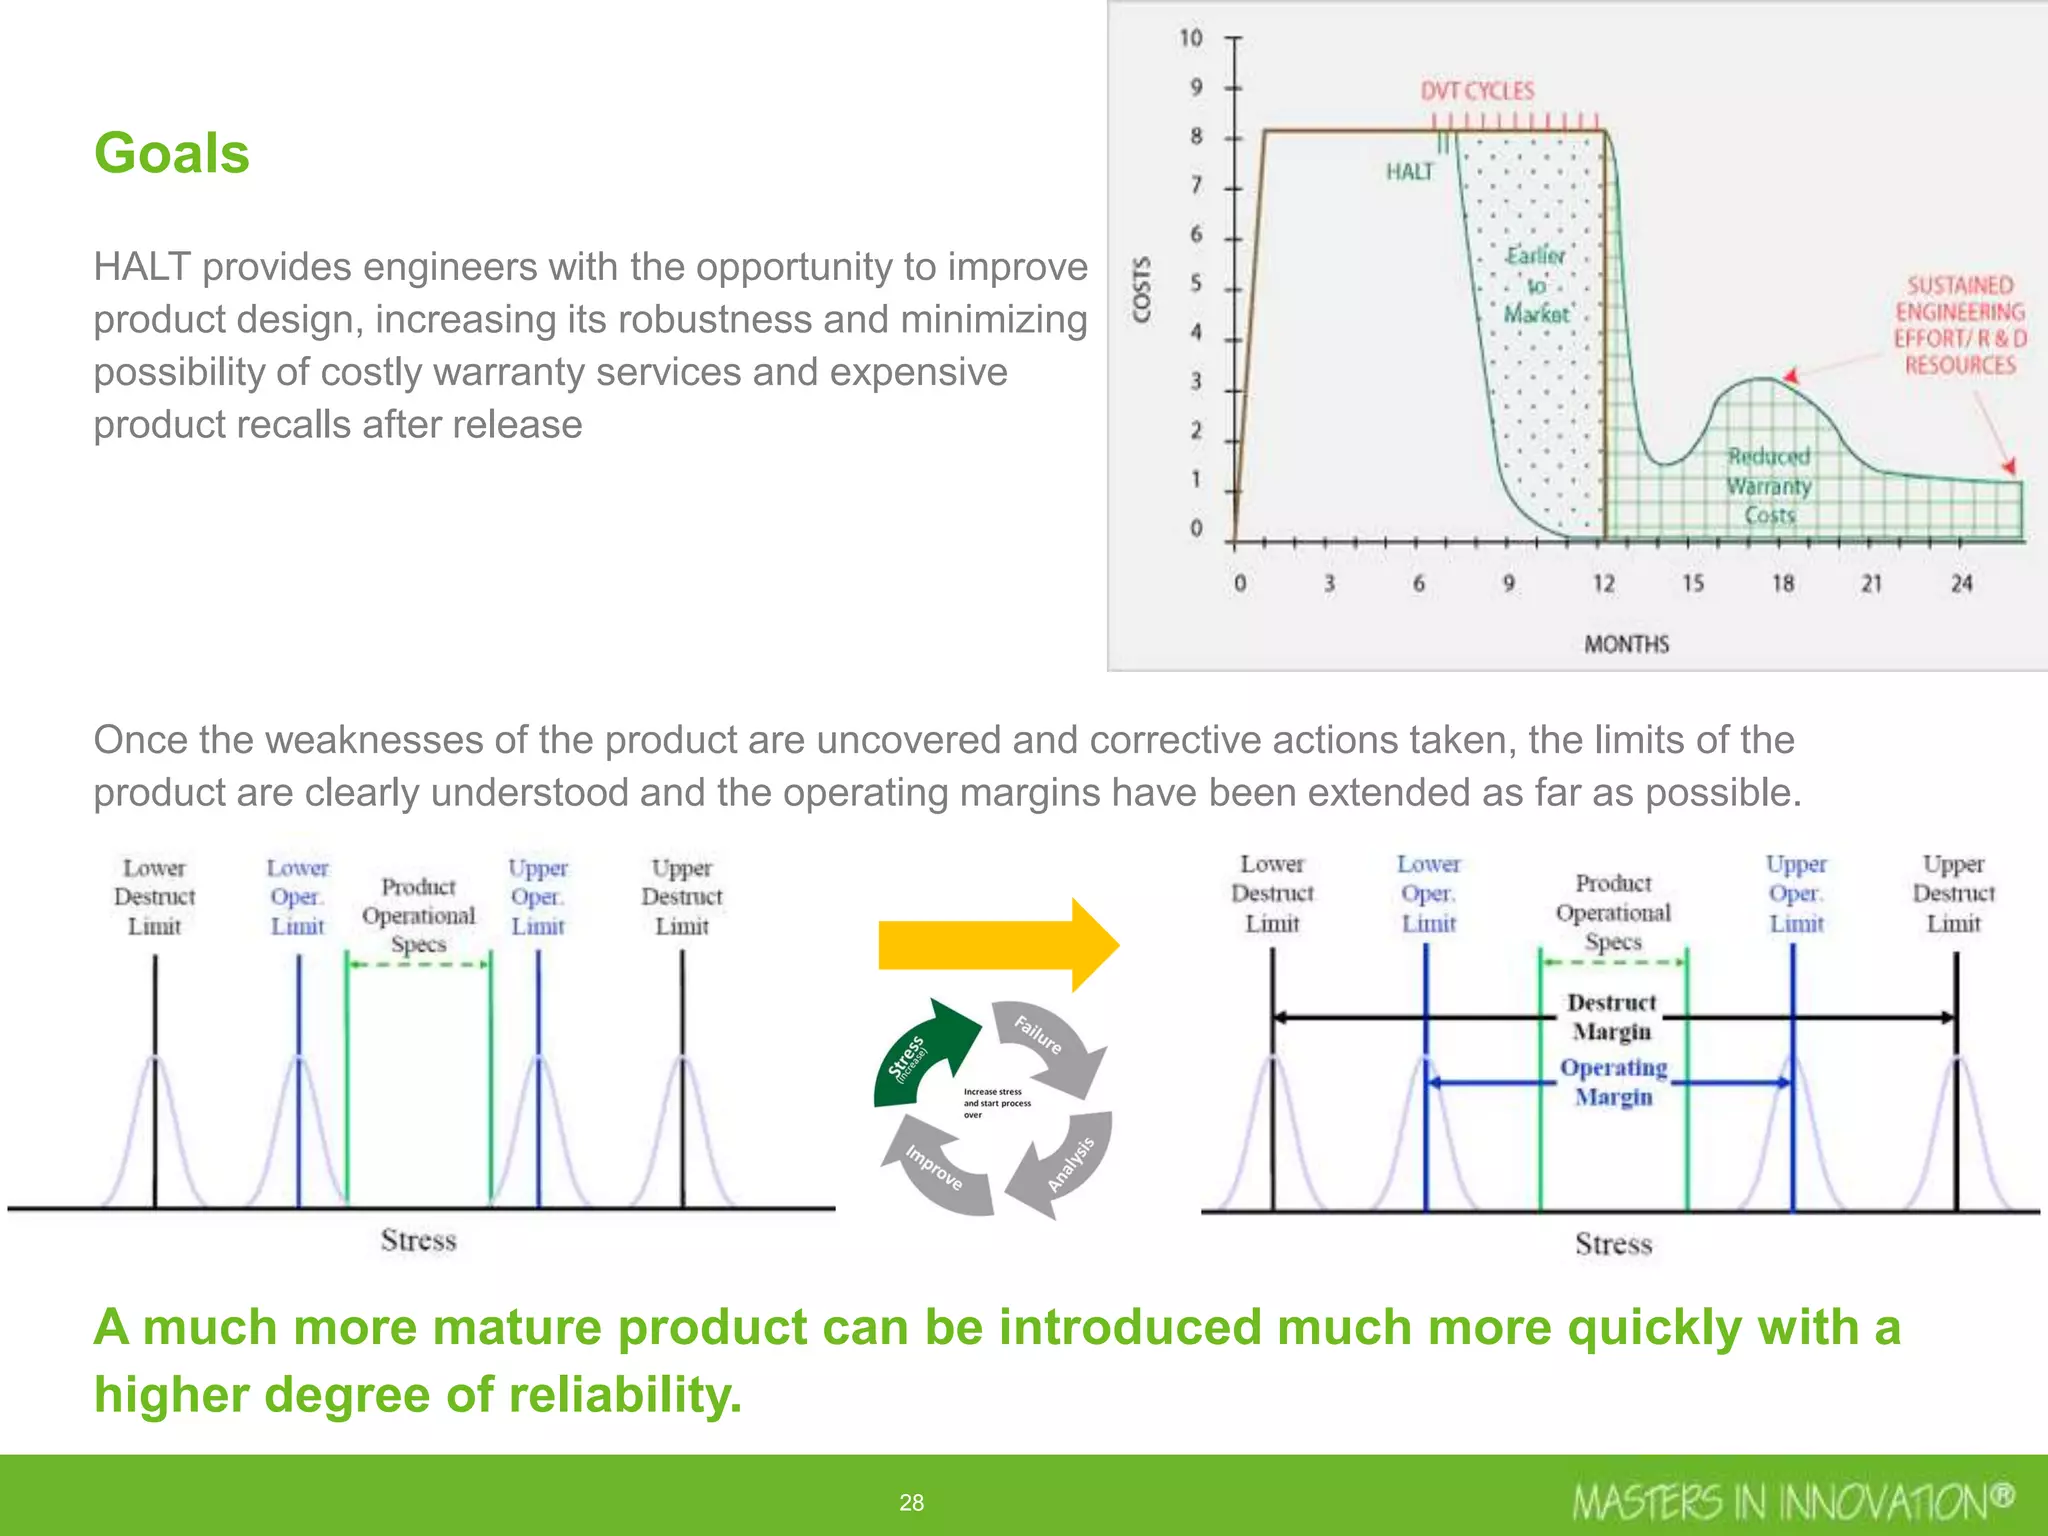
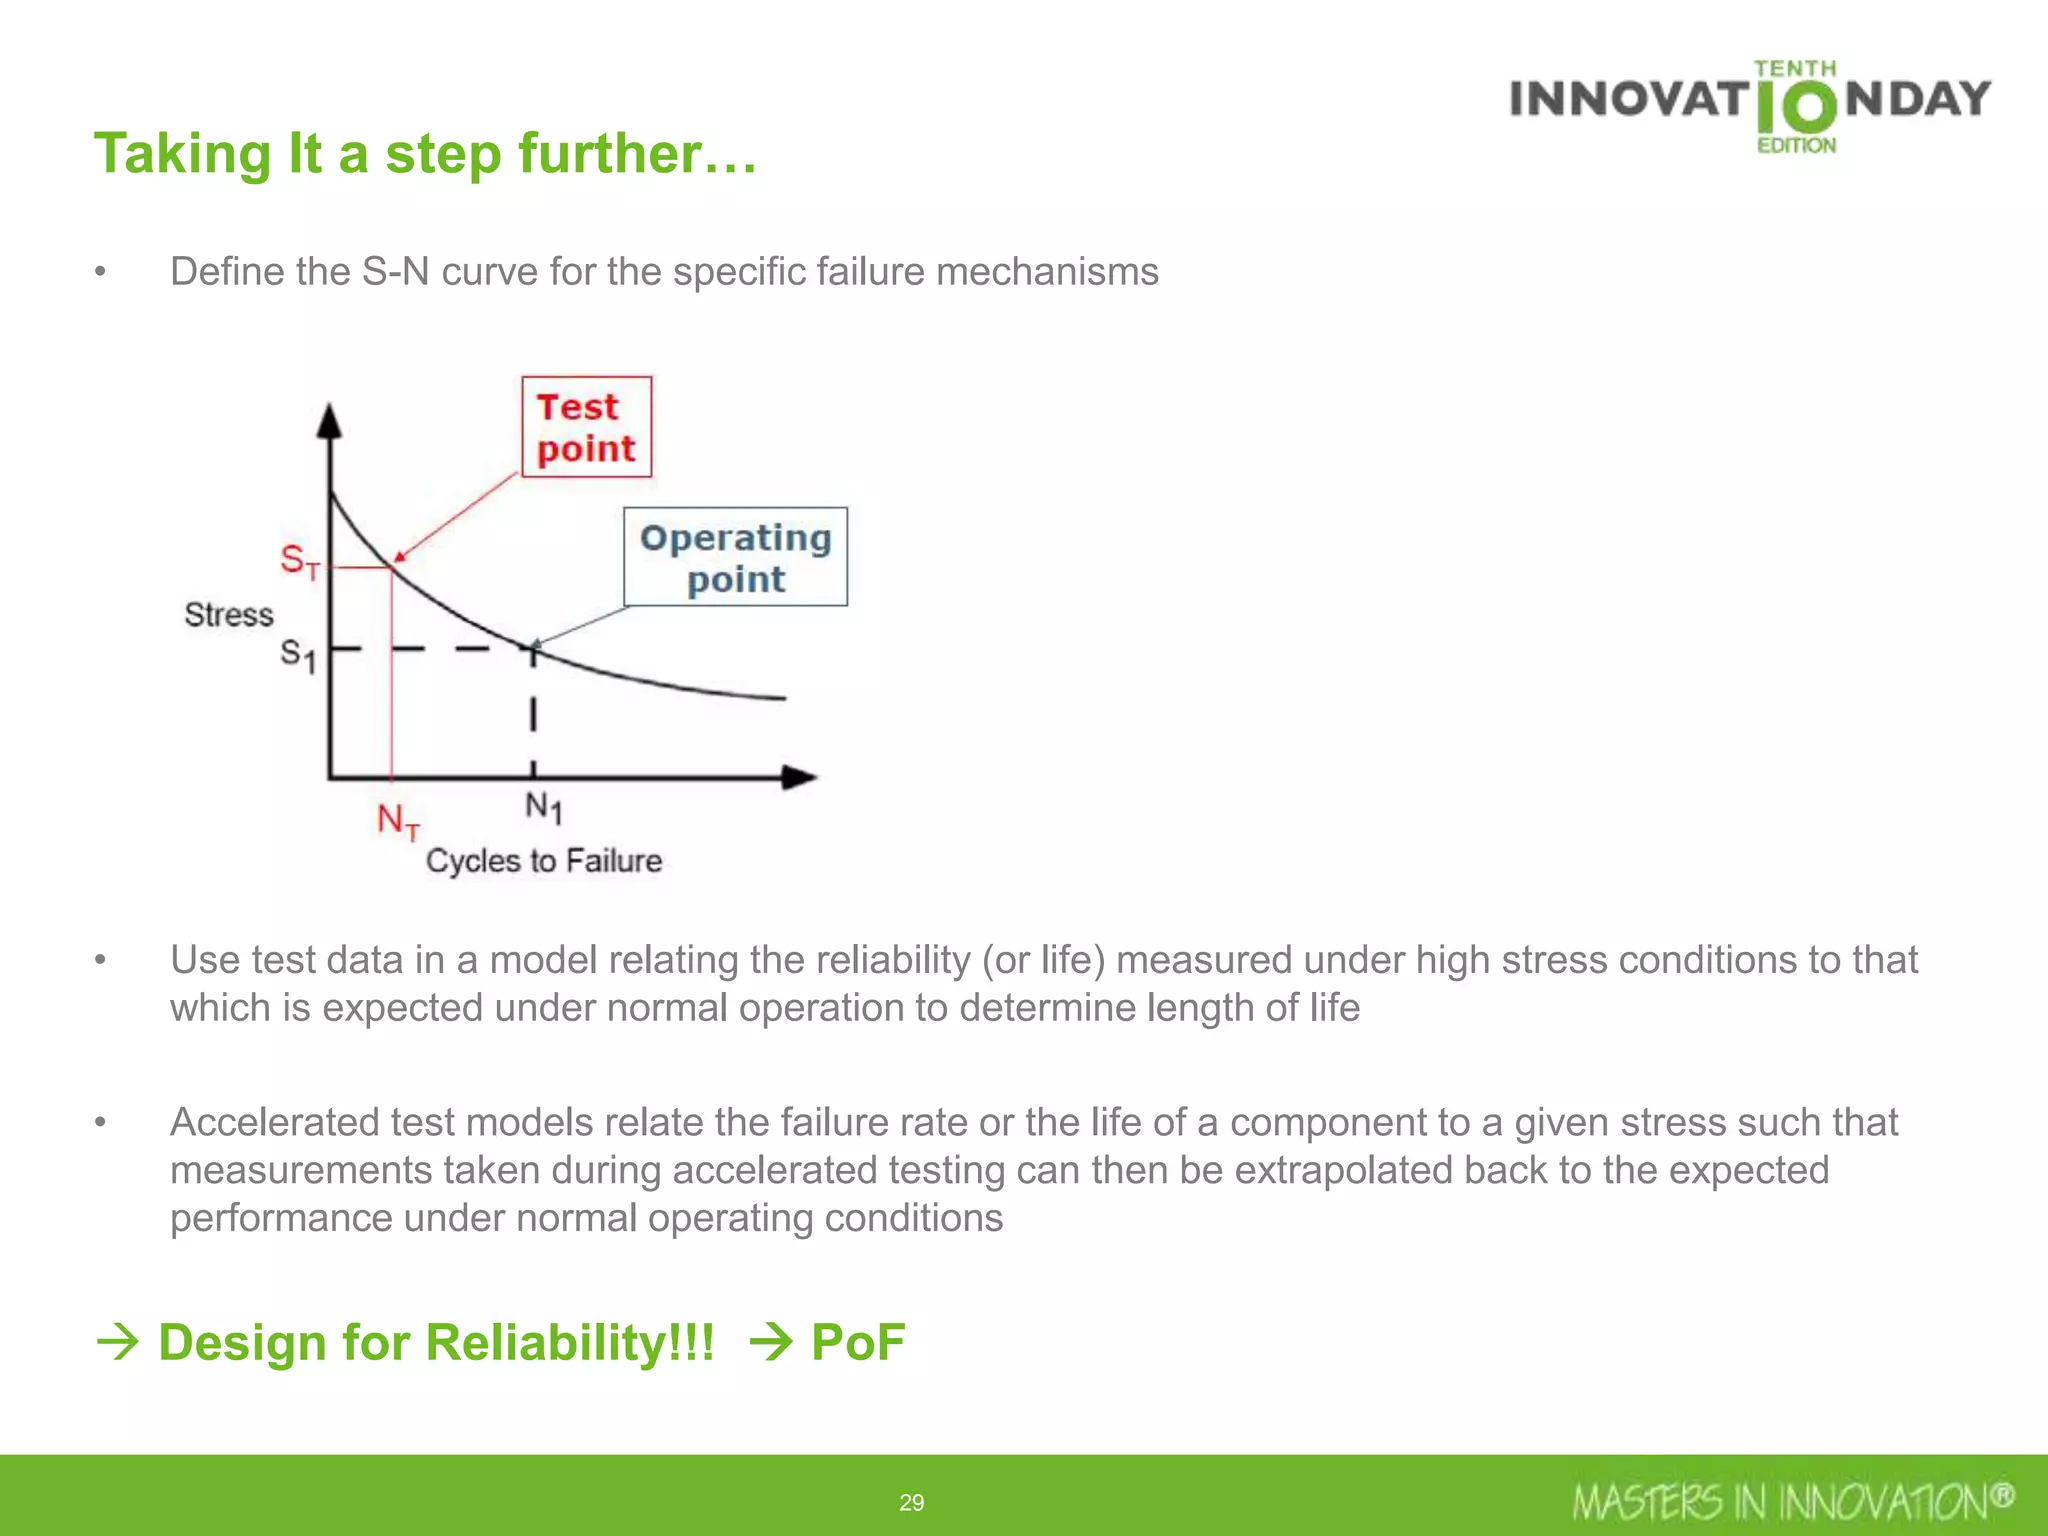

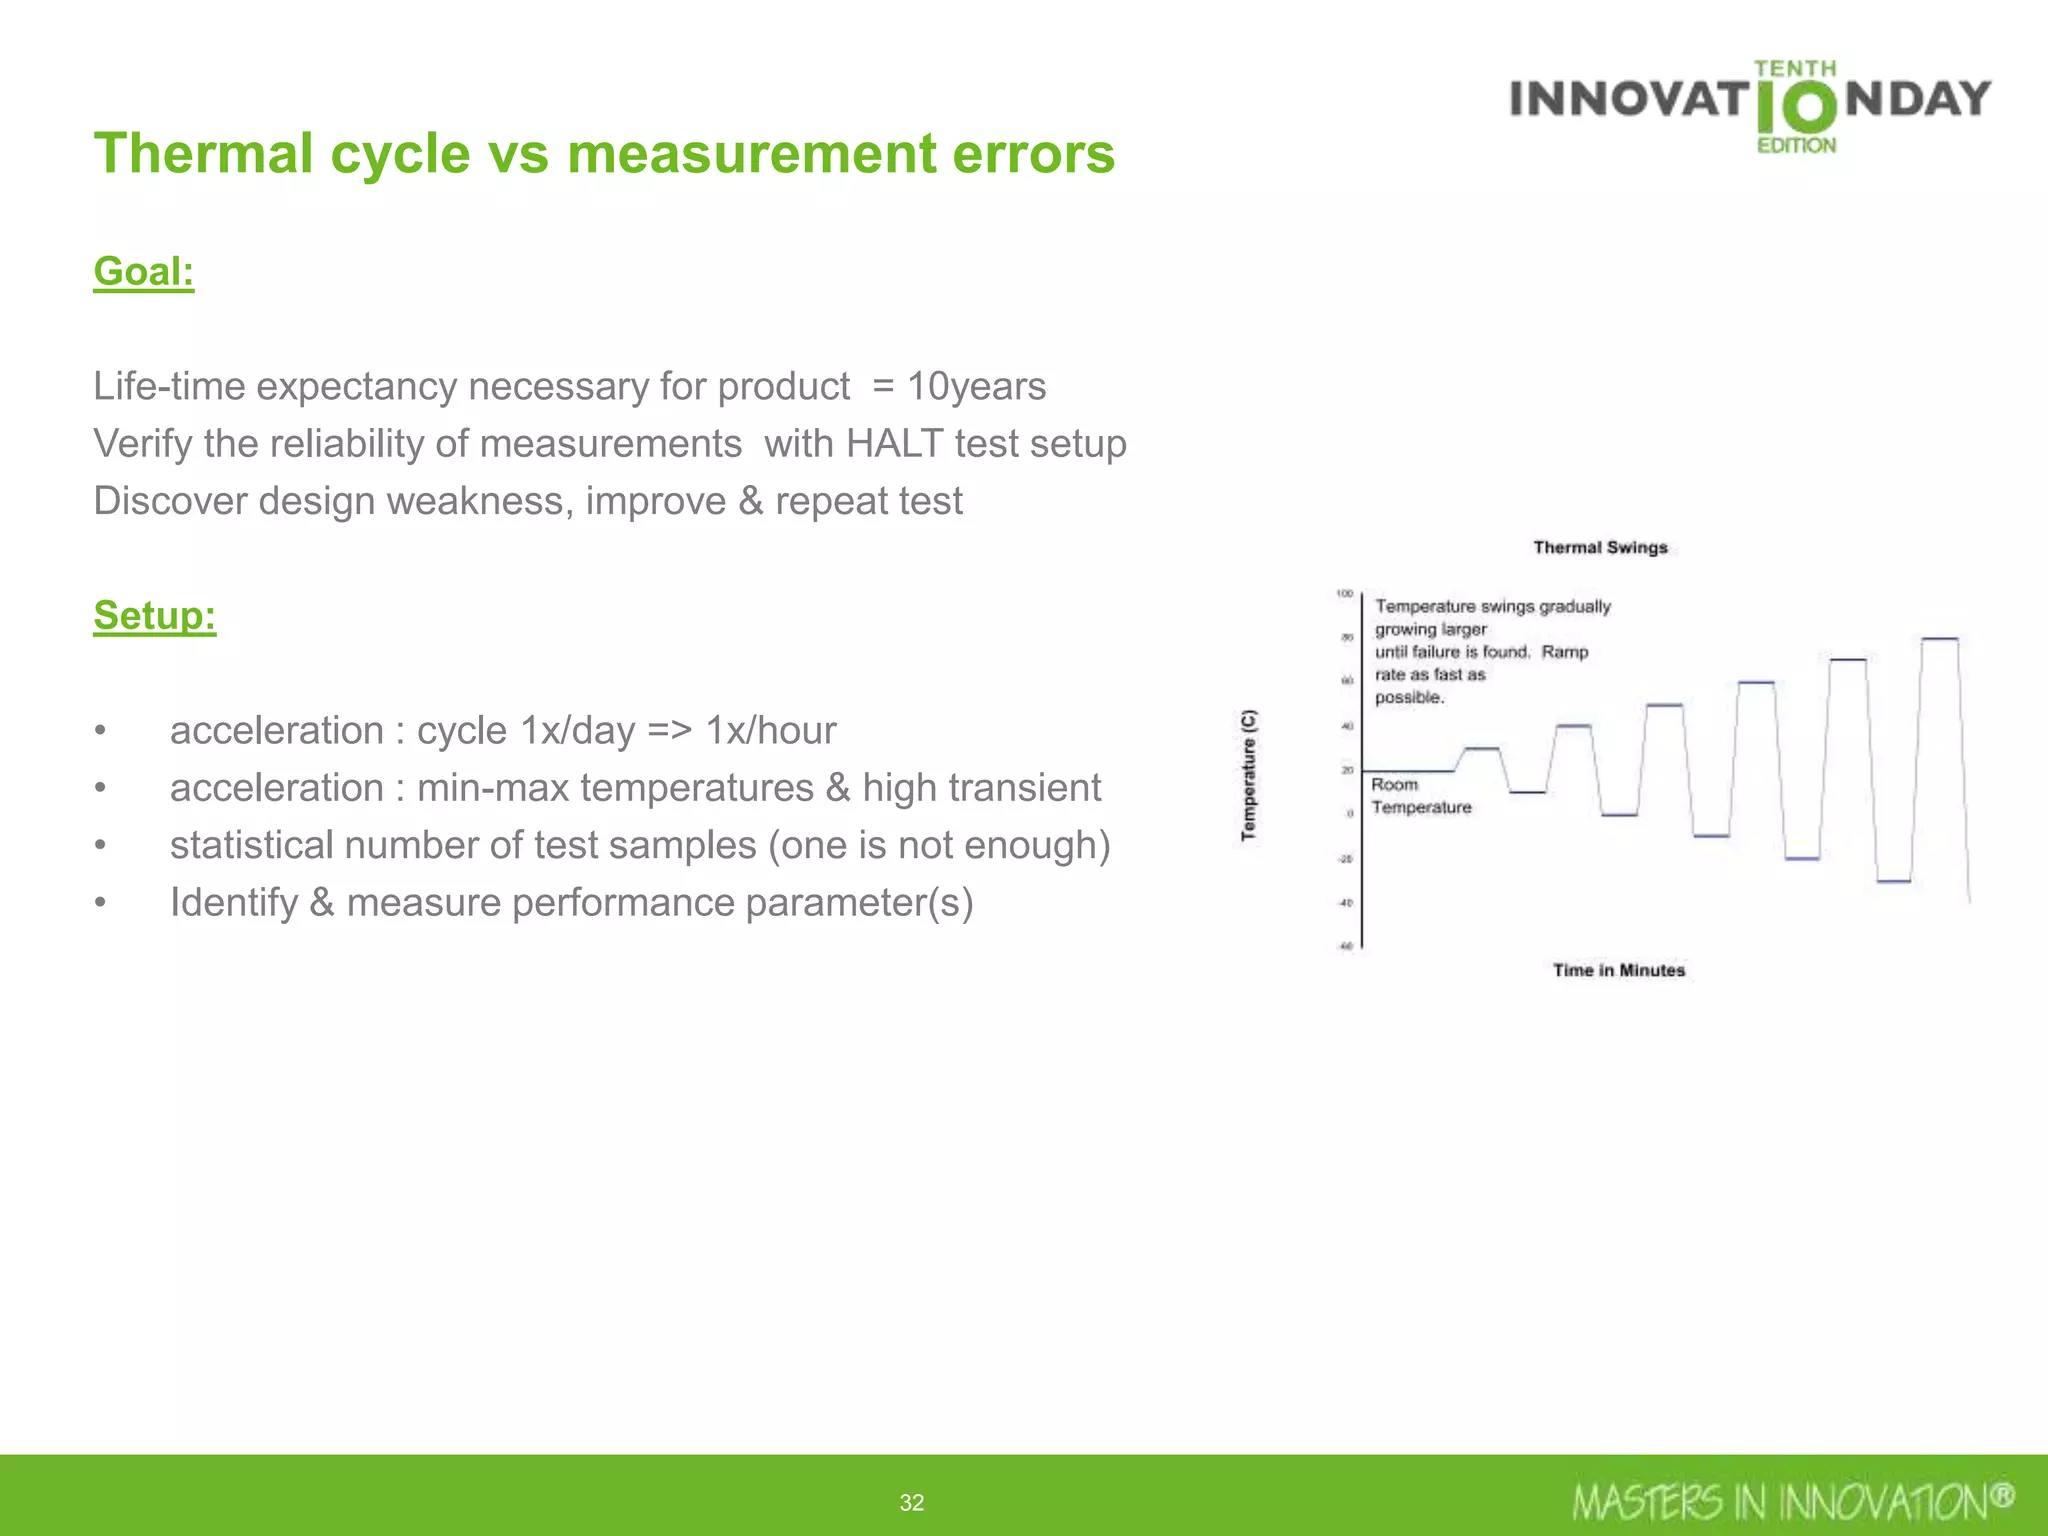

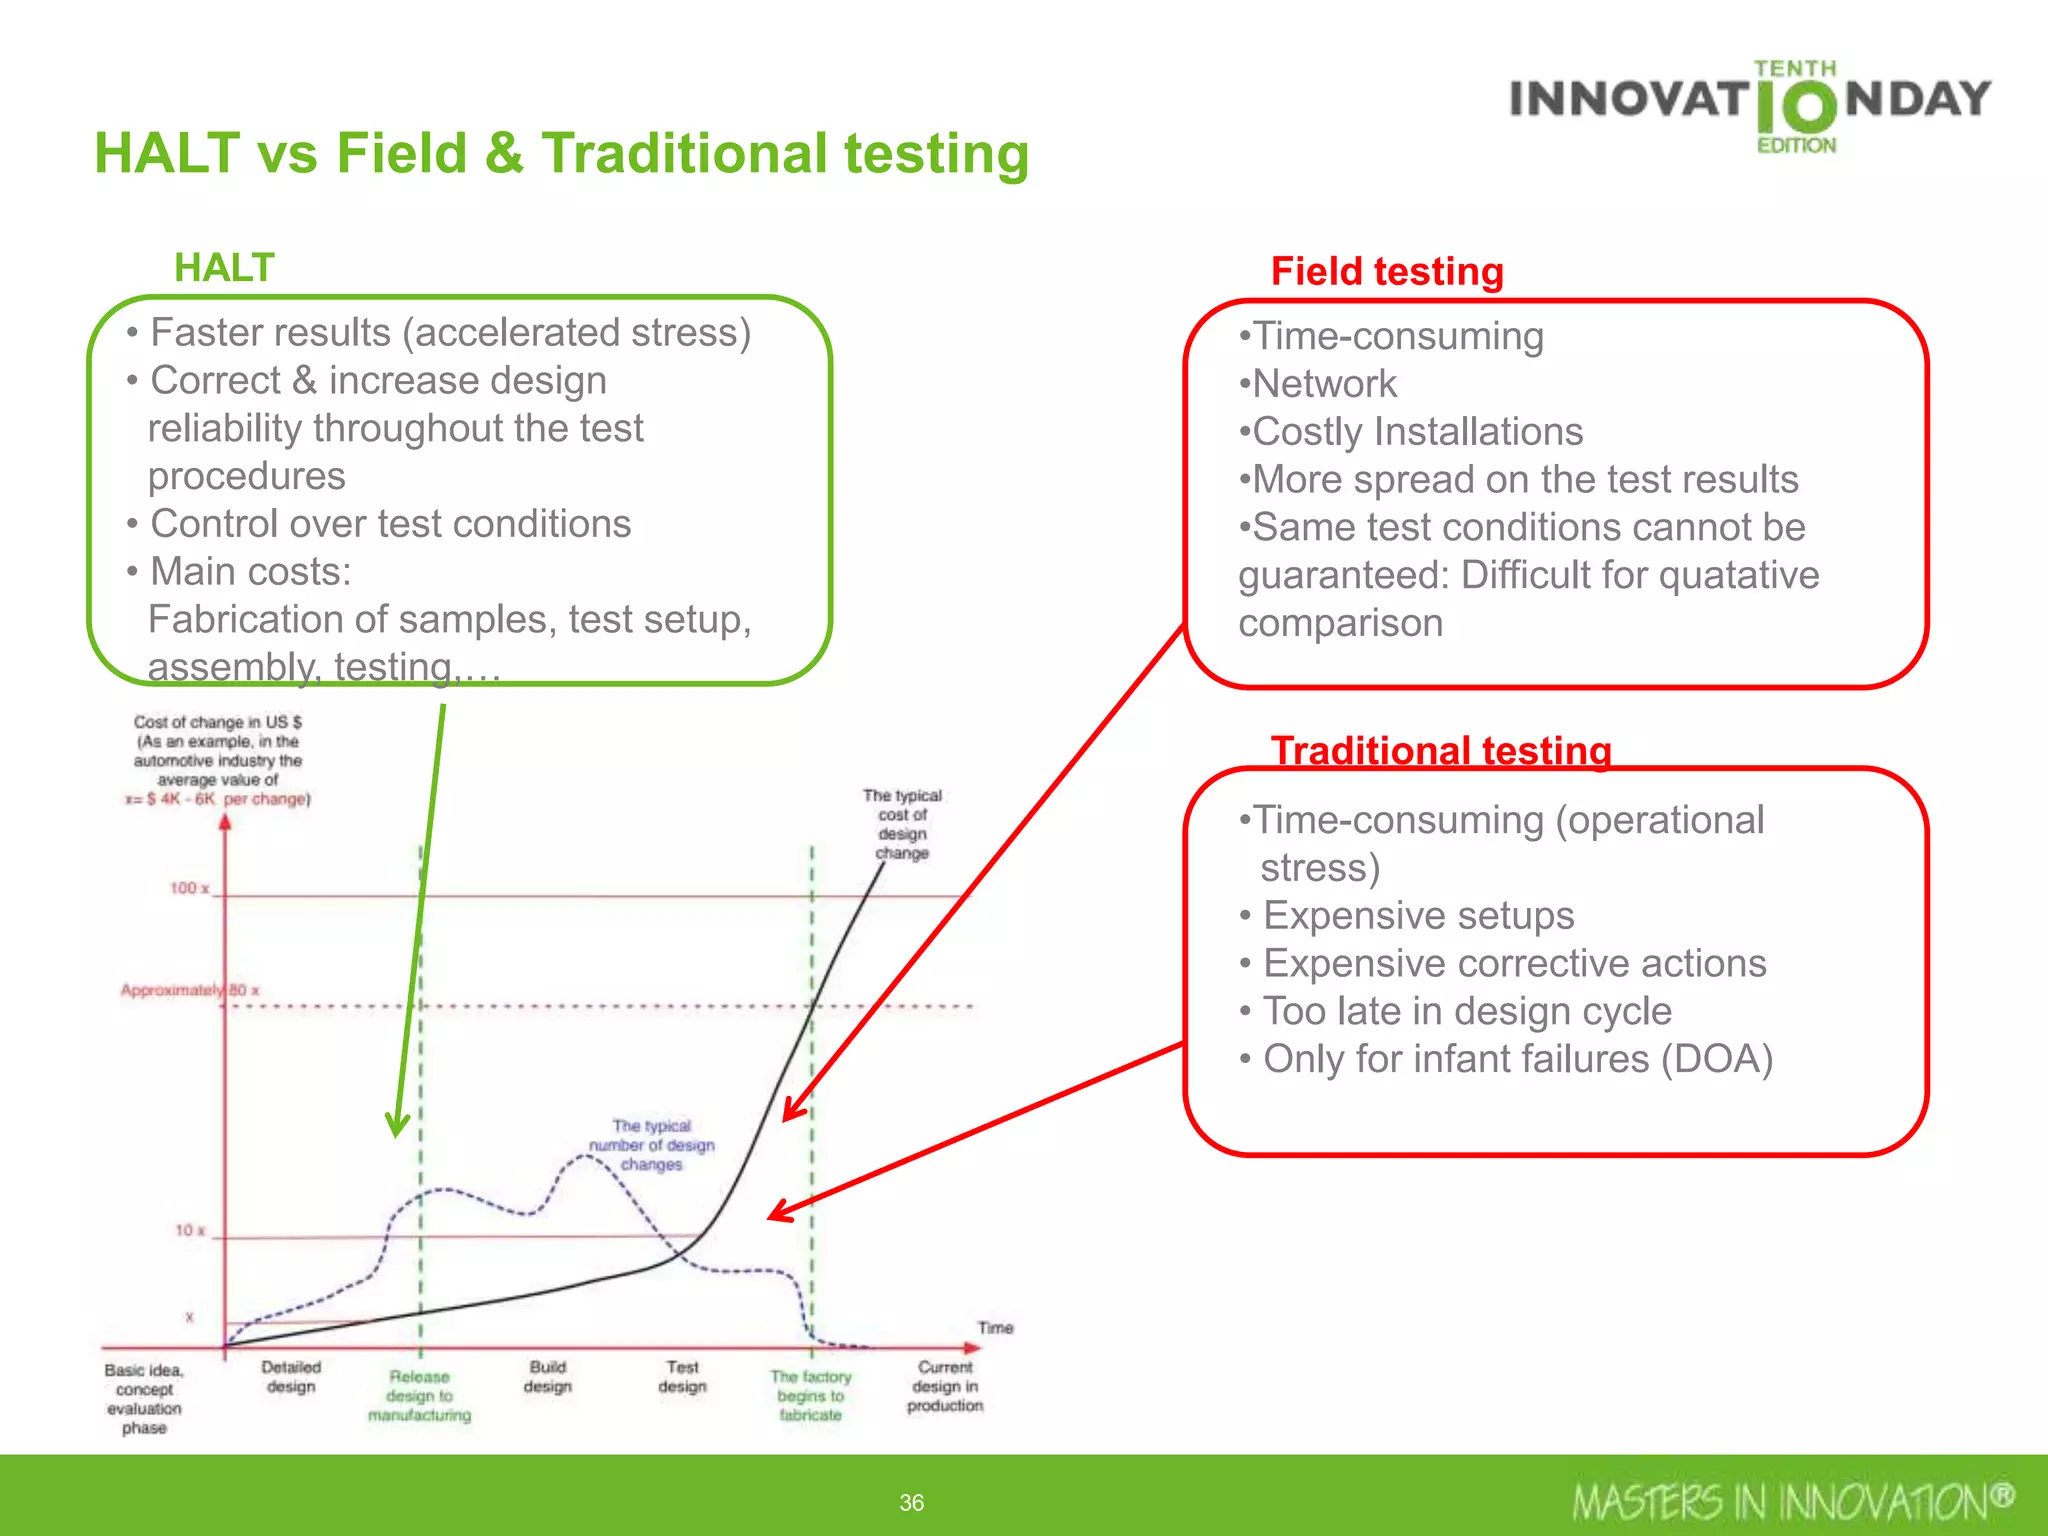

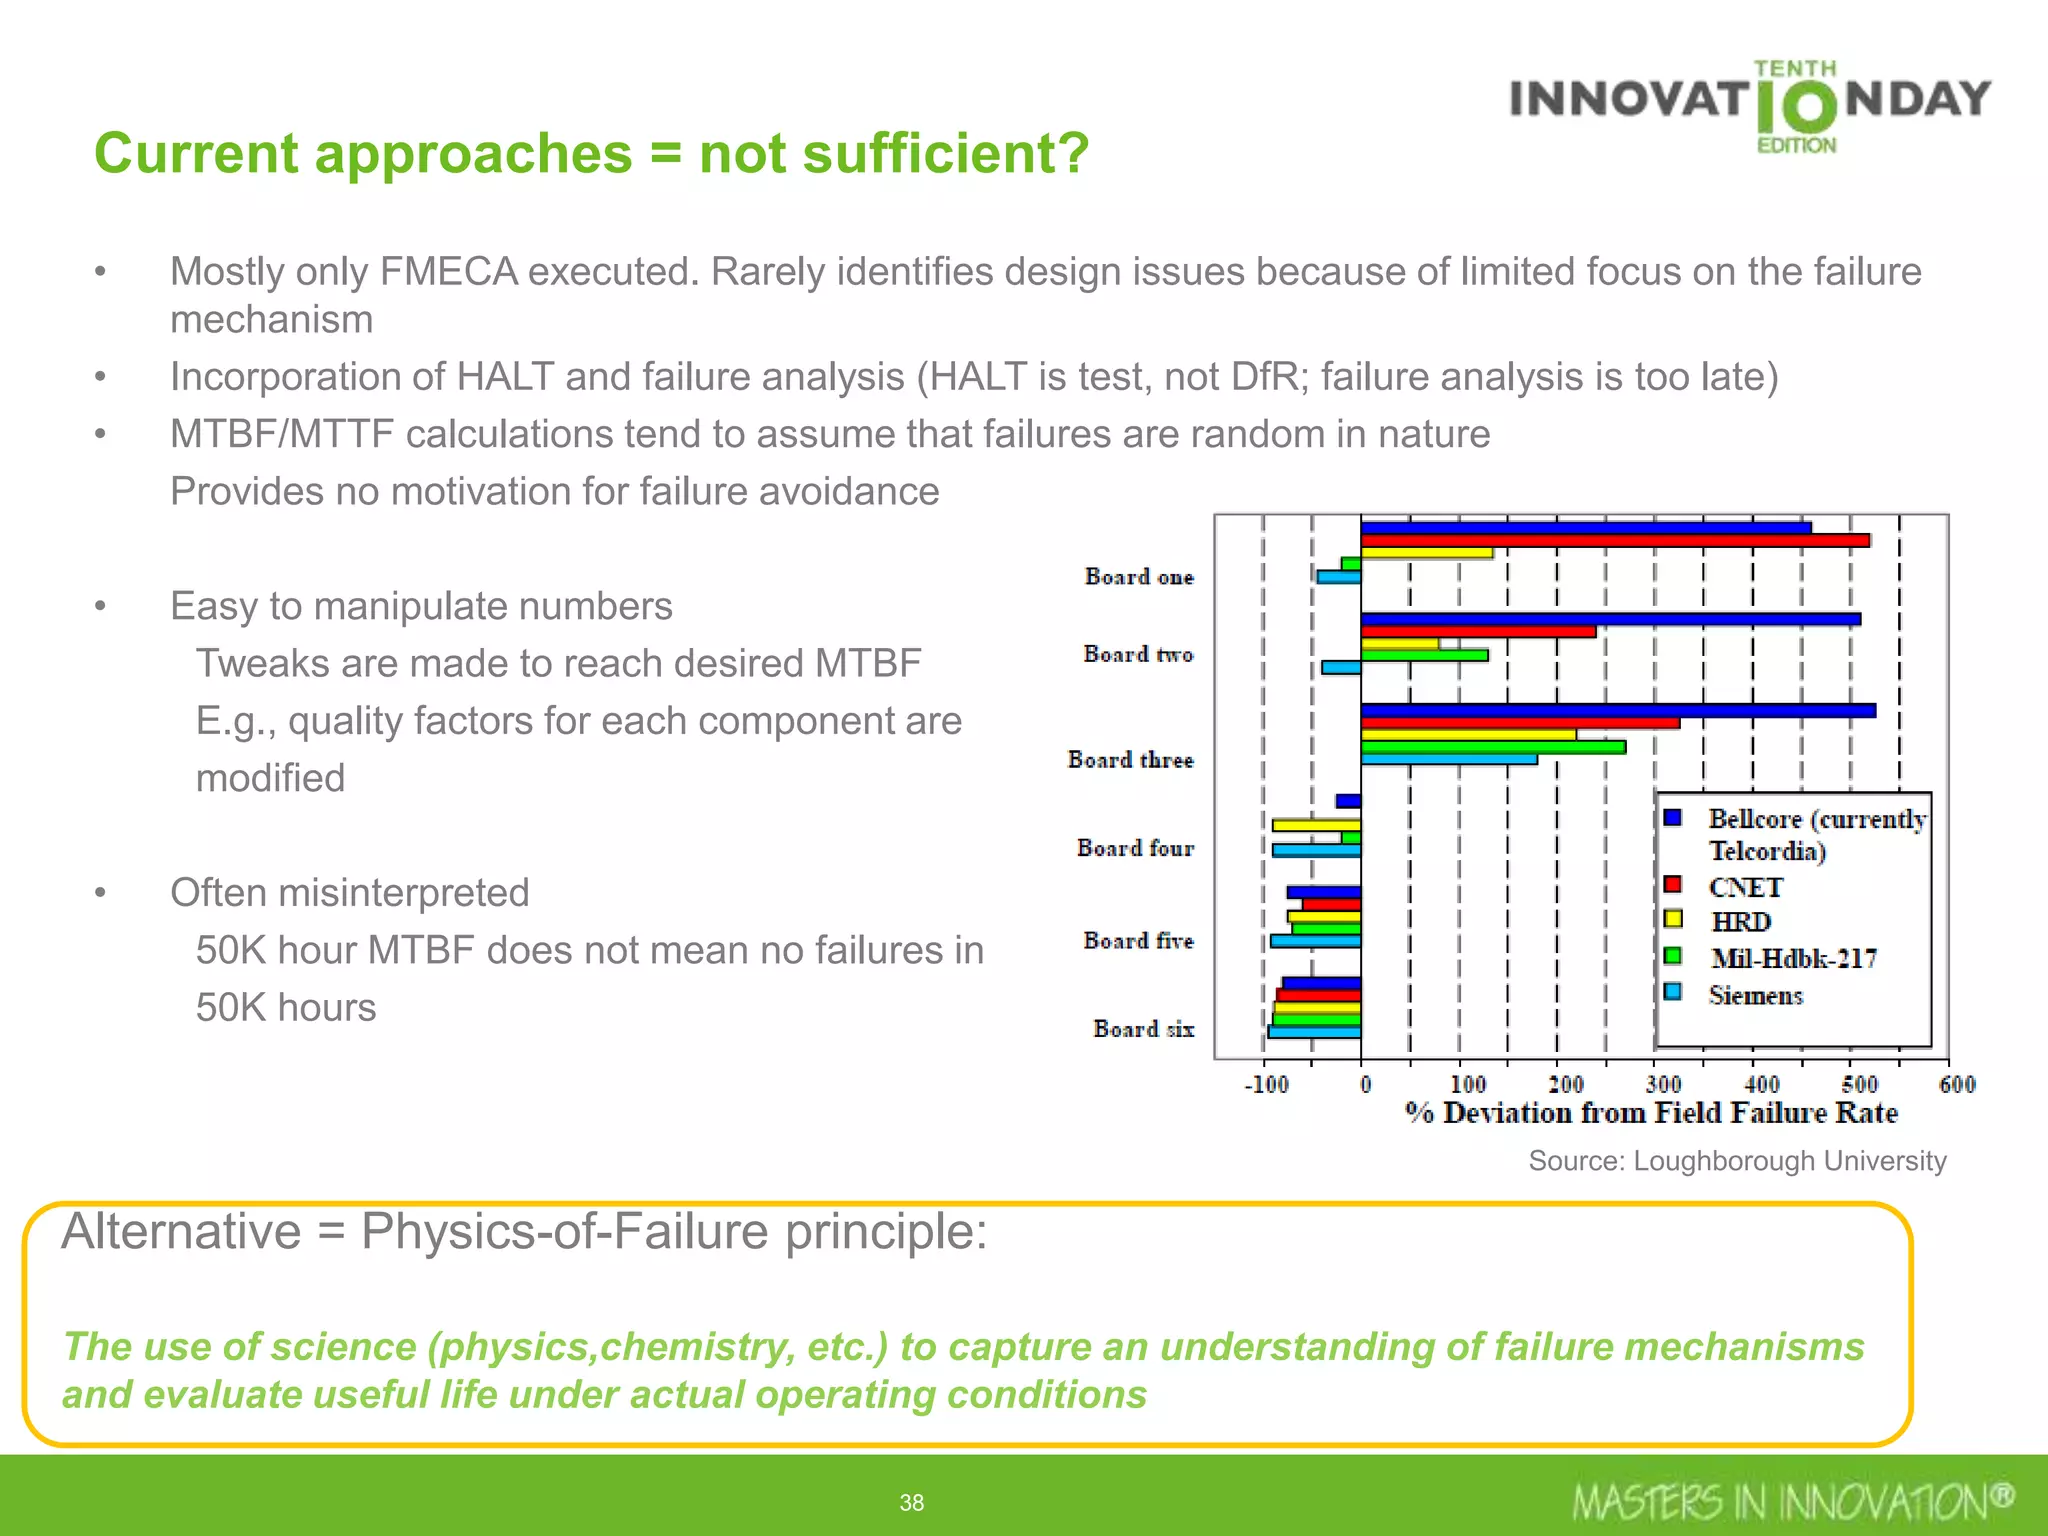
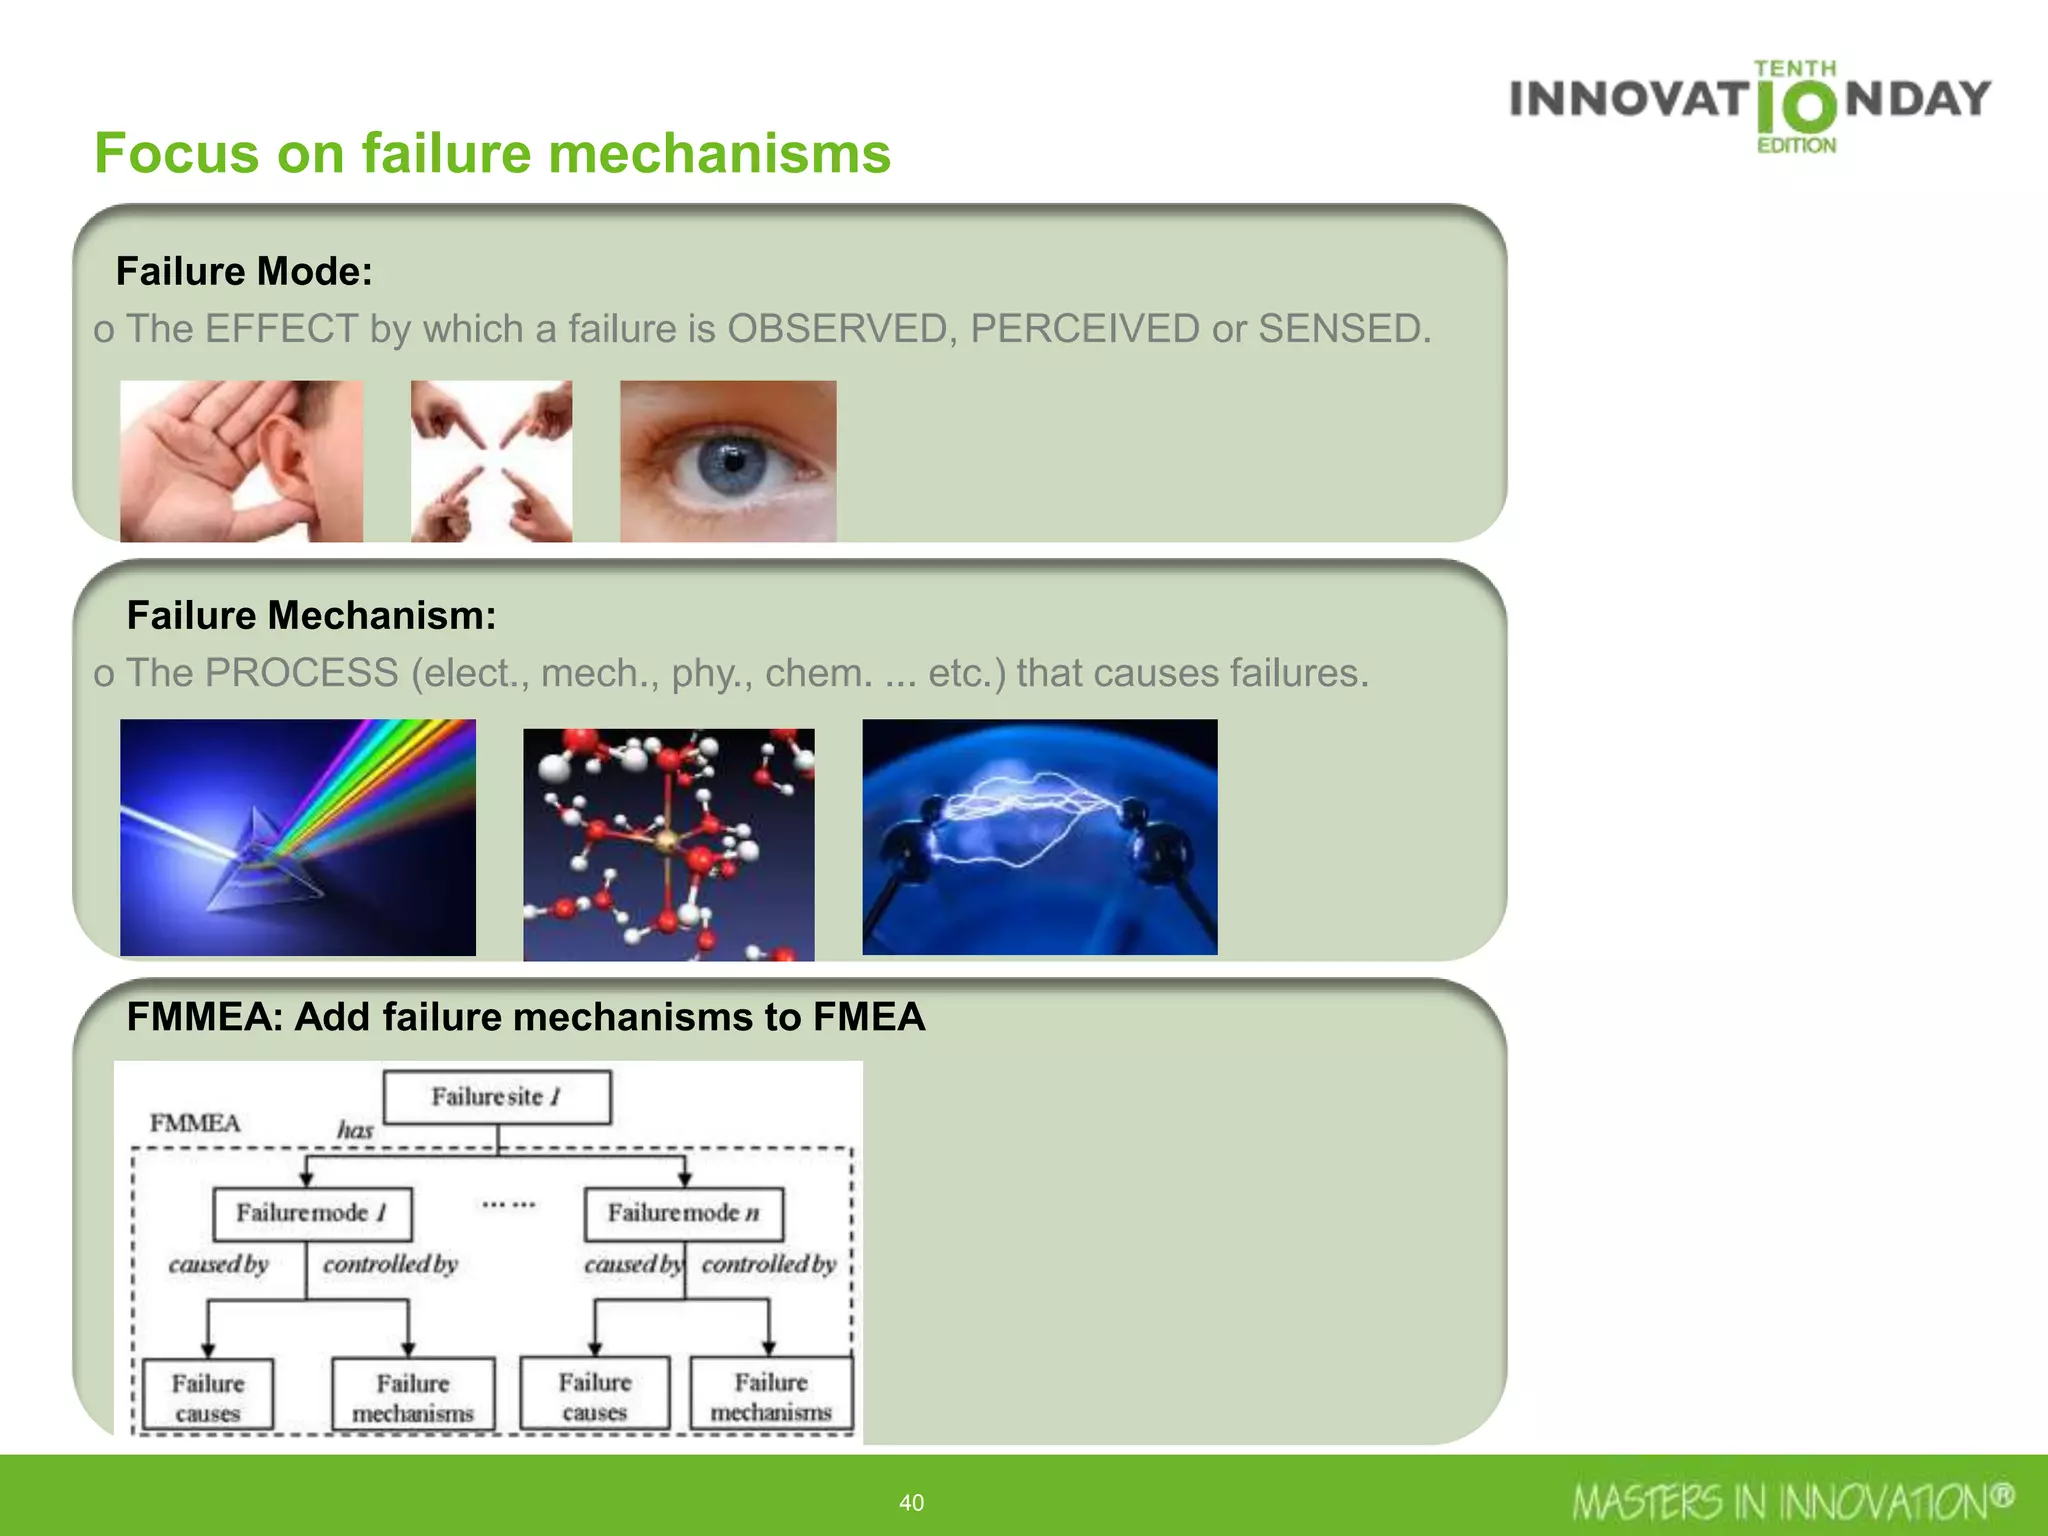


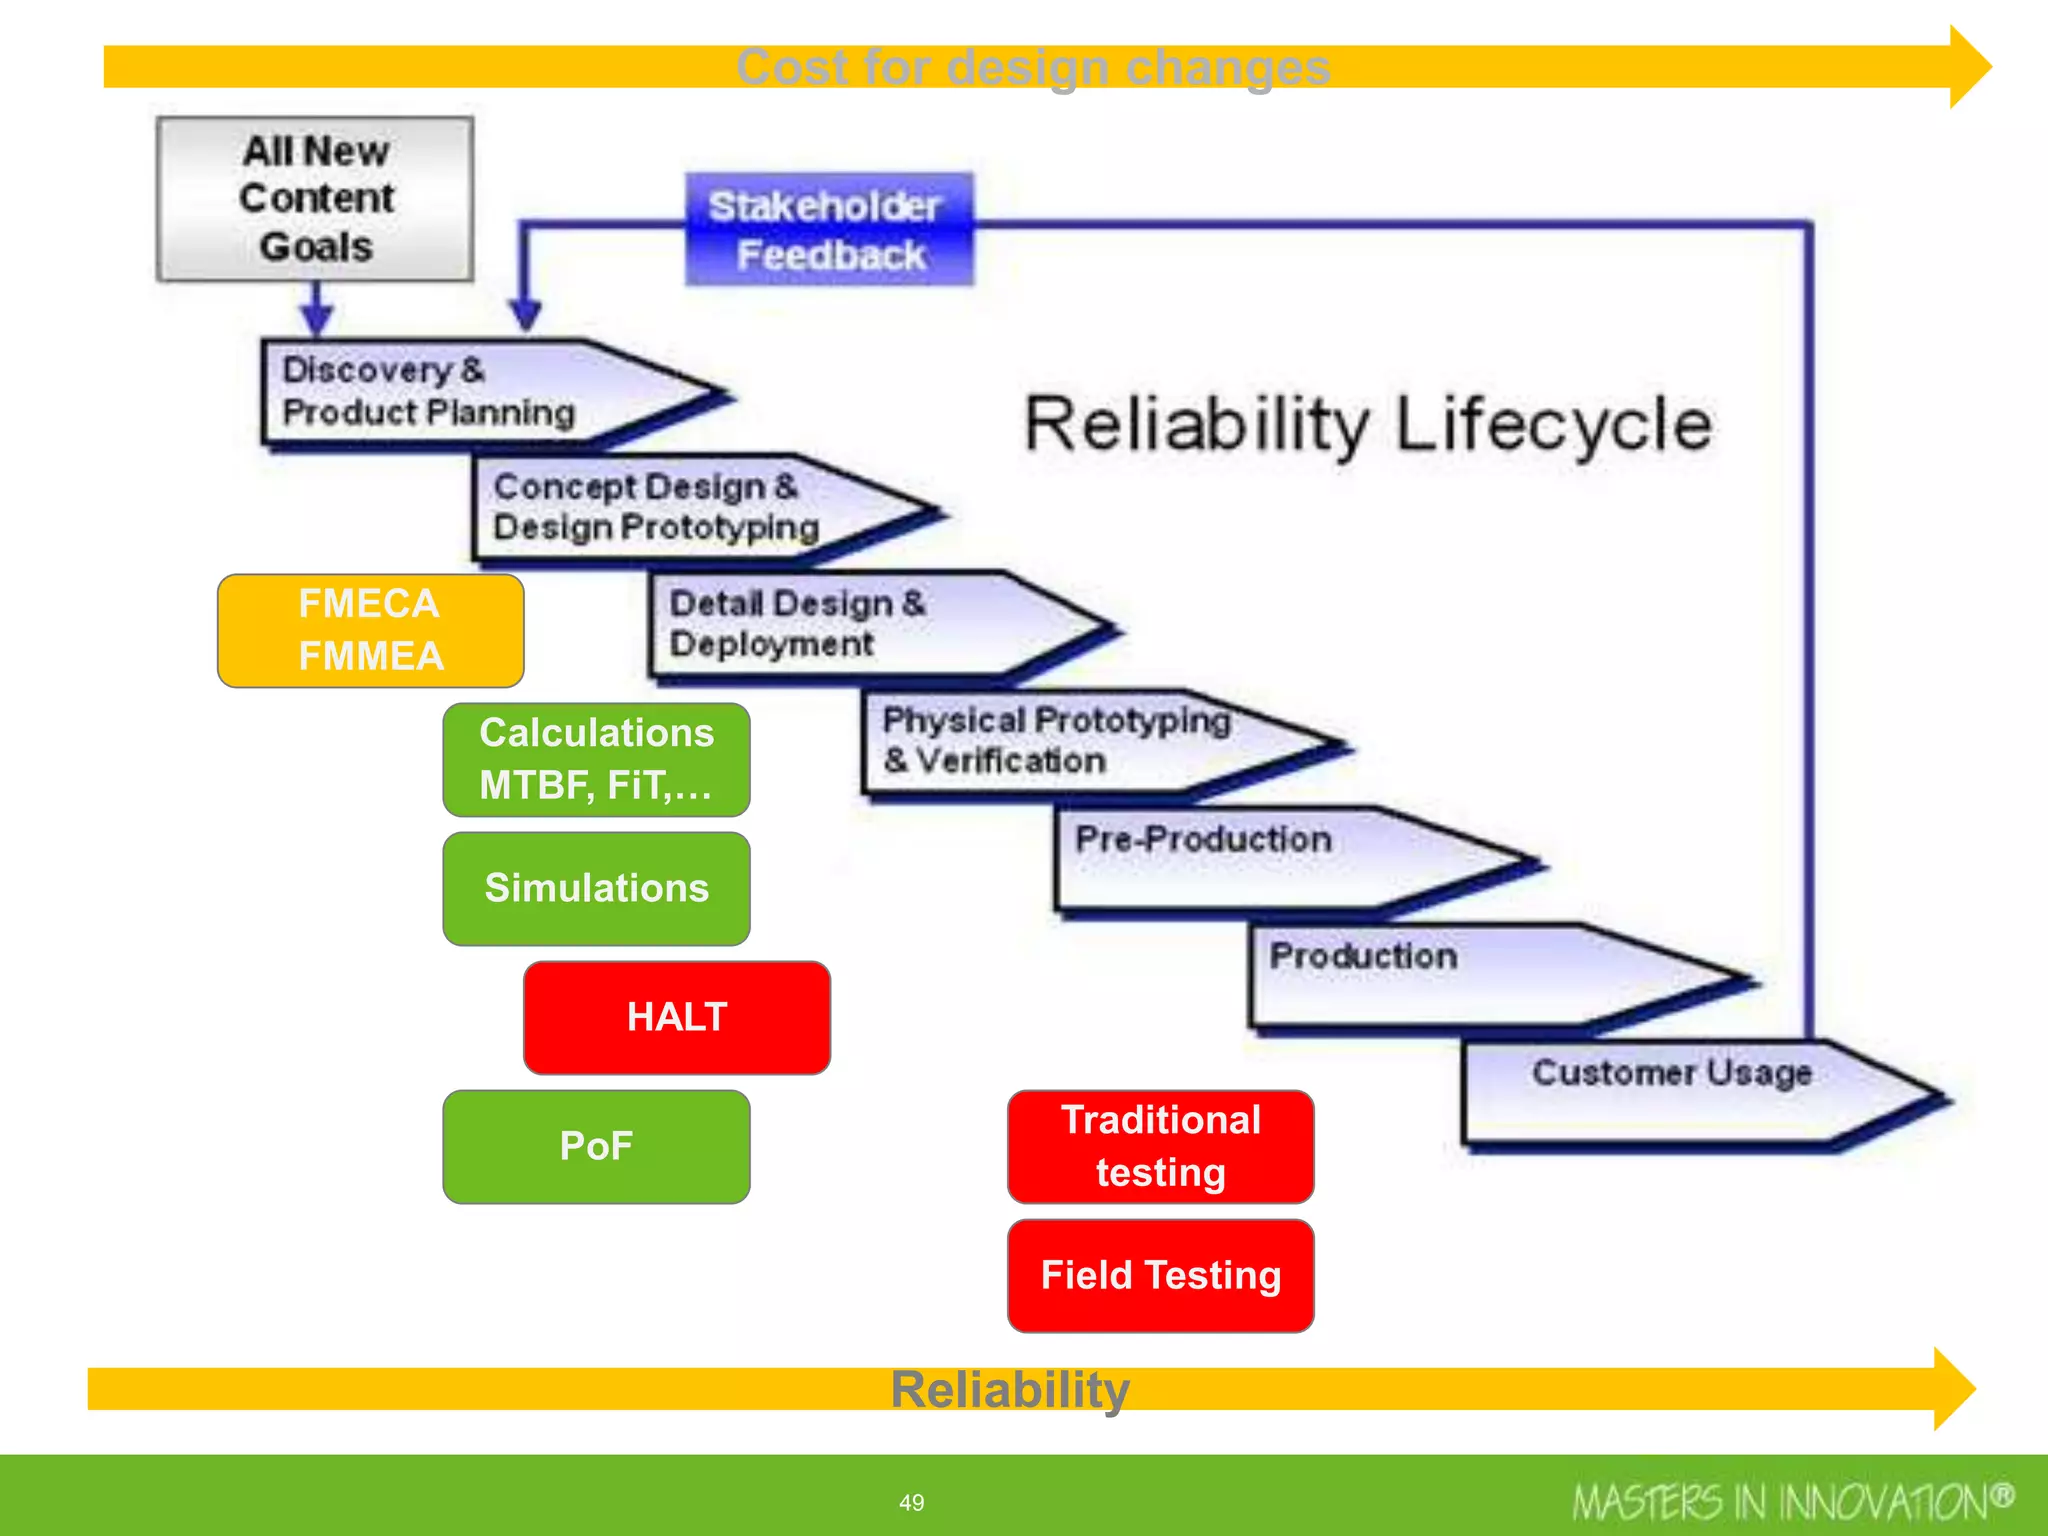


This document discusses approaches for managing risk in innovation projects through reliability engineering. It describes three methods: theoretical using standards and simulations, pragmatic with accelerated testing, and analytical using probability of failure calculations. The theoretical approach involves scoping subsystems and identifying reliability metrics from norms. Calculations include MTBF and FIT rates. Simulations validate designs through FEA, software, and system modeling. Pragmatic testing uses highly accelerated life testing to discover weaknesses early in design phases. The goal is to improve reliability and reduce costs from late-stage changes.