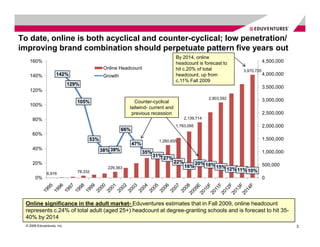
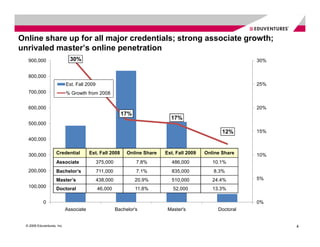
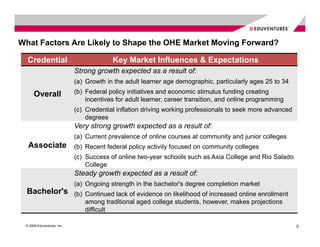
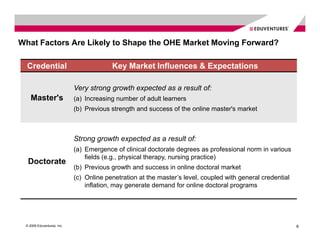
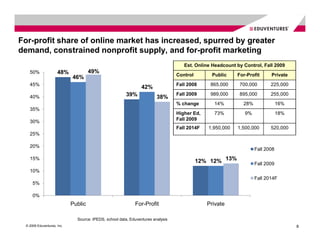
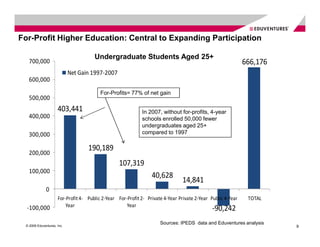
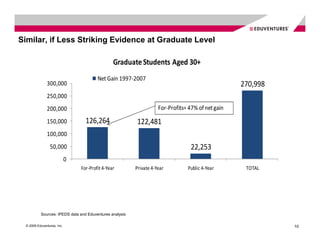
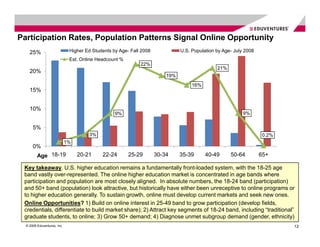
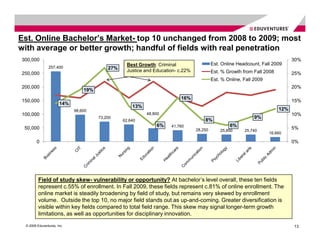
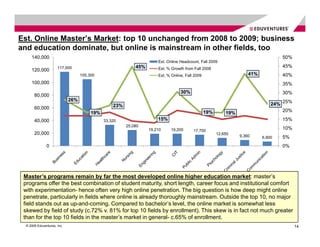
Hot Programs and Hot Markets


Pearson Learning Solutions Summit

Las Vegas, Nevada

December 9, 2009
• Explaining Growth in the Online Higher
  Education Market

• The Role of For-Profit Providers

• A Closer Look at Growth Sectors: Markets
  and Programs


© 2009 Eduventures, Inc.                     2
To date, online is both acyclical and counter-cyclical; low penetration/
improving brand combination should perpetuate pattern five years out
                                                                                 By 2014, online
    160%                                                                         headcount is forecast to                      4,500,000
                                            Online Headcount                     hit c.20% of total                3,970,720
    140%             142%                   Growth                               headcount, up from                            4,000,000
                                                                                 c.11% Fall 2009
                             129%
                                                                                                                               3,500,000
    120%
                                                                                                   2,903,592                   3,000,000
                                105%                     Counter-cyclical
    100%
                                                       tailwind- current and
                                                        previous recession                                                     2,500,000
      80%                                                                              2,139,714
                                                                                 1,783,095                                     2,000,000
                                                     66%
      60%
                                     53%                                 1,260,605                                             1,500,000
                                                           47%
      40%                                  38% 39%               35%                                                           1,000,000
                                                                       31% 27%
      20%                                                                        22%         20% 18%
                                                                                       16%             15% 12%                 500,000
                                             229,363
                                78,332                                                                           11% 10%
               6,916
        0%                                                                                                                     0


 Online significance in the adult market- Eduventures estimates that in Fall 2009, online headcount
 represents c.24% of total adult (aged 25+) headcount at degree-granting schools and is forecast to hit 35-
 40% by 2014
  © 2009 Eduventures, Inc.                                                                                                                 3
Online share up for all major credentials; strong associate growth;
unrivaled master’s online penetration
   900,000                     30%                                                                           30%


   800,000
                             Est. Fall 2009                                                                  25%
   700,000                   % Growth from 2008


   600,000                                                                                                   20%
                                                          17%
                                                                              17%
   500,000
                                                                                                    12%      15%
   400,000


   300,000           Credential          Est. Fall 2008      Online Share   Est. Fall 2009   Online Share    10%
                     Associate                375,000            7.8%          486,000          10.1%
   200,000           Bachelor’s               711,000            7.1%          835,000          8.3%
                     Master’s                 438,000           20.9%          510,000          24.4%        5%
   100,000           Doctoral                 46,000            11.8%          52,000           13.3%

             0                                                                                               0%
                             Associate                  Bachelor's           Master's             Doctoral


  © 2009 Eduventures, Inc.                                                                                         4
What Factors Are Likely to Shape the OHE Market Moving Forward?

  Credential                             Key Market Influences & Expectations
                            Strong growth expected as a result of:
                            (a) Growth in the adult learner age demographic, particularly ages 25 to 34

      Overall               (b) Federal policy initiatives and economic stimulus funding creating
                                incentives for adult learner, career transition, and online programming
                            (c) Credential inflation driving working professionals to seek more advanced
                                degrees
                            Very strong growth expected as a result of:
                            (a) Current prevalence of online courses at community and junior colleges
  Associate                 (b) Recent federal policy activity focused on community colleges
                            (c) Success of online two-year schools such as Axia College and Rio Salado
                                College
                            Steady growth expected as a result of:
                            (a) Ongoing strength in the bachelor's degree completion market
  Bachelor's                (b) Continued lack of evidence on likelihood of increased online enrollment
                                among traditional aged college students, however, makes projections
                                difficult

 © 2009 Eduventures, Inc.                                                                                  5
What Factors Are Likely to Shape the OHE Market Moving Forward?

  Credential                             Key Market Influences & Expectations

                            Very strong growth expected as a result of:
    Master's                (a) Increasing number of adult learners
                            (b) Previous strength and success of the online master's market


                            Strong growth expected as a result of:
                            (a) Emergence of clinical doctorate degrees as professional norm in various
                                fields (e.g., physical therapy, nursing practice)
  Doctorate
                            (b) Previous growth and success in online doctoral market
                            (c) Online penetration at the master’s level, coupled with general credential
                                inflation, may generate demand for online doctoral programs


 © 2009 Eduventures, Inc.                                                                                   6
• Explaining Growth in the Online Higher
  Education Market

• The Role of For-Profit Providers

• A Closer Look at Growth Sectors: Markets
  and Programs


© 2009 Eduventures, Inc.                     7
For-profit share of online market has increased, spurred by greater
demand, constrained nonprofit supply, and for-profit marketing
                                                                                     Est. Online Headcount by Control, Fall 2009
    50%               48%             49%
                                                                                  Control        Public    For-Profit      Private
                             46%
    45%                                                                           Fall 2008     865,000     700,000        225,000
                                                                 42%
    40%                                                 39%              38%
                                                                                  Fall 2009     989,000     895,000        255,000
                                                                                  % change       14%          28%               16%
    35%
                                                                                  Higher Ed,     73%          9%                18%
                                                                                  Fall 2009
    30%
                                                                                  Fall 2014F   1,950,000   1,500,000       520,000
    25%

    20%
                                                                                                                    Fall 2008
    15%
                                                                                            12% 12% 13%             Fall 2009
    10%
                                                                                                                    Fall 2014F
      5%

      0%
                             Public                          For-Profit                        Private

                               Source: IPEDS, school data, Eduventures analysis
  © 2009 Eduventures, Inc.                                                                                                            8
For-Profit Higher Education: Central to Expanding Participation

                                      Undergraduate Students Aged 25+
  700,000                                                                                                    666,176
                            Net Gain 1997-2007
  600,000
                                         For-Profits= 77% of net gain
  500,000
                     403,441                                In 2007, without for-profits, 4-year
  400,000                                                   schools enrolled 50,000 fewer
                                                            undergraduates aged 25+
  300,000                                                   compared to 1997

                                   190,189
  200,000
                                                  107,319
  100,000
                                                                 40,628
                                                                                14,841
              0
                     For-Profit 4- Public 2-Year For-Profit 2- Private 4-Year Private 2-Year Public 4-Year    TOTAL
                         Year                        Year
  -100,000                                                                                    -90,242
                                                                     Sources: IPEDS data and Eduventures analysis
 © 2009 Eduventures, Inc.                                                                                              9
Similar, if Less Striking Evidence at Graduate Level

                                                 Graduate Students Aged 30+
                                         Net Gain 1997-2007
               300,000                                                                              270,998
               250,000
               200,000                                               For-Profits= 47% of net gain

               150,000             126,264                122,481
               100,000
                 50,000                                                            22,253
                             0
                                 For-Profit 4-Year        Private 4-Year         Public 4-Year       TOTAL


           Sources: IPEDS data and Eduventures analysis

  © 2009 Eduventures, Inc.                                                                                    10
• Explaining Growth in the Online Higher
  Education Market

• The Role of For-Profit Providers

• A Closer Look at Growth Sectors: Markets
  and Programs


© 2009 Eduventures, Inc.                     11
Participation Rates, Population Patterns Signal Online Opportunity
    25%                       Higher Ed Students by Age- Fall 2008             U.S. Population by Age- July 2008
                              Est. Online Headcount %
                                                             22%
                                                                                               21%
    20%
                                                                         19%
                                                                                    16%
    15%


    10%
                                                  9%                                                       9%

      5%
                                      3%                                                                            0.2%
                             1%
      0%
         Age 18-19                20-21     22-24       25-29        30-34     35-39      40-49      50-64         65+

 Key takeaway. U.S. higher education remains a fundamentally front-loaded system, with the 18-25 age
 band vastly over-represented. The online higher education market is concentrated in age bands where
 participation and population are most closely aligned. In absolute numbers, the 18-24 band (participation)
 and 50+ band (population) look attractive, but historically have either been unreceptive to online programs or
 to higher education generally. To sustain growth, online must develop current markets and seek new ones.
 Online Opportunities? 1) Build on online interest in 25-49 band to grow participation (develop fields,
 credentials, differentiate to build market share); 2) Attract key segments of 18-24 band, including “traditional”
 graduate students, to online; 3) Grow 50+ demand; 4) Diagnose unmet subgroup demand (gender, ethnicity)
  © 2009 Eduventures, Inc.                                                                                                 12
Est. Online Bachelor’s Market- top 10 unchanged from 2008 to 2009; most
with average or better growth; handful of fields with real penetration
300,000                                                                                                                        30%
                                                  Best Growth: Criminal                   Est. Online Headcount, Fall 2009
               257,400                    27%
                                                  Justice and Education- c.22%            Est. % Growth from Fall 2008
250,000                                                                                                                        25%
                                                                                          Est. % Online, Fall 2009
200,000                                                                                                                        20%
                                19%
                                                                         16%
150,000                                                                                                                        15%
                      14%
                                                    13%
                            98,600                                                                                       12%
100,000                                                   48,800                                                               10%
                                      73,200                                                                  9%
                                                62,640                               8%
                                                               6%    41,760                       6%
 50,000                                                                          28,250       25,850     25,740
                                                                                                                               5%
                                                                                                                     16,660

        0                                                                                                                      0%


         Field of study skew- vulnerability or opportunity? At bachelor’s level overall, these ten fields
         represent c.55% of enrollment. In Fall 2009, these fields represent c.81% of online enrollment. The
         online market is steadily broadening by field of study, but remains very skewed by enrollment
         volume. Outside the top 10, no major field stands out as up-and-coming. Greater diversification is
         visible within key fields compared to total field range. This skew may signal longer-term growth
         limitations, as well as opportunities for disciplinary innovation.

 © 2009 Eduventures, Inc.                                                                                                      13
Est. Online Master’s Market: top 10 unchanged from 2008 to 2009; business
and education dominate, but online is mainstream in other fields, too
     140,000                                                                                                                       50%
                                                                      Est. Online Headcount, Fall 2009
                      117,000                               45%       Est. % Growth from Fall 2008
                                                                                                                                   45%
     120,000
                                   105,300                            Est. % Online, Fall 2009                       41%           40%
     100,000                                                                                                                       35%
                                                                                  30%                                              30%
       80,000
                             26%
                                                  23%                                                                          24% 25%
       60,000
                                        19%                                                      19%                               20%
                                                                                                           19%
       40,000                                 33,320                  15%                                                          15%
                                                        25,080
                                                                  19,210     19,200      17,700
                                                                                                                                   10%
       20,000                                                                                          12,650
                                                                                                                 9,360     6,900   5%
               0                                                                                                                   0%


 Master’s programs remain by far the most developed online higher education market: master’s
 programs offer the best combination of student maturity, short length, career focus and institutional comfort
 with experimentation- hence often very high online penetration. The big question is how deep might online
 penetrate, particularly in fields where online is already thoroughly mainstream. Outside the top 10, no major
 field stands out as up-and-coming. Compared to bachelor’s level, the online market is somewhat less
 skewed by field of study (c.72% v. 81% for top 10 fields by enrollment). This skew is in fact not much greater
 than for the top 10 fields in the master’s market in general- c.65% of enrollment.
  © 2009 Eduventures, Inc.                                                                                                               14
The Stimulus Package Presents Opportunities over the Next Few Years
for Distance Learning Providers to Develop Programs Targeted at the
Needs of New Market Segments
•      The stimulus seeks to spur workforce development in key growth sectors and
       address broader infrastructure concerns:
          – $3 billion for the Workforce Investment Act
                   • Targeting workforce development in energy efficiency, healthcare, teacher training/educational
                     technology, and green jobs
          – $7 billion for investment in broadband access, particularly in rural areas
                   • Designed to spur economic development more generally, but targeting telemedicine and distance
                     learning
                   • Community computer centers and training  improved technology access for rural populations?


•      Echoing the educational initiatives from the early months of the
       Administration, ARRA funding is likely to generate opportunities for online
       higher education providers to:
          – Attract new market segments through programs to serve targeted /innovative industries
          – Forge industry and government alliances


    © 2009 Eduventures, Inc.                                                                                          15

Eduventures

  • 1.
    Hot Programs andHot Markets Pearson Learning Solutions Summit Las Vegas, Nevada December 9, 2009
  • 2.
    • Explaining Growthin the Online Higher Education Market • The Role of For-Profit Providers • A Closer Look at Growth Sectors: Markets and Programs © 2009 Eduventures, Inc. 2
  • 3.
    To date, onlineis both acyclical and counter-cyclical; low penetration/ improving brand combination should perpetuate pattern five years out By 2014, online 160% headcount is forecast to 4,500,000 Online Headcount hit c.20% of total 3,970,720 140% 142% Growth headcount, up from 4,000,000 c.11% Fall 2009 129% 3,500,000 120% 2,903,592 3,000,000 105% Counter-cyclical 100% tailwind- current and previous recession 2,500,000 80% 2,139,714 1,783,095 2,000,000 66% 60% 53% 1,260,605 1,500,000 47% 40% 38% 39% 35% 1,000,000 31% 27% 20% 22% 20% 18% 16% 15% 12% 500,000 229,363 78,332 11% 10% 6,916 0% 0 Online significance in the adult market- Eduventures estimates that in Fall 2009, online headcount represents c.24% of total adult (aged 25+) headcount at degree-granting schools and is forecast to hit 35- 40% by 2014 © 2009 Eduventures, Inc. 3
  • 4.
    Online share upfor all major credentials; strong associate growth; unrivaled master’s online penetration 900,000 30% 30% 800,000 Est. Fall 2009 25% 700,000 % Growth from 2008 600,000 20% 17% 17% 500,000 12% 15% 400,000 300,000 Credential Est. Fall 2008 Online Share Est. Fall 2009 Online Share 10% Associate 375,000 7.8% 486,000 10.1% 200,000 Bachelor’s 711,000 7.1% 835,000 8.3% Master’s 438,000 20.9% 510,000 24.4% 5% 100,000 Doctoral 46,000 11.8% 52,000 13.3% 0 0% Associate Bachelor's Master's Doctoral © 2009 Eduventures, Inc. 4
  • 5.
    What Factors AreLikely to Shape the OHE Market Moving Forward? Credential Key Market Influences & Expectations Strong growth expected as a result of: (a) Growth in the adult learner age demographic, particularly ages 25 to 34 Overall (b) Federal policy initiatives and economic stimulus funding creating incentives for adult learner, career transition, and online programming (c) Credential inflation driving working professionals to seek more advanced degrees Very strong growth expected as a result of: (a) Current prevalence of online courses at community and junior colleges Associate (b) Recent federal policy activity focused on community colleges (c) Success of online two-year schools such as Axia College and Rio Salado College Steady growth expected as a result of: (a) Ongoing strength in the bachelor's degree completion market Bachelor's (b) Continued lack of evidence on likelihood of increased online enrollment among traditional aged college students, however, makes projections difficult © 2009 Eduventures, Inc. 5
  • 6.
    What Factors AreLikely to Shape the OHE Market Moving Forward? Credential Key Market Influences & Expectations Very strong growth expected as a result of: Master's (a) Increasing number of adult learners (b) Previous strength and success of the online master's market Strong growth expected as a result of: (a) Emergence of clinical doctorate degrees as professional norm in various fields (e.g., physical therapy, nursing practice) Doctorate (b) Previous growth and success in online doctoral market (c) Online penetration at the master’s level, coupled with general credential inflation, may generate demand for online doctoral programs © 2009 Eduventures, Inc. 6
  • 7.
    • Explaining Growthin the Online Higher Education Market • The Role of For-Profit Providers • A Closer Look at Growth Sectors: Markets and Programs © 2009 Eduventures, Inc. 7
  • 8.
    For-profit share ofonline market has increased, spurred by greater demand, constrained nonprofit supply, and for-profit marketing Est. Online Headcount by Control, Fall 2009 50% 48% 49% Control Public For-Profit Private 46% 45% Fall 2008 865,000 700,000 225,000 42% 40% 39% 38% Fall 2009 989,000 895,000 255,000 % change 14% 28% 16% 35% Higher Ed, 73% 9% 18% Fall 2009 30% Fall 2014F 1,950,000 1,500,000 520,000 25% 20% Fall 2008 15% 12% 12% 13% Fall 2009 10% Fall 2014F 5% 0% Public For-Profit Private Source: IPEDS, school data, Eduventures analysis © 2009 Eduventures, Inc. 8
  • 9.
    For-Profit Higher Education:Central to Expanding Participation Undergraduate Students Aged 25+ 700,000 666,176 Net Gain 1997-2007 600,000 For-Profits= 77% of net gain 500,000 403,441 In 2007, without for-profits, 4-year 400,000 schools enrolled 50,000 fewer undergraduates aged 25+ 300,000 compared to 1997 190,189 200,000 107,319 100,000 40,628 14,841 0 For-Profit 4- Public 2-Year For-Profit 2- Private 4-Year Private 2-Year Public 4-Year TOTAL Year Year -100,000 -90,242 Sources: IPEDS data and Eduventures analysis © 2009 Eduventures, Inc. 9
  • 10.
    Similar, if LessStriking Evidence at Graduate Level Graduate Students Aged 30+ Net Gain 1997-2007 300,000 270,998 250,000 200,000 For-Profits= 47% of net gain 150,000 126,264 122,481 100,000 50,000 22,253 0 For-Profit 4-Year Private 4-Year Public 4-Year TOTAL Sources: IPEDS data and Eduventures analysis © 2009 Eduventures, Inc. 10
  • 11.
    • Explaining Growthin the Online Higher Education Market • The Role of For-Profit Providers • A Closer Look at Growth Sectors: Markets and Programs © 2009 Eduventures, Inc. 11
  • 12.
    Participation Rates, PopulationPatterns Signal Online Opportunity 25% Higher Ed Students by Age- Fall 2008 U.S. Population by Age- July 2008 Est. Online Headcount % 22% 21% 20% 19% 16% 15% 10% 9% 9% 5% 3% 0.2% 1% 0% Age 18-19 20-21 22-24 25-29 30-34 35-39 40-49 50-64 65+ Key takeaway. U.S. higher education remains a fundamentally front-loaded system, with the 18-25 age band vastly over-represented. The online higher education market is concentrated in age bands where participation and population are most closely aligned. In absolute numbers, the 18-24 band (participation) and 50+ band (population) look attractive, but historically have either been unreceptive to online programs or to higher education generally. To sustain growth, online must develop current markets and seek new ones. Online Opportunities? 1) Build on online interest in 25-49 band to grow participation (develop fields, credentials, differentiate to build market share); 2) Attract key segments of 18-24 band, including “traditional” graduate students, to online; 3) Grow 50+ demand; 4) Diagnose unmet subgroup demand (gender, ethnicity) © 2009 Eduventures, Inc. 12
  • 13.
    Est. Online Bachelor’sMarket- top 10 unchanged from 2008 to 2009; most with average or better growth; handful of fields with real penetration 300,000 30% Best Growth: Criminal Est. Online Headcount, Fall 2009 257,400 27% Justice and Education- c.22% Est. % Growth from Fall 2008 250,000 25% Est. % Online, Fall 2009 200,000 20% 19% 16% 150,000 15% 14% 13% 98,600 12% 100,000 48,800 10% 73,200 9% 62,640 8% 6% 41,760 6% 50,000 28,250 25,850 25,740 5% 16,660 0 0% Field of study skew- vulnerability or opportunity? At bachelor’s level overall, these ten fields represent c.55% of enrollment. In Fall 2009, these fields represent c.81% of online enrollment. The online market is steadily broadening by field of study, but remains very skewed by enrollment volume. Outside the top 10, no major field stands out as up-and-coming. Greater diversification is visible within key fields compared to total field range. This skew may signal longer-term growth limitations, as well as opportunities for disciplinary innovation. © 2009 Eduventures, Inc. 13
  • 14.
    Est. Online Master’sMarket: top 10 unchanged from 2008 to 2009; business and education dominate, but online is mainstream in other fields, too 140,000 50% Est. Online Headcount, Fall 2009 117,000 45% Est. % Growth from Fall 2008 45% 120,000 105,300 Est. % Online, Fall 2009 41% 40% 100,000 35% 30% 30% 80,000 26% 23% 24% 25% 60,000 19% 19% 20% 19% 40,000 33,320 15% 15% 25,080 19,210 19,200 17,700 10% 20,000 12,650 9,360 6,900 5% 0 0% Master’s programs remain by far the most developed online higher education market: master’s programs offer the best combination of student maturity, short length, career focus and institutional comfort with experimentation- hence often very high online penetration. The big question is how deep might online penetrate, particularly in fields where online is already thoroughly mainstream. Outside the top 10, no major field stands out as up-and-coming. Compared to bachelor’s level, the online market is somewhat less skewed by field of study (c.72% v. 81% for top 10 fields by enrollment). This skew is in fact not much greater than for the top 10 fields in the master’s market in general- c.65% of enrollment. © 2009 Eduventures, Inc. 14
  • 15.
    The Stimulus PackagePresents Opportunities over the Next Few Years for Distance Learning Providers to Develop Programs Targeted at the Needs of New Market Segments • The stimulus seeks to spur workforce development in key growth sectors and address broader infrastructure concerns: – $3 billion for the Workforce Investment Act • Targeting workforce development in energy efficiency, healthcare, teacher training/educational technology, and green jobs – $7 billion for investment in broadband access, particularly in rural areas • Designed to spur economic development more generally, but targeting telemedicine and distance learning • Community computer centers and training improved technology access for rural populations? • Echoing the educational initiatives from the early months of the Administration, ARRA funding is likely to generate opportunities for online higher education providers to: – Attract new market segments through programs to serve targeted /innovative industries – Forge industry and government alliances © 2009 Eduventures, Inc. 15