Download as PDF, PPTX


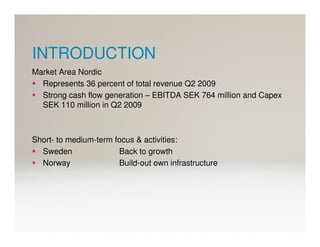


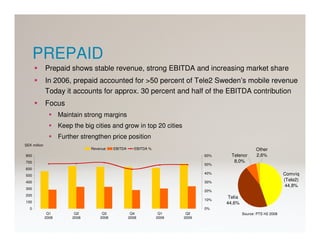
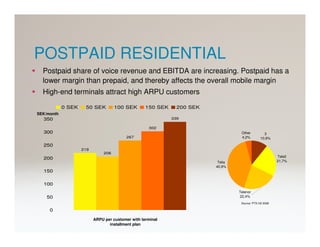
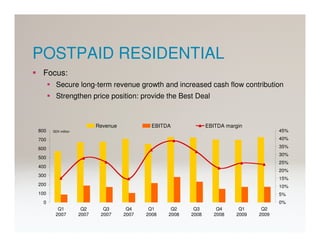
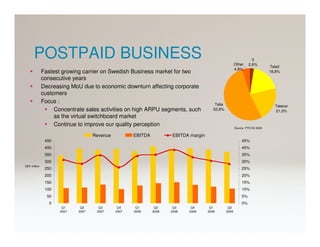
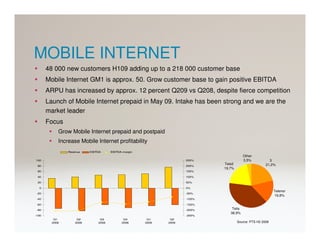


The Nordic market area represents 36% of Tele2's total revenue in Q2 2009. Tele2 Sweden aims to return to growth by capitalizing on its customer base and building out its own infrastructure in Norway. In Sweden, Tele2 will focus on maintaining its strong prepaid margins while growing its postpaid business to increase long-term revenue and cash flow. Tele2 provides the best deals through competitive pricing and multi-channel distribution to grow its customer base and market share.


