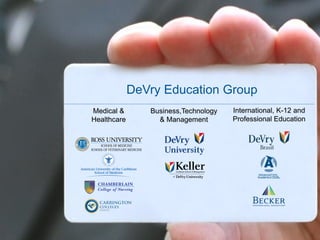
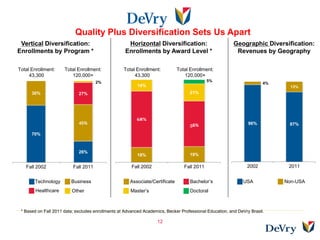
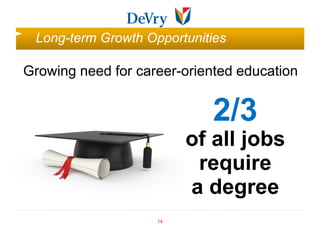
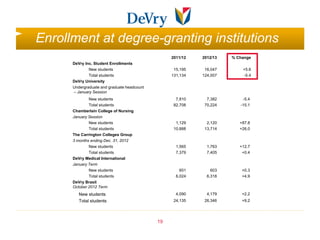
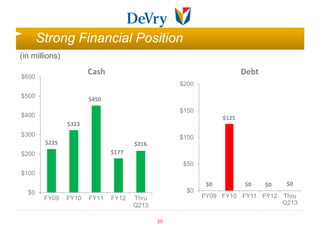
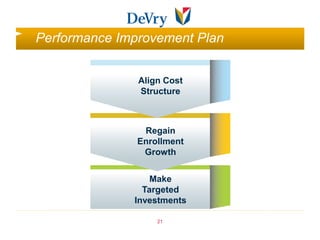
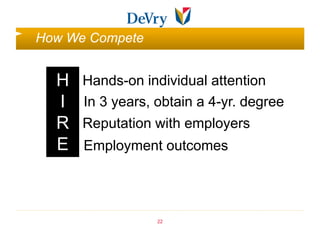
Quality + Diversification = Growth


Credit Suisse Growth Services Conference
               March 13, 2013
Certain statements contained in this presentation concerning DeVry’s
future performance, including those statements concerning DeVry’s
expectations or plans, may constitute forward-looking statements
subject to the Safe Harbor Provision of the Private Securities
Litigation Reform Act of 1995. These forward-looking statements
generally can be identified by phrases such as DeVry Inc. or its
management “believes,” “expects,” “anticipates,” “foresees,”
“forecasts,” “estimates” or other words or phrases of similar import.
Actual results may differ materially from those projected or implied by
these forward-looking statements. Potential risks, uncertainties and
other factors that could cause results to differ are described more fully
in Item 1A, “Risk Factors,” in DeVry’s most recent Annual Report on
Form 10-K for the year ending June 30, 2012 and filed with the
Securities and Exchange Commission on August 28, 2012.

                                    2



                 DeVry Education Group
    Medical &       Business,Technology   International, K-12 and
    Healthcare        & Management        Professional Education


                      3
Formula for Creating Value


Quality + Diversification = Growth


                    4
Investment in education technology


                    5
Facility Expansion


6
Investments in Academic Quality


                       Developing
                         our Faculty


                   7
Accreditor Approvals


Higher Learning Commission       Dominica Medical Board


                             8
Student Outcomes


               94%+ NCLEX
                                           Pass Rates


                                                      9
NCLEX pass rate through the first 9 months of 2012.
Student Outcomes


               86/
                 43
                                                                                     10
Six-session average ending February 2012; excludes graduates continuing their education, foreign graduates ineligible to work in the U.S./Canada and those unable to
accept career advising assistance. Excludes graduates who actively pursued employment for less than 180 days and did not become employed. Information presented
is based on graduate-provided data.
Student Outcomes


        95% USMLE
                                    Pass Rate


                                                            11
Pass rates for Step 1 of the U.S. Medical Licensing Exam.
Quality Plus Diversification Sets Us Apart
 Vertical Diversification:                           Horizontal Diversification:                         Geographic Diversification:
Enrollments by Program *                            Enrollments by Award Level *                          Revenues by Geography

Total Enrollment:     Total Enrollment:            Total Enrollment:          Total Enrollment:
     43,300              120,000+                       43,300                   120,000+
                                       2%                                                    5%
                                      2%                                                                               4%
                                                         14%                                                                  13%
      30%                    27%                                                    21%


                                                         68%
                             45%                                                    56%                         96%          87%

      70%


                             26%
                                                         18%                        19%

   Fall 2002              Fall 2011                    Fall 2002                 Fall 2011                     2002          2011


       Technology        Business                     Associate/Certificate         Bachelor’s               USA            Non-USA
        Healthcare       Other                        Master’s                      Doctoral


 * Based on Fall 2011 data; excludes enrollments at Advanced Academics, Becker Professional Education, and DeVry Brasil.

                                                                   12
Quality + Diversification = Growth
Long-term Growth Opportunities

Growing need for career-oriented education


                             2/3
                         of all jobs
                          require
                         a degree
                    14
Difference in Lifetime Earnings


                    15
Return on Educational Investment (ROEI)
             Electronics & Computer Tech.                       20%
                              Accounting                                        30%
                         Respiratory Care                                                   47%
Associate            Web Graphic Design                                                           50%
                           Dental Hygiene                                                           53%
                 Network Systems Admin.                                                                   57%


                 Business Administration                            22%
             Biomedical Engineering Tech.                                 26%
              Networking & Comm. Mgmt.                                    27%
Bachelor’s
               Computer Information Sys.                                        30%
                         Technical Mgmt.                                        31%
                             Nursing (RN)                                                   46%


             Doctor of Veterinary Medicine              13%
                       Doctor of Medicine                     18%
 Graduate
                                     MBA                                    29%
                                             0%   10%         20%         30%         40%   50%           60%
                                                  16
Public Sector Constrained


       “Cal State cuts
       165,000 seats…”

                   17
FY13 First Six Months Results
     Revenue                Net Income
$1,004         $988
                           $82

                                     $66


FY12           FY13        FY12      FY13


                      18
Enrollment at degree-granting institutions
                                                  2011/12   2012/13   % Change
      DeVry Inc. Student Enrollments
              New students                         15,195    16,047       +5.6
              Total students                      131,134   124,007       -5.4
      DeVry University
      Undergraduate and graduate headcount
      – January Session
              New students                          7,810     7,382       -5.4
              Total students                       82,708    70,224      -15.1
      Chamberlain College of Nursing
      January Session
              New students                          1,129     2,120      +87.8
              Total students                       10,888    13,714      +26.0
      The Carrington Colleges Group
      3 months ending Dec. 31, 2012
              New students                          1,565     1,763      +12.7
              Total students                        7,379     7,405       +0.4
      DeVry Medical International
      January Term
              New students                            601       603       +0.3
              Total students                        6,024     6,318       +4.9
      DeVry Brasil
      October 2012 Term
         New students                               4,090     4,179       +2.2
         Total students                            24,135    26,346       +9.2


                                             19
Strong Financial Position
(in millions)

$600
                       Cash                                          Debt
                                                 $200
$500
                       $450
                                                 $150
$400                                                          $125
                $323
$300                                             $100
        $225                         $216
$200                          $177
                                                 $50
$100
                                                         $0          $0     $0    $0
  $0                                              $0
        FY09    FY10   FY11   FY12   Thru               FY09 FY10 FY11 FY12      Thru
                                     Q213                                        Q213

                                            20
Performance Improvement Plan


               Align Cost
               Structure


                Regain
               Enrollment
                Growth


                  Make
                Targeted
              Investments

                   21
How We Compete


  H   Hands-on individual attention
  I   In 3 years, obtain a 4-yr. degree
  R   Reputation with employers
  E   Employment outcomes


                  22
DeVry’s Differentiation


    Gainful Employment        DeVry’s programs passed


       Private loans              Minimal Exposure


    Accreditation Risk        HLC and DMB Approvals


                         23
Quality + Diversification = Growth

Dv investor prez

  • 1.
    Quality + Diversification= Growth Credit Suisse Growth Services Conference March 13, 2013
  • 2.
    Certain statements containedin this presentation concerning DeVry’s future performance, including those statements concerning DeVry’s expectations or plans, may constitute forward-looking statements subject to the Safe Harbor Provision of the Private Securities Litigation Reform Act of 1995. These forward-looking statements generally can be identified by phrases such as DeVry Inc. or its management “believes,” “expects,” “anticipates,” “foresees,” “forecasts,” “estimates” or other words or phrases of similar import. Actual results may differ materially from those projected or implied by these forward-looking statements. Potential risks, uncertainties and other factors that could cause results to differ are described more fully in Item 1A, “Risk Factors,” in DeVry’s most recent Annual Report on Form 10-K for the year ending June 30, 2012 and filed with the Securities and Exchange Commission on August 28, 2012. 2
  • 3.
    DeVry Education Group Medical & Business,Technology International, K-12 and Healthcare & Management Professional Education 3
  • 4.
    Formula for CreatingValue Quality + Diversification = Growth 4
  • 5.
  • 6.
  • 7.
    Investments in AcademicQuality Developing our Faculty 7
  • 8.
    Accreditor Approvals Higher LearningCommission Dominica Medical Board 8
  • 9.
    Student Outcomes 94%+ NCLEX Pass Rates 9 NCLEX pass rate through the first 9 months of 2012.
  • 10.
    Student Outcomes 86/ 43 10 Six-session average ending February 2012; excludes graduates continuing their education, foreign graduates ineligible to work in the U.S./Canada and those unable to accept career advising assistance. Excludes graduates who actively pursued employment for less than 180 days and did not become employed. Information presented is based on graduate-provided data.
  • 11.
    Student Outcomes 95% USMLE Pass Rate 11 Pass rates for Step 1 of the U.S. Medical Licensing Exam.
  • 12.
    Quality Plus DiversificationSets Us Apart Vertical Diversification: Horizontal Diversification: Geographic Diversification: Enrollments by Program * Enrollments by Award Level * Revenues by Geography Total Enrollment: Total Enrollment: Total Enrollment: Total Enrollment: 43,300 120,000+ 43,300 120,000+ 2% 5% 2% 4% 14% 13% 30% 27% 21% 68% 45% 56% 96% 87% 70% 26% 18% 19% Fall 2002 Fall 2011 Fall 2002 Fall 2011 2002 2011 Technology Business Associate/Certificate Bachelor’s USA Non-USA Healthcare Other Master’s Doctoral * Based on Fall 2011 data; excludes enrollments at Advanced Academics, Becker Professional Education, and DeVry Brasil. 12
  • 13.
  • 14.
    Long-term Growth Opportunities Growingneed for career-oriented education 2/3 of all jobs require a degree 14
  • 15.
  • 16.
    Return on EducationalInvestment (ROEI) Electronics & Computer Tech. 20% Accounting 30% Respiratory Care 47% Associate Web Graphic Design 50% Dental Hygiene 53% Network Systems Admin. 57% Business Administration 22% Biomedical Engineering Tech. 26% Networking & Comm. Mgmt. 27% Bachelor’s Computer Information Sys. 30% Technical Mgmt. 31% Nursing (RN) 46% Doctor of Veterinary Medicine 13% Doctor of Medicine 18% Graduate MBA 29% 0% 10% 20% 30% 40% 50% 60% 16
  • 17.
    Public Sector Constrained “Cal State cuts 165,000 seats…” 17
  • 18.
    FY13 First SixMonths Results Revenue Net Income $1,004 $988 $82 $66 FY12 FY13 FY12 FY13 18
  • 19.
    Enrollment at degree-grantinginstitutions 2011/12 2012/13 % Change DeVry Inc. Student Enrollments New students 15,195 16,047 +5.6 Total students 131,134 124,007 -5.4 DeVry University Undergraduate and graduate headcount – January Session New students 7,810 7,382 -5.4 Total students 82,708 70,224 -15.1 Chamberlain College of Nursing January Session New students 1,129 2,120 +87.8 Total students 10,888 13,714 +26.0 The Carrington Colleges Group 3 months ending Dec. 31, 2012 New students 1,565 1,763 +12.7 Total students 7,379 7,405 +0.4 DeVry Medical International January Term New students 601 603 +0.3 Total students 6,024 6,318 +4.9 DeVry Brasil October 2012 Term New students 4,090 4,179 +2.2 Total students 24,135 26,346 +9.2 19
  • 20.
    Strong Financial Position (inmillions) $600 Cash Debt $200 $500 $450 $150 $400 $125 $323 $300 $100 $225 $216 $200 $177 $50 $100 $0 $0 $0 $0 $0 $0 FY09 FY10 FY11 FY12 Thru FY09 FY10 FY11 FY12 Thru Q213 Q213 20
  • 21.
    Performance Improvement Plan Align Cost Structure Regain Enrollment Growth Make Targeted Investments 21
  • 22.
    How We Compete H Hands-on individual attention I In 3 years, obtain a 4-yr. degree R Reputation with employers E Employment outcomes 22
  • 23.
    DeVry’s Differentiation Gainful Employment DeVry’s programs passed Private loans Minimal Exposure Accreditation Risk HLC and DMB Approvals 23
  • 24.