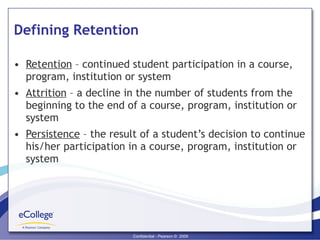
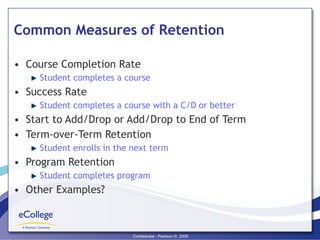
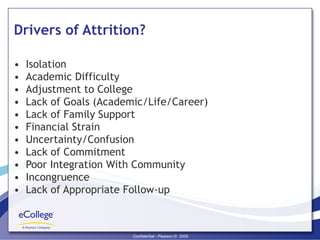
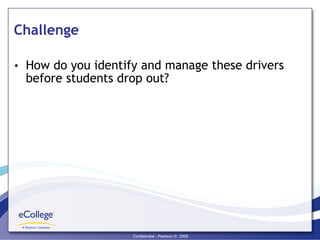
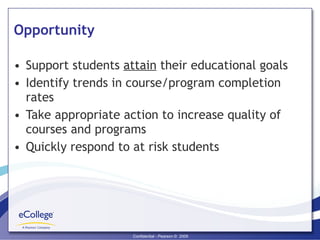
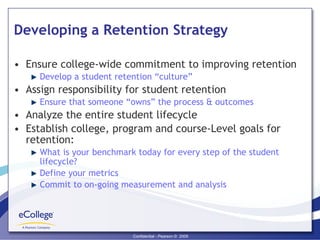
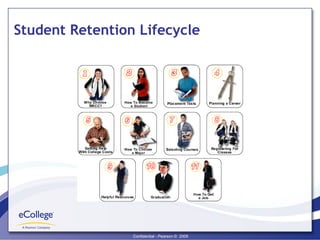
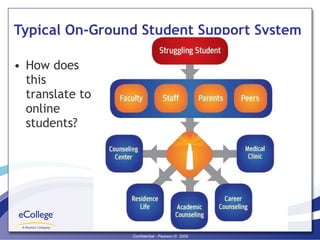
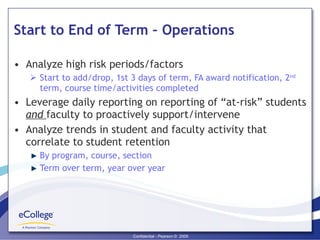
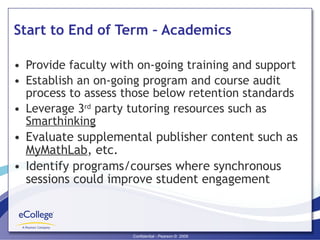
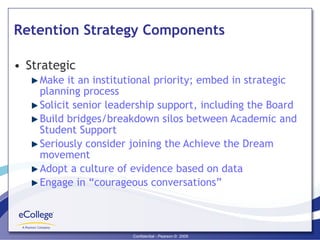
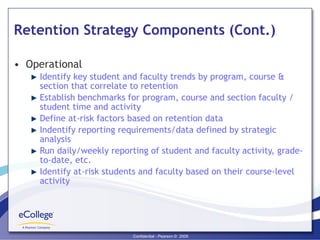
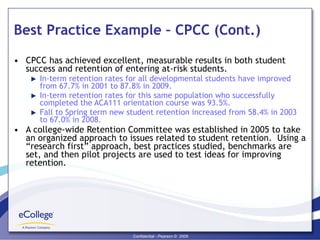
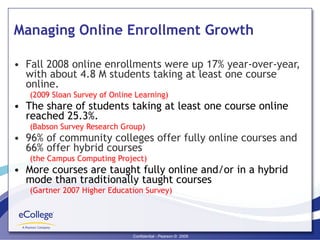
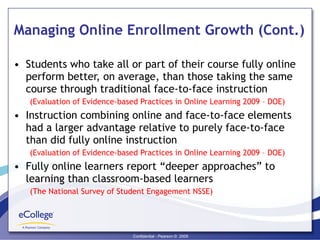
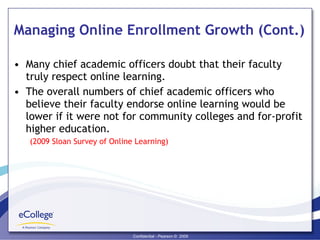
Fayetteville Technical Community College Teaching and Learning Summit 2/12/10 Executive Leadership Track Mike Alexander VP of National Accounts
Goals of Summit Examine  issues  that impact student success in  hybrid and online learning environments  at local community colleges in concert with local community needs Discuss solutions to these issues
Goals of Executive Leadership Track Examine the following issues at the  executive leadership level Student retention Enrollment Growth Partnering in Workforce Development Discuss best practices and solutions
Are Students Ready? More than half of 2007 ACT-tested high school graduates were not prepared to take a credit-bearing, entry level College Algebra course. (ACT) Deficits in basic skills cost businesses, colleges and states up to $17 billion annually in lost productivity and remedial costs.  (Achieve Inc.) 20% of graduating seniors at four-year colleges and  30% at two-year colleges  struggled with such basic quantitative tasks as balancing a checkbook, figuring out a tip, or determining the amount of interest on a loan.  (American Institutes for Research )
Are Students College-Ready? For every 100 9 th  graders: 68 graduate on time Of those, 40 enroll directly in college Of those, 27 are still enrolled the following year Of those, 18 earn an associates degree within 3 years or a bachelors within 6 years 82 don’t make it (National Center on Education and the Economy ncee.org)
Progress & Completion: CC Graduation Rates (2007)
Are Students Life-Ready? 2008 Oxford Survey of “Most Important Employee Skills” Employers said employees achieved 15% of these regularly
Defining Retention Retention  – continued student participation in a course, program, institution or system Attrition  – a decline in the number of students from the beginning to the end of a course, program, institution or system Persistence  – the result of a student’s decision to continue his/her participation in a course, program, institution or system
Common Measures of Retention Course Completion Rate  Student completes a course Success Rate  Student completes a course with a C/D or better Start to Add/Drop or Add/Drop to End of Term Term-over-Term Retention  Student enrolls in the next term Program Retention Student completes program Other Examples?
Drivers of Attrition? Isolation Academic Difficulty Adjustment to College Lack of Goals (Academic/Life/Career) Lack of Family Support Financial Strain Uncertainty/Confusion Lack of Commitment Poor Integration With Community Incongruence Lack of Appropriate Follow-up
Challenge How do you identify and manage these drivers before students drop out?
Opportunity Support students  attain  their educational goals Identify trends in course/program completion rates Take appropriate action to increase quality of courses and programs Quickly respond to at risk students
Developing a Retention Strategy Ensure college-wide commitment to improving retention Develop a student retention “culture” Assign responsibility for student retention Ensure that someone “owns” the process & outcomes Analyze the entire student lifecycle Establish college, program and course-Level goals for retention: What is your benchmark today for every step of the student lifecycle? Define your metrics Commit to on-going measurement and analysis
Prioritize Your Efforts “Top 10/Bottom 10” Specific programs Developmental/Gateway courses   Key elements of the new student experience Enroll to start? Start to add/drop? Add/drop to end of term?
Prioritize Your Efforts (Cont.) Identify and define your at-risk factors Course activity/engagement Prior grades Course load Job situation First time online student When the student enrolled Others?
Student Retention Lifecycle
Beatty - Guenter
Student Retention Lifecycle
Typical On-Ground Student Support System How does this translate to online students?
Enroll to Start Common for 20%-50% of newly enrolled online students not to start Survey past dropped students to begin identifying risk factors Survey and segment the population of starting students based on “readiness” and risk factors Target discrete segments and not the whole universe Provide pro-active messaging and services to individual students based on their needs – writing skills, math skills, time management, etc.
Enroll to Start (Cont.) Preparing the student for the online experience – setting the right expectations Orientation to your institution’s online experience – navigation, assignments, threaded discussions, synchronous activities Prior to start Establish full plan for course of study Assign an advisor to the student – “warm transfer”
Start to End of Term – Operations Analyze high risk periods/factors Start to add/drop, 1st 3 days of term, FA award notification, 2 nd  term, course time/activities completed  Leverage daily reporting on reporting of “at-risk” students  and  faculty to proactively support/intervene  Analyze trends in student and faculty activity that correlate to student retention By program, course, section Term over term, year over year
Start to End of Term – Academics Provide faculty with on-going training and support Establish an on-going program and course audit process to assess those below retention standards Leverage 3 rd  party tutoring resources such as  Smarthinking Evaluate supplemental publisher content such as  MyMathLab , etc. Identify programs/courses where synchronous sessions could improve student engagement
Retention Strategy Components Strategic  Make it an institutional priority; embed in strategic planning process Solicit senior leadership support, including the Board Build bridges/breakdown silos between Academic and Student Support Seriously consider joining the Achieve the Dream movement Adopt a culture of evidence based on data Engage in “courageous conversations”
Retention Strategy Components (Cont.) Operational  Identify key student and faculty trends by program, course & section that correlate to retention Establish benchmarks for program, course and section faculty / student time and activity Define at-risk factors based on retention data Indentify reporting requirements/data defined by strategic analysis Run daily/weekly reporting of student and faculty activity, grade-to-date, etc. Identify at-risk students and faculty based on their course-level activity
Retention Strategy Components (Cont.) Support  Evaluate placement tests for effectiveness Make student orientations mandatory and meaningful (embed academic advising) Require study skills courses, such as ACA 111 and 112 Consider more “pairings” (student cohorts, faculty members with counselors/advisors, developmental courses with gateway courses) Accelerate developmental courses Consider more pre-requisites (English/Reading before History) Identify “at-risk” students based on Help Desk activity Offer professional development for faculty on advising/counseling (in addition to just teaching and learning methods)
Summary Gain and reinforce college-wide commitment to student retention Analyze the entire student lifecycle Leverage student and faculty activity data to identify key trends  Continually evaluate the “Top 10/Bottom 10” Implement a program and course audit and enhancement process  Evolve your retention metrics and process as your program evolves
Best Practice Example - CPCC In 2003, Central Piedmont Community College developed and began implementing an  Integrated Retention System  to address the needs of under-prepared students entering the College Components of the System fall under the Gates Foundation’s focus on post-secondary improvement and improving student access, retention and support  Components of the system include: Improved Student Services An expanded and improved model for high risk students operating from student success centers at each campus Two new assessment instruments to determine student learning cognitive styles and personality types An accelerated schedule (one week) of ACA111 for all entering high risk students – 40 sections planned for summer 2010
Best Practice Example – CPCC (Cont.) Improved faculty skills A faculty training series to integrate student learning styles and student success strategies into teaching An online supplemental instruction tutoring program for developmental English and reading Improved technology for student tracking An online student profile providing faculty and staff with access to demographic and performance data, student goals and assessment results A predictive modeling/early warning program to identify students for intervention services
Best Practice Example – CPCC (Cont.) CPCC has achieved excellent, measurable results in both student success and retention of entering at-risk students. In-term retention rates for all developmental students have improved from 67.7% in 2001 to 87.8% in 2009. In-term retention rates for this same population who successfully completed the ACA111 orientation course was 93.5%. Fall to Spring term new student retention increased from 58.4% in 2003 to 67.0% in 2008. A college-wide Retention Committee was established in 2005 to take an organized approach to issues related to student retention.  Using a “research first” approach, best practices studied, benchmarks are set, and then pilot projects are used to test ideas for improving retention.
Managing Online Enrollment Growth Fall 2008 online enrollments were up 17% year-over-year, with about 4.8 M students taking at least one course online. (2009 Sloan Survey of Online Learning) The share of students taking at least one course online reached 25.3%. (Babson Survey Research Group) 96% of community colleges offer fully online courses and 66% offer hybrid courses (the Campus Computing Project) More courses are taught fully online and/or in a hybrid mode than traditionally taught courses (Gartner 2007 Higher Education Survey)
Managing Online Enrollment Growth (Cont.) Students who take all or part of their course fully online perform better, on average, than those taking the same course through traditional face-to-face instruction (Evaluation of Evidence-based Practices in Online Learning 2009 – DOE) Instruction combining online and face-to-face elements had a larger advantage relative to purely face-to-face than did fully online instruction (Evaluation of Evidence-based Practices in Online Learning 2009 – DOE) Fully online learners report “deeper approaches” to learning than classroom-based learners (The National Survey of Student Engagement NSSE)
Managing Online Enrollment Growth (Cont.) Many chief academic officers doubt that their faculty truly respect online learning. The overall numbers of chief academic officers who believe their faculty endorse online learning would be lower if it were not for community colleges and for-profit higher education. (2009 Sloan Survey of Online Learning)
Enrollment Growth = Staffing Growth Student to Teacher Ratio F2F: 17-19 (Best Practice) Online: 30-35 (Best Practice) Student to Advisor Growth UoP: 730:1 Average: 150:1
Enrollment Growth: Faculty Considerations Course Development Help (Shop) Faculty Mentors Use Student Services for At-Risk Follow-up Encourage (Train On) Differentiated Tools For Same Outcomes/Less Work Curriculum Integration Events Standardize Nomenclature, Templates, Etc.
eLearning Platforms 57% of higher education institutions are supported by two or more e-learning platforms. Although commercial e-learning platforms are still in the majority, there is a clear movement in the market toward more OSS e-learning platforms. (Gartner 2007 Higher Education Survey) The maturity of the Internet, along with major advances in software design and security, have positioned Software-as-a-Service (SaaS) as the way IT services will be purchased and delivered in the future. (campus technology.com 7/08)
Partnering in Workforce Development Create “fast-track job training programs that support displaced workers complete job training as quickly as possible Offer degree programs that prepare individuals for careers in “fast  growing” occupations Work closely with community agencies to connect displaced workers with resources for advancing their educational credentials Offer free information sessions to help individuals better understand program offerings and the Workforce Investment Act (WIA) process
Partnering in Workforce Development (Cont.) Work closely with businesses to identify areas where jobs currently exist or may be in demand in the future Create a website that includes information about and links to resources that help individuals transition to new careers Work with local businesses to assist with customized training to   retain a competitive workforce or with outplacement services

FTCC - Executive Leadership Track

  • 1.
    Fayetteville Technical CommunityCollege Teaching and Learning Summit 2/12/10 Executive Leadership Track Mike Alexander VP of National Accounts
  • 2.
    Goals of SummitExamine issues that impact student success in hybrid and online learning environments at local community colleges in concert with local community needs Discuss solutions to these issues
  • 3.
    Goals of ExecutiveLeadership Track Examine the following issues at the executive leadership level Student retention Enrollment Growth Partnering in Workforce Development Discuss best practices and solutions
  • 4.
    Are Students Ready?More than half of 2007 ACT-tested high school graduates were not prepared to take a credit-bearing, entry level College Algebra course. (ACT) Deficits in basic skills cost businesses, colleges and states up to $17 billion annually in lost productivity and remedial costs. (Achieve Inc.) 20% of graduating seniors at four-year colleges and 30% at two-year colleges struggled with such basic quantitative tasks as balancing a checkbook, figuring out a tip, or determining the amount of interest on a loan. (American Institutes for Research )
  • 5.
    Are Students College-Ready?For every 100 9 th graders: 68 graduate on time Of those, 40 enroll directly in college Of those, 27 are still enrolled the following year Of those, 18 earn an associates degree within 3 years or a bachelors within 6 years 82 don’t make it (National Center on Education and the Economy ncee.org)
  • 6.
    Progress & Completion:CC Graduation Rates (2007)
  • 7.
    Are Students Life-Ready?2008 Oxford Survey of “Most Important Employee Skills” Employers said employees achieved 15% of these regularly
  • 8.
    Defining Retention Retention – continued student participation in a course, program, institution or system Attrition – a decline in the number of students from the beginning to the end of a course, program, institution or system Persistence – the result of a student’s decision to continue his/her participation in a course, program, institution or system
  • 9.
    Common Measures ofRetention Course Completion Rate Student completes a course Success Rate Student completes a course with a C/D or better Start to Add/Drop or Add/Drop to End of Term Term-over-Term Retention Student enrolls in the next term Program Retention Student completes program Other Examples?
  • 10.
    Drivers of Attrition?Isolation Academic Difficulty Adjustment to College Lack of Goals (Academic/Life/Career) Lack of Family Support Financial Strain Uncertainty/Confusion Lack of Commitment Poor Integration With Community Incongruence Lack of Appropriate Follow-up
  • 11.
    Challenge How doyou identify and manage these drivers before students drop out?
  • 12.
    Opportunity Support students attain their educational goals Identify trends in course/program completion rates Take appropriate action to increase quality of courses and programs Quickly respond to at risk students
  • 13.
    Developing a RetentionStrategy Ensure college-wide commitment to improving retention Develop a student retention “culture” Assign responsibility for student retention Ensure that someone “owns” the process & outcomes Analyze the entire student lifecycle Establish college, program and course-Level goals for retention: What is your benchmark today for every step of the student lifecycle? Define your metrics Commit to on-going measurement and analysis
  • 14.
    Prioritize Your Efforts“Top 10/Bottom 10” Specific programs Developmental/Gateway courses Key elements of the new student experience Enroll to start? Start to add/drop? Add/drop to end of term?
  • 15.
    Prioritize Your Efforts(Cont.) Identify and define your at-risk factors Course activity/engagement Prior grades Course load Job situation First time online student When the student enrolled Others?
  • 16.
  • 17.
  • 18.
  • 19.
    Typical On-Ground StudentSupport System How does this translate to online students?
  • 20.
    Enroll to StartCommon for 20%-50% of newly enrolled online students not to start Survey past dropped students to begin identifying risk factors Survey and segment the population of starting students based on “readiness” and risk factors Target discrete segments and not the whole universe Provide pro-active messaging and services to individual students based on their needs – writing skills, math skills, time management, etc.
  • 21.
    Enroll to Start(Cont.) Preparing the student for the online experience – setting the right expectations Orientation to your institution’s online experience – navigation, assignments, threaded discussions, synchronous activities Prior to start Establish full plan for course of study Assign an advisor to the student – “warm transfer”
  • 22.
    Start to Endof Term – Operations Analyze high risk periods/factors Start to add/drop, 1st 3 days of term, FA award notification, 2 nd term, course time/activities completed Leverage daily reporting on reporting of “at-risk” students and faculty to proactively support/intervene Analyze trends in student and faculty activity that correlate to student retention By program, course, section Term over term, year over year
  • 23.
    Start to Endof Term – Academics Provide faculty with on-going training and support Establish an on-going program and course audit process to assess those below retention standards Leverage 3 rd party tutoring resources such as Smarthinking Evaluate supplemental publisher content such as MyMathLab , etc. Identify programs/courses where synchronous sessions could improve student engagement
  • 24.
    Retention Strategy ComponentsStrategic Make it an institutional priority; embed in strategic planning process Solicit senior leadership support, including the Board Build bridges/breakdown silos between Academic and Student Support Seriously consider joining the Achieve the Dream movement Adopt a culture of evidence based on data Engage in “courageous conversations”
  • 25.
    Retention Strategy Components(Cont.) Operational Identify key student and faculty trends by program, course & section that correlate to retention Establish benchmarks for program, course and section faculty / student time and activity Define at-risk factors based on retention data Indentify reporting requirements/data defined by strategic analysis Run daily/weekly reporting of student and faculty activity, grade-to-date, etc. Identify at-risk students and faculty based on their course-level activity
  • 26.
    Retention Strategy Components(Cont.) Support Evaluate placement tests for effectiveness Make student orientations mandatory and meaningful (embed academic advising) Require study skills courses, such as ACA 111 and 112 Consider more “pairings” (student cohorts, faculty members with counselors/advisors, developmental courses with gateway courses) Accelerate developmental courses Consider more pre-requisites (English/Reading before History) Identify “at-risk” students based on Help Desk activity Offer professional development for faculty on advising/counseling (in addition to just teaching and learning methods)
  • 27.
    Summary Gain andreinforce college-wide commitment to student retention Analyze the entire student lifecycle Leverage student and faculty activity data to identify key trends Continually evaluate the “Top 10/Bottom 10” Implement a program and course audit and enhancement process Evolve your retention metrics and process as your program evolves
  • 28.
    Best Practice Example- CPCC In 2003, Central Piedmont Community College developed and began implementing an Integrated Retention System to address the needs of under-prepared students entering the College Components of the System fall under the Gates Foundation’s focus on post-secondary improvement and improving student access, retention and support Components of the system include: Improved Student Services An expanded and improved model for high risk students operating from student success centers at each campus Two new assessment instruments to determine student learning cognitive styles and personality types An accelerated schedule (one week) of ACA111 for all entering high risk students – 40 sections planned for summer 2010
  • 29.
    Best Practice Example– CPCC (Cont.) Improved faculty skills A faculty training series to integrate student learning styles and student success strategies into teaching An online supplemental instruction tutoring program for developmental English and reading Improved technology for student tracking An online student profile providing faculty and staff with access to demographic and performance data, student goals and assessment results A predictive modeling/early warning program to identify students for intervention services
  • 30.
    Best Practice Example– CPCC (Cont.) CPCC has achieved excellent, measurable results in both student success and retention of entering at-risk students. In-term retention rates for all developmental students have improved from 67.7% in 2001 to 87.8% in 2009. In-term retention rates for this same population who successfully completed the ACA111 orientation course was 93.5%. Fall to Spring term new student retention increased from 58.4% in 2003 to 67.0% in 2008. A college-wide Retention Committee was established in 2005 to take an organized approach to issues related to student retention. Using a “research first” approach, best practices studied, benchmarks are set, and then pilot projects are used to test ideas for improving retention.
  • 31.
    Managing Online EnrollmentGrowth Fall 2008 online enrollments were up 17% year-over-year, with about 4.8 M students taking at least one course online. (2009 Sloan Survey of Online Learning) The share of students taking at least one course online reached 25.3%. (Babson Survey Research Group) 96% of community colleges offer fully online courses and 66% offer hybrid courses (the Campus Computing Project) More courses are taught fully online and/or in a hybrid mode than traditionally taught courses (Gartner 2007 Higher Education Survey)
  • 32.
    Managing Online EnrollmentGrowth (Cont.) Students who take all or part of their course fully online perform better, on average, than those taking the same course through traditional face-to-face instruction (Evaluation of Evidence-based Practices in Online Learning 2009 – DOE) Instruction combining online and face-to-face elements had a larger advantage relative to purely face-to-face than did fully online instruction (Evaluation of Evidence-based Practices in Online Learning 2009 – DOE) Fully online learners report “deeper approaches” to learning than classroom-based learners (The National Survey of Student Engagement NSSE)
  • 33.
    Managing Online EnrollmentGrowth (Cont.) Many chief academic officers doubt that their faculty truly respect online learning. The overall numbers of chief academic officers who believe their faculty endorse online learning would be lower if it were not for community colleges and for-profit higher education. (2009 Sloan Survey of Online Learning)
  • 34.
    Enrollment Growth =Staffing Growth Student to Teacher Ratio F2F: 17-19 (Best Practice) Online: 30-35 (Best Practice) Student to Advisor Growth UoP: 730:1 Average: 150:1
  • 35.
    Enrollment Growth: FacultyConsiderations Course Development Help (Shop) Faculty Mentors Use Student Services for At-Risk Follow-up Encourage (Train On) Differentiated Tools For Same Outcomes/Less Work Curriculum Integration Events Standardize Nomenclature, Templates, Etc.
  • 36.
    eLearning Platforms 57%of higher education institutions are supported by two or more e-learning platforms. Although commercial e-learning platforms are still in the majority, there is a clear movement in the market toward more OSS e-learning platforms. (Gartner 2007 Higher Education Survey) The maturity of the Internet, along with major advances in software design and security, have positioned Software-as-a-Service (SaaS) as the way IT services will be purchased and delivered in the future. (campus technology.com 7/08)
  • 37.
    Partnering in WorkforceDevelopment Create “fast-track job training programs that support displaced workers complete job training as quickly as possible Offer degree programs that prepare individuals for careers in “fast growing” occupations Work closely with community agencies to connect displaced workers with resources for advancing their educational credentials Offer free information sessions to help individuals better understand program offerings and the Workforce Investment Act (WIA) process
  • 38.
    Partnering in WorkforceDevelopment (Cont.) Work closely with businesses to identify areas where jobs currently exist or may be in demand in the future Create a website that includes information about and links to resources that help individuals transition to new careers Work with local businesses to assist with customized training to retain a competitive workforce or with outplacement services