The document provides an overview of India's large population and growing economy. Some key points:
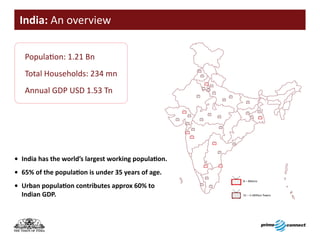
- India has a population of over 1.21 billion people, with over 60% under age 35 and urban population contributing 60% of GDP.
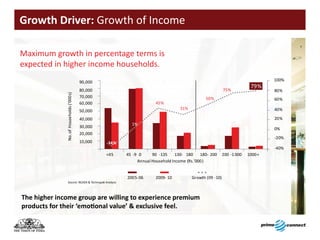
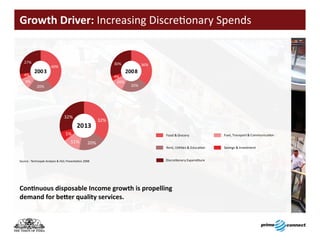
- Household income is increasing significantly across income brackets, fueling more discretionary spending.
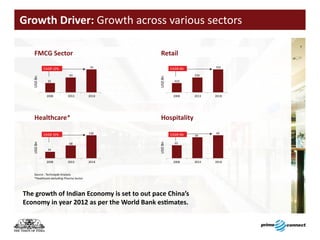
- Many sectors like FMCG, retail, healthcare and hospitality are experiencing strong growth of 6-15% annually.
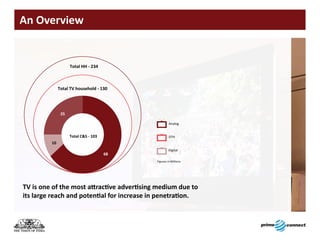
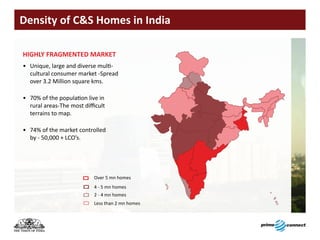
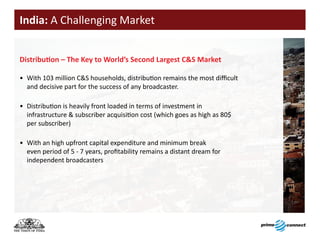
- Television is a major advertising medium due to its large reach, though distribution challenges remain due to a fragmented market of over 50,000 cable operators.
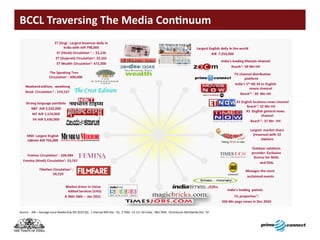
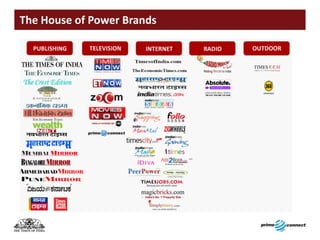
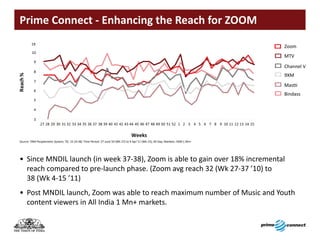
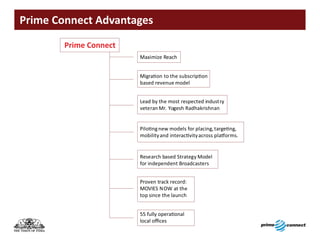
- The document introduces Prime Connect as an independent distribution platform that aims to organize channel distribution through various digital platforms