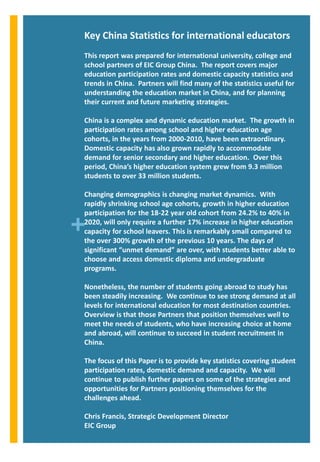
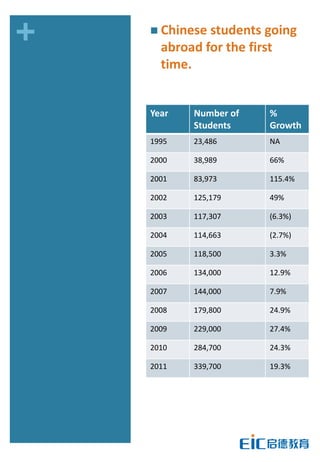
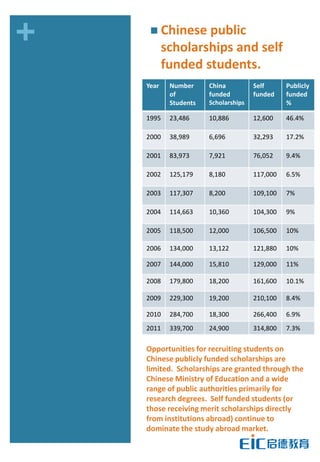
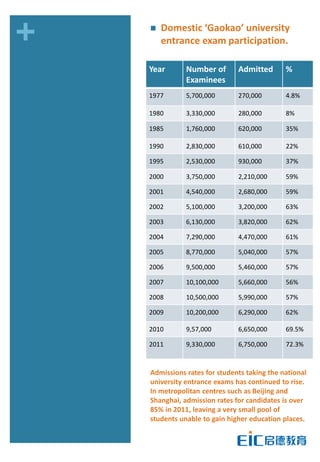
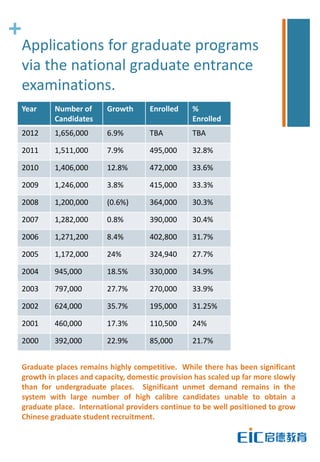
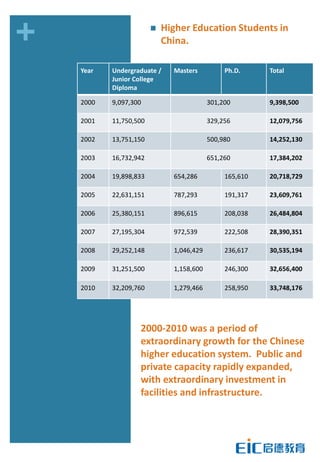
SlideShare a Scribd company logo
1 of 32
Download to read offline
+


    Key China Education
    Statistics for
    international educators
    A report for EIC Group China partners

    November 2011


                        partners.eic.org.cn
Key China Statistics for international educators
This report was prepared for international university, college and
school partners of EIC Group China. The report covers major
education participation rates and domestic capacity statistics and
trends in China. Partners will find many of the statistics useful for
understanding the education market in China, and for planning
their current and future marketing strategies.

China is a complex and dynamic education market. The growth in
participation rates among school and higher education age
cohorts, in the years from 2000-2010, have been extraordinary.
Domestic capacity has also grown rapidly to accommodate
demand for senior secondary and higher education. Over this
period, Chinaā€™s higher education system grew from 9.3 million
students to over 33 million students.

Changing demographics is changing market dynamics. With
rapidly shrinking school age cohorts, growth in higher education
participation for the 18-22 year old cohort from 24.2% to 40% in

+
2020, will only require a further 17% increase in higher education
capacity for school leavers. This is remarkably small compared to
the over 300% growth of the previous 10 years. The days of
significant ā€œunmet demandā€ are over, with students better able to
choose and access domestic diploma and undergraduate
programs.

Nonetheless, the number of students going abroad to study has
been steadily increasing. We continue to see strong demand at all
levels for international education for most destination countries.
Overview is that those Partners that position themselves well to
meet the needs of students, who have increasing choice at home
and abroad, will continue to succeed in student recruitment in
China.

The focus of this Paper is to provide key statistics covering student
participation rates, domestic demand and capacity. We will
continue to publish further papers on some of the strategies and
opportunities for Partners positioning themselves for the
challenges ahead.

Chris Francis, Strategic Development Director
EIC Group
+   ļ® Chinese students going
      abroad for the first
      time.


    Year   Number of   %
           Students    Growth
    1995   23,486      NA

    2000   38,989      66%

    2001   83,973      115.4%

    2002   125,179     49%

    2003   117,307     (6.3%)

    2004   114,663     (2.7%)

    2005   118,500     3.3%

    2006   134,000     12.9%

    2007   144,000     7.9%

    2008   179,800     24.9%

    2009   229,000     27.4%

    2010   284,700     24.3%

    2011   339,700     19.3%
+    ļ® Chinese     public
           scholarships and self
           funded students.
    Year    Number     China          Self      Publicly
            of         funded         funded    funded
            Students   Scholarships             %

    1995    23,486     10,886         12,600    46.4%

    2000    38,989     6,696          32,293    17.2%

    2001    83,973     7,921          76,052    9.4%

    2002    125,179    8,180          117,000   6.5%

    2003    117,307    8,200          109,100   7%

    2004    114,663    10,360         104,300   9%

    2005    118,500    12,000         106,500   10%

    2006    134,000    13,122         121,880   10%

    2007    144,000    15,810         129,000   11%

    2008    179,800    18,200         161,600   10.1%

    2009    229,300    19,200         210,100   8.4%

    2010    284,700    18,300         266,400   6.9%
    2011    339,700    24,900         314,800   7.3%

    Opportunities for recruiting students on
    Chinese publicly funded scholarships are
    limited. Scholarships are granted through the
    Chinese Ministry of Education and a wide
    range of public authorities primarily for
    research degrees. Self funded students (or
    those receiving merit scholarships directly
    from institutions abroad) continue to
    dominate the study abroad market.
+   ļ®   Domestic ā€˜Gaokaoā€™ university
        entrance exam participation.

    Year       Number of       Admitted       %
               Examinees
    1977       5,700,000       270,000        4.8%

    1980       3,330,000       280,000        8%

    1985       1,760,000       620,000        35%

    1990       2,830,000       610,000        22%

    1995       2,530,000       930,000        37%

    2000       3,750,000       2,210,000      59%

    2001       4,540,000       2,680,000      59%

    2002       5,100,000       3,200,000      63%

    2003       6,130,000       3,820,000      62%

    2004       7,290,000       4,470,000      61%

    2005       8,770,000       5,040,000      57%

    2006       9,500,000       5,460,000      57%

    2007       10,100,000      5,660,000      56%

    2008       10,500,000      5,990,000      57%

    2009       10,200,000      6,290,000      62%

    2010       9,57,000        6,650,000      69.5%

    2011       9,330,000       6,750,000      72.3%


    Admissions rates for students taking the national
    university entrance exams has continued to rise.
    In metropolitan centres such as Beijing and
    Shanghai, admission rates for candidates is over
    85% in 2011, leaving a very small pool of
    students unable to gain higher education places.
+   ļ® Notes on Gaokao
        statistics
    ļ®   1977-1980 high examinee numbers driven
        by resumption of exams after Cultural
        Revolution.

    ļ®   Participation rates in senior high school
        increasing rapidly during this period.

    ļ®   Not all high school graduates take exam.
        Statistics indicative of demand for
        domestic undergraduate places.

    ļ®   Peak year in 2008 for absolute numbers of
        examinees.

    ļ®   High school participation rate continues to
        grow though school age cohorts in
        significant decline.

    ļ®   Chinese Ministry of Education objective to
        grow senior high school participation rate
        of the 15-17 age cohort from 82.5% in
        2010 to 90% by 2020.

    ļ®   Increase in demand driven primarily by
        increase in participation in age cohort.

    ļ®   Age cohort declining reflected in reduction
        in examinees after 2008, despite higher
        participation rate.
+
Applications for graduate programs
via the national graduate entrance
examinations.
Year     Number of      Growth      Enrolled     %
         Candidates                              Enrolled
2012     1,656,000      6.9%        TBA          TBA

2011     1,511,000      7.9%        495,000      32.8%

2010     1,406,000      12.8%       472,000      33.6%

2009     1,246,000      3.8%        415,000      33.3%

2008     1,200,000      (0.6%)      364,000      30.3%

2007     1,282,000      0.8%        390,000      30.4%

2006     1,271,200      8.4%        402,800      31.7%

2005     1,172,000      24%         324,940      27.7%

2004     945,000        18.5%       330,000      34.9%

2003     797,000        27.7%       270,000      33.9%

2002     624,000        35.7%       195,000      31.25%

2001     460,000        17.3%       110,500      24%

2000     392,000        22.9%       85,000       21.7%


Graduate places remains highly competitive. While there has been significant
growth in places and capacity, domestic provision has scaled up far more slowly
than for undergraduate places. Significant unmet demand remains in the
system with large number of high calibre candidates unable to obtain a
graduate place. International providers continue to be well positioned to grow
Chinese graduate student recruitment.
+                       ļ®   Higher Education Students in
                            China.

    Year   Undergraduate /    Masters          Ph.D.     Total
           Junior College
           Diploma

    2000   9,097,300                      301,200        9,398,500

    2001   11,750,500                     329,256        12,079,756

    2002   13,751,150                     500,980        14,252,130

    2003   16,732,942                     651,260        17,384,202

    2004   19,898,833         654,286          165,610   20,718,729

    2005   22,631,151         787,293          191,317   23,609,761

    2006   25,380,151         896,615          208,038   26,484,804

    2007   27,195,304         972,539          222,508   28,390,351

    2008   29,252,148         1,046,429        236,617   30,535,194

    2009   31,251,500         1,158,600        246,300   32,656,400

    2010   32,209,760         1,279,466        258,950   33,748,176


                   2000-2010 was a period of
                   extraordinary growth for the Chinese
                   higher education system. Public and
                   private capacity rapidly expanded,
                   with extraordinary investment in
                   facilities and infrastructure.
+      ļ®     Participation rates in secondary
             and higher education in China.
    Year      Junior          Senior          Higher
              secondary       secondary       education
              (12-14 years)   (15-17 years)   (18-22 years)
    1990      66.7%           21.9%           3.4%

    1995      78.4%           33.6%           7.2%

    2000      88.6%           42.8%           12.5%

    2001      88.7%           42.8%           13.3%

    2002      90.0%           42.8%           15.0%

    2003      92.7%           43.8%           17.0%

    2004      94.1%           48.1%           19.0%

    2005      95.0%           52.7%           21.0%

    2006      97%             59.8%           22.0%

    2007      98%             66%             23.0%

    2008      98.5%           74%             23.3%

    2009      99%             79.2%           24.2%

    2010      100%            82.5%           26.5%

    2020      100%            90%             40%
    Target


    Growth in secondary and higher education
    has been driven by rapidly increasing
    participation rates, more than by age cohort
    growth. Ahead, with declining
    demographics, participation rates will climb
    to 40% by 2020 with only incremental growth
    in higher education places.
+International students
 coming to Chinaā€¦.
 China becomes a major destination
 countryā€¦.
  Year        Number of             % Growth
              Students
  2000        52,150                NA
  2001        61,869                18.6%
  2002        85,829                38.7%
  2003        77,715                (9.45%)
  2004        110,844               42.6%
  2005        141,087               27.3%
  2006        162,695               15.3%
  2007        195,503               20.2%
  2008        223,449               14.3%
  2009        238,184               6.6%
  2010        265,090               11.3%
  2011        292,611               10.4%

  2011 Summary
  25,687 international students in China on Chinese government scholarships.
  ā€¢ Major sending countries in order: Korea (66,442), USA (23,292), Japan
      (17,961), Thailand (14,145), Vietnam (13,549), Russia (13,340), Indonesia
      (10,957), India (9,370), Kazakhstan (8,287), Pakistan (8,516), France
      (7,592), Mongolia (7,112) and Germany (5,451).
  ā€¢ 118,837 students on award (Bachelors, Masters & Doctoral programs) and
      173,774 students on non-award programs.
  ā€¢ The Ministry of Education announced that by 2020, China intends to host
      500,000 international students and become the largest destination for
      overseas study for students from Asia.
+
Demographic decline
An example from Jiangsu Provinceā€¦

The pipeline shrinks by 29.2% to 2015
             2006        2007        2008        2009      2010


Year 7 new 990,600       946,600     865,800     779,000   701,040
students


             2006        2007        2008        2009      2010
Year 9       1,213,500   1,115,200   1,024,300   962,800   914,000
graduates

Growth       NA          (12.87%)    (9.88%)     (1.64%)   (3.3%)

              2006       2007        2008        2009      2010
Year 12       449,700    522,400     499,100     513,100   486,400
Mainstream

Year 12       243,200    265,700     289,400     301,200   264,600
Vocational
Total         692,900    788,100     788,500     814,300   751,000


Jiangsu Province serves as a good example of the
demographic decline in school age cohorts. In the 5 years
from 2006-2010, the Year 7 cohort declined by 29.2%.
This cohort graduates in 2015 and faces less competition
than any other in history in a greatly expanded domestic
university system. Age cohort participation in higher
education in Jiangsu has already reached 40%.
+
Demographic decline
An example from Hunan Provinceā€¦

The closing ā€œunmet demandā€ gapā€¦.

      Hunan Students taking University Entrance Exams
      2006-2010. Candidates vs. Admissions. (1,000s)
    600
    500
    400
    300                                                 Admitted
    200                                                 Candidates
    100
      0
             2006 2007 2008 2009 2010

       Admission rates of Hunan students into higher
       education 2006-2010

100.00%
    80.00%
    60.00%
    40.00%
    20.00%
    0.00%
                2006 2007 2008 2009 2010
Regional reports.
The statistics below outline the regional context of Chinese
education. Given that many Provinces represent a far larger
opportunity for international educators than the traditional
metropolitan centers of Beijing, Shanghai and Guangzhou, a
regional strategy is a mid-to-long term necessity.

The Report does not cover how many Chinese students are
recruited for overseas education from each Province or region or
into which destination markets. Currently, reliable figures for this
are not available, with no foreign Embassies publicly releasing
student visa statistics with a breakdown by Chinese geographic
region. Work with AEI, the British Council, Education USA and
other industry organizations to obtain greater understanding of
the regional markets you plan to enter.


+
The purpose of the brief regional profiles below is to offer insights
into the scope of the opportunity by region, rather than a detailed
strategy on how to undertake regional marketing in China. Each
Partner has differing recruitment needs, resources and
considerations when setting regional objectives.

At EIC Group China, we strongly encourage our Partners to visit
our regional offices and to join our major events held in March,
June and October each year across 17 key regions of China.

Beyond this, there are many solutions providers in both China and
abroad that can support online marketing and branding in
Chinese to create a ā€˜digital solutionā€™ to the regional issue. EICā€™s
Partner Services unit also offers solutions for online branding and
marketing. Many Partners have internal staff and student
resources capable of supporting these efforts at low or no cost.
EIC will be releasing a paper soon on how to undertake low or no
cost branding efforts online in China.


Chris Francis, Strategic Development Director
EIC Group
+                   ļ®   Sources of Chinese Higher
                        Education Students by Province
                        2010.
    Province /   Undergraduate        Masters     Ph.D.      Total
    Municipality / Junior College     students    students   Higher
                 Diploma                                     Education
                 students                                    Students

    Beijing        747,228            30,964      14,652     792,884

    Tianjin        419,398            18,341      3,423      441,162

    Hebei          1,596,100          75,796      11,769     1,683,665

    Shanxi         1,036,313          49,184      7,573      1,093,070

    Inner          754,542            27,094      4,378      786,014
    Mongolia

    Liaoning       1,124,484          54,482      13,153     1,192,119

    Jilin          671,527            40,382      9,152      721,061

    Heilongjiang   943,949            48,172      9,759      1,001,880

    Shanghai       711,506            29,247      14,510     755,263

    Jiangsu        2,332,012          79,167      16,069     2,427,428

    Zhejiang       1,578,375          35,084      9,512      1,622,971

    Anhui          1,410,782          63,953      10,270     1,485,005

    Fujian         958,845            22,044      4,796      985,685

    Jiangxi        986,470            40,345      5,961      1,032,776

    Shandong       2,281,973          157,609     23,819     2,463,401

    Henan          2,125,998          106,176     14,584     2,246,758

    Hubei          1,495,347          90,927      19,444     1,605,718

    Hunan          1,431,264          61,967      13,080     1,506,311


                   These statistics demonstrate where Chinese
                   universities are recruiting their own students. They
                   are particularly key for undergraduate recruitment,
                   showing that the bulk of domestic recruitment for
                   higher education is not in the major metropolitan
                   centres.
+                   ļ®   Sources of Chinese Higher
                        Education Students by Province
                        2010.

    Province /       Undergraduate Masters           Ph.D.    Total
    Municipality     / Junior College students       students Higher
                     Diploma                                  Education
                     students                                 students

    Guangdong        2,294,357         30,932        7,344       2,332,633

    Guangxi          865,168           15,264        2,648       883,080

    Hainan           193,754           3,539         553         197,846

    Chongqing        635,036           21,612        4,010       660,658

    Sichuan          1,547,166         50,986        11,398      1,609,550

    Guizhou          599,984           11,292        1,827       613,103

    Yunnan           752,373           13,823        3,161       769,357

    Tibet            52,923            973           130         52,026

    Shaā€™anxi         1,142,056         58,362        11,046      1,211,464

    Gansu            652,273           19,279        4,011       675,563

    Qinghai          134,004           2,667         608         137,279

    Ningxia          189,083           4,262         899         194,244

    Xinjiang         525,613           11,647        2,586       539,846

    Total            32,209,760        1,279,466     258,950     33,748,176


                   Again, these statistics reflect the origin of students,
                   not where they undertake higher education, which is
                   covered in the regional reports below. Thinking like
                   a Chinese higher education institution would require
                   identifying opportunities, partnerships and channels
                   to market into the major provinces covered in the
                   report. For undergraduate recruitment, targeting
                   students ā€˜at homeā€™ is key to successful recruitment.
Regional reportsā€¦

Beijing.
Population:19.612 million (12.567 million holding residence permits) (2010)
GDP: RMB1377.79 billion (2010)
Students: 2.687 million (2010)
Comprising:
               Kindergarten: 277,000
               Primary: 686,000
               Junior Middle School: 328,500
               Secondary Specialist / Vocational: 219,000
               Senior Middle School: 216,500
               Junior College Diploma and Undergraduate: 735,000
               Postgraduate: 225,000

University Entrance Exam articulation rates:
2000:75%
2006:72.88%
2010: 89.7%

Year 7 students:
2001:166,174
2006: 90,722
2009: 105,930

Year 9 students:
2001: 149,442
2006: 124,250
2009: 101,811

Year 12 graduates (mainstream high school):
2001: 51,263
2006:78,037
+
2009:70,132

Undergraduates
2001: 340,284
2006: 554,702
2009: 577,154

Graduating higher education students (undergraduate/junior college diploma
cohort)
2001: 55,831
2006: 132,488
2009: 152,336
Regional reportsā€¦
Shanghai
Population: 23.019 million (14.042 million holding residence permits) (2010)
GDP: RMB 1687.242 billion (2010)
Students: 2.8182 million (2010)
Comprising:
               Kindergarten: 400,300
               Primary: 865,800
               Junior Middle School: 464,850
               Secondary Specialist / Vocational: 157,600
               Senior Middle School: 208,250
               Junior College Diploma and Undergraduate: 609,700
               Postgraduate: 111,700

University Entrance Exam articulation rates:
2000:70%
2006:80.4%
2010:85%

Year 7 students:
2003:127,500
2006: 108,793
2009: 109,300

Year 9 students:
2003: 180,400
2006: 112,607
2009: 100,000

Year 12 graduates (mainstream high school):
2003:77,600
+
2006:121,900
2009:87,600

Undergraduates
2003: 378,500
2006: 466,300
2009: 512,800

Graduating higher education students (undergraduate/junior college diploma
cohort)
2003: 71,200
2006: 110,500
2009: 126,900
Regional reportsā€¦
Guangdong
Population: 104.3 million (million holding residence permits) (2010)
GDP: RMB4547.283 billion (2010)
Students: 21.3953 million (2010)
Comprising:
              Kindergarten: 2,772,300
              Primary: 8,485,500
              Junior Middle School: 5,001,000
              Secondary Specialist / Vocational: 1,547,800
              Senior Middle School: 2,089,500
              Junior College Diploma/Undergraduate: 1,426,700
              Postgraduate: 72,500

University Entrance Exam articulation rates:
2000: 65%
2006: 69.58%
2010: 78%

Year 7 students:
2001: 1,426,843
2006: 1,706,870
2010: 1,663,700

Year 9 students:
2004: 1,314,000
2006: 1,425,900
2010: 1,534,700

Year 12 graduates (mainstream high school):
2004: 318,000
+
2006: 429,900
2010: 567,600

Undergraduates
2001: 381,926
2006: 1,008,577
2010: 1,426,624

Graduating higher education students (undergraduate/junior college
diploma cohort)
2001: 62,000
2006: 196,000
2010: 334,200
Regional reportsā€¦
Tianjin
Population: 12.28 million (9.8 million holding residence permits).
GDP: RMB750 billion (2009)
Students: 1.79 million (2010)
Comprising:
                 Kindergarten: 217, 886
                 Primary:505,895
                 Junior Middle School: 273,408
                 Secondary Specialist / Vocational: 105,694
                 Senior Middle School: 185,153
                 Junior College Diploma: 155,608
                 Undergraduate: 273, 616
                 Postgraduate: 41,022

University Entrance Exam articulation rates:
2001:71.78%
2006:70.83%
2010:79%

Year 7 students:
2006: 104,243
2008: 84,245
2010: 83,891

Year 9 students:
2006: 124,325
2008: 98,490
2010: 93,464

Year 12 graduates (mainstream high school):
2006: 69,891
2008: 75,230

+
2010: 65,951

Undergraduates
2006: 212,526
2008: 240,510
2010: 273,616

Graduating higher education students (undergraduate/junior college diploma cohort)
2006: 81,983
2008: 101,728
2010: 105,354
Regional reportsā€¦
 Jiangsu
 Population: 76.54 million (2010)
 GDP: RMB4.09 trillion (2010)
 Students: 11.3 million (2010)
 Comprising:
                    Kindergarten: 833,100
                    Primary: 3,987,000 (participation rate 100%)
                    Junior Middle School: 2,329,500 (participation rate 98.7%)
                    Secondary Specialist / Vocational: 1,020,400
                    Senior Middle School: 1,356,600
                    Junior College Diploma / Undergraduate: 1,649,400
                    Postgraduate: 125,500


 University Entrance Exam articulation rates:
 2001:61.2%
 2006:70.71%
 2010: 77.9%


 Year 7 students:
 2006: 990,600
 2008: 865,800
 2010: 701,040


 Year 9 students:
 2006: 1,213,500
 2008: 1,024,300
 2010: 914,000


 Year 12 graduates (mainstream high school):
 2006: 449,700


+ 486,400
 2008: 499,100
 2010:


 Undergraduates/Junior College:
 2006: 1,306,200
 2008: 1,572,600
 2010: 1,649,400


 Graduating higher education students (undergraduate/junior college diploma cohort)
 2006: 257,300
 2008: 380,900
 2010: 478,900
Regional reportsā€¦
 Hubei
 Population: 59.9 million (2005)
 GDP: RMB1.58 trillion (2010)
 Students: 11,340,000 (2009)
 Comprising:
                    Kindergarten: 831,400
                    Primary: 3,592,600
                    Junior Middle School: 2,263,400
                    Secondary Specialist / Vocational:
                    Senior Middle School: 1,286,800
                    Junior College Diploma / Undergraduate: 1,400,000
                    Postgraduate: 90,700


 University Entrance Exam articulation rates:
 2001:56.8%
 2006:52.9%
 2010: 69%


 Year 7 students:
 2006: NA
 2008: 775,700
 2010: NA


 Year 9 students:
 2006: NA
 2008: 961,000
 2010: NA


 Year 12 graduates (mainstream high school):
 2006: 410,700


+ 435,500
 2008: 449,700
 2010:


 Undergraduates/Junior College:
 2006: 1,092,300
 2008: 1,185,100
 2010: 1,296,900


 Graduating higher education students (undergraduate/junior college diploma cohort)
 2001: 65,859
 2006: 300,000
 2010: 356,000
Regional reportsā€¦
  Fujian
  Population: 36.3 million (2009)
  GDP: RMB1.43 trillion (2010)
  Students: 8,366,167 (2009)
  Comprising:
                     Kindergarten: 1,077,218
                     Primary: 2,397,594
                     Junior Middle School: 1,415,209
                     Secondary Specialist / Vocational: 540,020
                     Senior Middle School: 719,067
                     Junior College Diploma: 269,471
                     Undergraduate: 336,813
                     Postgraduate: 29,012


  University Entrance Exam articulation rates:
  2000:50%
  2006:58%
  2010: 80%


  Year 7 students:
  2006: 523,700
  2008: 495,894
  2010: 383,200


  Year 9 students:
  2006: 602,300
  2008: 495,367
  2010: 478,500


  Year 12 graduates (mainstream high school):
  2006: 201,800

+ 242,178
 2008:
 2010: 240,300


  Undergraduates/Junior College:
  2006: 461,341
  2008: 562,595
  2010: 647,800


  Graduating higher education students (undergraduate/junior college diploma cohort)
  2006: 94,979
  2008: 130,379
  2010: 142,814
Regional reportsā€¦
 Shandong
 Population:94 million (2009)
 GDP: RMB3.94 trillion (2010)
 Students: 8,366,167 (2009)
 Comprising:
                    Kindergarten: 1,809,000
                    Primary:6,292,000
                    Junior Middle School: 3,418,000
                    Secondary Specialist / Vocational: 1,165,000
                    Senior Middle School: 1,575,000
                    Junior College Diploma / Undergraduate:1,631,000
                    Postgraduate:65,000


 University Entrance Exam articulation rates:
 2006: 64.4%
 2008: 65%
 2010: 79.72%


 Year 7 students:
 2006: NA
 2008: 1,080,000
 2010: 1,113,000


 Year 9 students:
 2006: NA
 2008: 1,080,000
 2010: 1,022,000


 Year 12 graduates (mainstream high school):
 2006: NA
 2008: NA

+ 547,000
 2010:


 Undergraduates/Junior College:
 2006: 1,338,000
 2008: 1,534,000
 2010: 1,631,000


 Graduating higher education students (undergraduate/junior college diploma cohort)
 2005: 180,932
 2006: 221,985
 2007: 309,493
 2008: 375,417
Regional reportsā€¦
  Zhejiang
  Population: 54.4269 million (42.6029 million holding residence permits) (2010)
  GDP: RMB 2.7227 trillion (2010)
  Students: 9.29 million (2010)
  Comprising:
                     Kindergarten: 1,830,500
                     Primary: 3,333,300
                     Junior Middle School: 1,671,300
                     Secondary Specialist / Vocational: 642,200
                     Senior Middle School: 880,200
                     Junior College Diploma and Undergraduate: 884,900
                     Postgraduate: 47,991


  University Entrance Exam articulation rates:
  2001: 68.3%
  2006: 71%
  2010: 83.8%


  Year 7 students:
  2006: 625,800
  2008: 622,100
  2010: 532,000


  Year 9 students:
  2006: 594,000
  2008: 538,100
  2010: 586,000


  Year 12 graduates (mainstream high school):
  2006:292,000
  2008:295,900

+2010:273,700


  Undergraduates and junior college diploma
  2006: 720,000
  2008: 832,200
  2010: 884,900


  Graduating higher education students (undergraduate/junior college diploma cohort)
  2006: 163,000
  2008: 203,200
  2010: 233,700
Regional reportsā€¦
 Liaoning
 Population: 43.746 million (2010)
 GDP: RMB 1.82783 trillion (2010)
 Students: 4.8212 million (2010)
 Comprising:
                    Kindergarten: 834,000
                    Primary: 2,183,000
                    Junior Middle School:1,272,000
                    Secondary Specialist / Vocational: NA
                    Senior Middle School:715,000
                    Junior College Diploma and Undergraduate: 880,000
                    Postgraduate: 82,000


 University Entrance Exam articulation rates:
 2000: 75%
 2006: 74.28%
 2010: 87%


 Year 7 students:
 2006: 504,800
 2008: 459,000
 2010: 397,000


 Year 9 students:
 2006: 541,900
 2008: 464,000
 2010: 455,000


 Year 12 graduates (mainstream high school):
 2006: 224,500
 2008: 257,000

+ 226,000
 2010:


 Undergraduates
 2006: 720,500
 2008: 820,000
 2010: 880,000


 Graduating higher education students (undergraduate/junior college diploma cohort)
 2006: 155,000
 2008: 202,000
 2010: 220,000
Regional reportsā€¦
 Heilongjiang
 Population: 38.312 million (2010)
 GDP: RMB 1.0235 trillion (2010)
 Students: 5.413 million (2010)
 Comprising:
                    Kindergarten: 492,000
                    Primary: 1,880,000
                    Junior Middle School: 1,291,000
                    Secondary Specialist / Vocational: 360,000
                    Senior Middle School: 617,000
                    Junior College Diploma and Undergraduate: 719,000
                    Postgraduate: 54,467


 University Entrance Exam articulation rates:
 2000:30%
 2006: 74.89%
 2010: 90.77% * First Province to ever exceed 90% gaokao articulation.


 Year 7 students:
 2006: 422,000
 2008: 390,000
 2010: 363,000


 Year 9 students:
 2006: 537,000
 2008: 447,000
 2010: 405,000


 Year 12 graduates (mainstream high school):
 2006: 182,000
 2008: 204,000

+ 196,000
 2010:


 Undergraduates
 2006: 584,000
 2008: 678,000
 2010: 719,000


 Graduating higher education students (undergraduate/junior college diploma cohort)
 2006: 129,000
 2008: 170,000
 2010: 181,000
Regional reportsā€¦
 Sichuan
 Population: 80.418 million (2010)
 GDP: RMB 1.6898.6 trillion (2010)
 Students: 17.923million (2010)
 Comprising:
                    Kindergarten: NA
                    Primary: 5,921,000
                    Junior Middle School: 4,901,000
                    Secondary Specialist / Vocational: 1,400,000
                    Senior Middle School: 1,462,000
                    Junior College Diploma and Undergraduate: 1,086,000
                    Postgraduate: 78,000


 University Entrance Exam articulation rates:
 2006: 60%
 2007: 53.53%
 2010: 70%


 Year 7 students:
 2006: 1,262,356
 2008: 1,251,700
 2010: 1,116,200


 Year 9 students:
 2006: NA
 2008: NA
 2010: NA


 Year 12 graduates (mainstream high school):
 2006: Not available
 2008: NA

+ NA
 2010:


 Undergraduates
 2006: 861,000
 2008: 991,000
 2010: 1,086,000


 Graduating higher education students (undergraduate/junior college diploma cohort)
 2006: 173,000
 2008: 248,000
 2010: 279,000
Regional reportsā€¦
  Chongqing
  Population: 28.8462 million (million holding residence permits) (2010)
  GDP: RMB 0.78942 trillion (2010)
  Students: 4.9999 million (2010)
  Comprising:
                     Kindergarten: NA
                     Primary: 1,999,400
                     Junior Middle School: 1,281,700
                     Secondary Specialist / Vocational: 526,600
                     Senior Middle School: 626,400
                     Junior College Diploma and Undergraduate: 522,700
                     Postgraduate: 43,100


  University Entrance Exam articulation rates:
  2006: 60%
  2007: 58%
  2010: 78.55%


  Year 7 students:
  2006: 643,900
  2008: 688,800
  2010: 408,500


  Year 9 students:
  2006: 529,400
  2008: 545,900
  2010: 416,600


  Year 12 graduates (mainstream high school):
  2006: 190,000

+ 189,000
 2008:
 2010: 169,500


  Undergraduates
  2006: 376,100
  2008: 450,000
  2010: 522,700


  Graduating higher education students (undergraduate/junior college diploma cohort)
  2006: 76,500
  2008: 99,700
  2010: 122,800
Regional reportsā€¦
  Shaā€™anxi
  Population: 37.327378 million (million holding residence permits) (2010)
  GDP: RMB 1.002153 trillion (2010)
  Students: 7.5553 million (2010)
  Comprising:
                     Kindergarten: 704,800
                     Primary: 2,610,400
                     Junior Middle School: 1,643,200
                     Secondary Specialist / Vocational: 628,200
                     Senior Middle School: 955,900
                     Junior College Diploma and Undergraduate: 927,800
                     Postgraduate: 85,000


  University Entrance Exam articulation rates:
  2006:59.5%
  2008:59.34%
  2010:60.2%


  Year 7 students:
  2006: 696,400
  2008: 615,300
  2010: 493,400


  Year 9 students:
  2006: 700,900
  2008: NA
  2010: NA


  Year 12 graduates (mainstream high school):
  2006: 277,400

+ NA
 2008:
 2010: NA


  Undergraduates
  2006: 726,200
  2008: 839,700
  2010: 927,800


  Graduating higher education students (undergraduate/junior college diploma cohort)
  2006: 157,800
  2008: 250,000
  2010: 265,000
Regional reportsā€¦
  Hunan
  Population: 65.683722 million (million holding residence permits) (2010)
  GDP: RMB 1.590212 trillion (2010)
  Students: 11.2471 million (2010)
  Comprising:
                     Kindergarten: 1,419,100
                     Primary: 4,791,600
                     Junior Middle School: 2,149,200
                     Secondary Specialist / Vocational: 764,800
                     Senior Middle School: 1,019,000
                     Junior College Diploma and Undergraduate: 1,047,200
                     Postgraduate: 56,200


  University Entrance Exam articulation rates:
  2000:50%
  2006:48.9%
  2008:51%
  2010:81%


  Year 7 students:
  2006: NA
  2008: 719,100
  2010: 734,400


  Year 9 students:
  2006: NA
  2008: 774,200
  2010: 697,500


  Year 12 graduates (mainstream high school):

+ NA
 2006:
 2008: 430,000
  2010: 361,800


  Undergraduates
  2006: 831,000
  2008: 952,300
  2010: 1,047,200


  Graduating higher education students (undergraduate/junior college diploma cohort)
  2006: 208,369
  2008: 244,700
  2010: 276,100
Regional reportsā€¦
 Henan
 Population: 94.023567 million (million holding residence permits) (2010)
 GDP: RMB 2.294268 trillion (2010)
 Students: 20.699721 million (2010)
 Comprising:
                    Kindergarten: NA
                    Primary: 10,705,300
                    Junior Middle School: 4,694,000
                    Secondary Specialist / Vocational: 1,893,100
                    Senior Middle School: 1,921,600
                    Junior College Diploma and Undergraduate: 1,456,700
                    Postgraduate: 29,021


 University Entrance Exam articulation rates:
 2006: 58.97%
 2008: 42%
 2010: 64.6%


 Year 7 students:
 2006: 1,661,900
 2008: 1,651,300
 2010: 1,588,100


 Year 9 students:
 2006: 1,880,600
 2008: 1,830,700
 2010: 1,549,200


 Year 12 graduates (mainstream high school):
 2006: 573,600
 2008: 749,800

+ 704,300
 2010:


 Undergraduates
 2006: 974,100
 2008: 1,250,200
 2010: 1,456,700


 Graduating higher education students (undergraduate/junior college diploma cohort)
 2006: 202,100
 2008: 302,500
 2010: 382,500
+


EIC Group China
Chinaā€™s leading international education
services provider.


http://partners.eic.org.cn

More Related Content

What's hot

Trends in International Student Enrollment in the U.S.: Open Doors 2012
Trends in International Student Enrollment in the U.S.: Open Doors 2012Trends in International Student Enrollment in the U.S.: Open Doors 2012
Trends in International Student Enrollment in the U.S.: Open Doors 2012Marty Bennett
Ā 
PERUMIN 31: Mining Engineering, establishing and sustaining education and res...
PERUMIN 31: Mining Engineering, establishing and sustaining education and res...PERUMIN 31: Mining Engineering, establishing and sustaining education and res...
PERUMIN 31: Mining Engineering, establishing and sustaining education and res...PERUMIN - ConvenciĆ³n Minera
Ā 
Utme2014-Performance-Analysis-of-tertiary-institutions
Utme2014-Performance-Analysis-of-tertiary-institutionsUtme2014-Performance-Analysis-of-tertiary-institutions
Utme2014-Performance-Analysis-of-tertiary-institutionsstatisense
Ā 
E-Learn 2002 - Online Writing as a Form of Electronic Communication in a Seco...
E-Learn 2002 - Online Writing as a Form of Electronic Communication in a Seco...E-Learn 2002 - Online Writing as a Form of Electronic Communication in a Seco...
E-Learn 2002 - Online Writing as a Form of Electronic Communication in a Seco...Michael Barbour
Ā 
Social Media Report - Educational Institutions April 2016
Social Media Report - Educational Institutions April 2016Social Media Report - Educational Institutions April 2016
Social Media Report - Educational Institutions April 2016Unmetric
Ā 
Marc coleman, Asia Business Week Dublin
Marc coleman, Asia Business Week DublinMarc coleman, Asia Business Week Dublin
Marc coleman, Asia Business Week DublinAsia Matters
Ā 

What's hot (7)

Trends in International Student Enrollment in the U.S.: Open Doors 2012
Trends in International Student Enrollment in the U.S.: Open Doors 2012Trends in International Student Enrollment in the U.S.: Open Doors 2012
Trends in International Student Enrollment in the U.S.: Open Doors 2012
Ā 
PERUMIN 31: Mining Engineering, establishing and sustaining education and res...
PERUMIN 31: Mining Engineering, establishing and sustaining education and res...PERUMIN 31: Mining Engineering, establishing and sustaining education and res...
PERUMIN 31: Mining Engineering, establishing and sustaining education and res...
Ā 
Utme2014-Performance-Analysis-of-tertiary-institutions
Utme2014-Performance-Analysis-of-tertiary-institutionsUtme2014-Performance-Analysis-of-tertiary-institutions
Utme2014-Performance-Analysis-of-tertiary-institutions
Ā 
Stars ncsehe-sue trinidad
Stars ncsehe-sue trinidadStars ncsehe-sue trinidad
Stars ncsehe-sue trinidad
Ā 
E-Learn 2002 - Online Writing as a Form of Electronic Communication in a Seco...
E-Learn 2002 - Online Writing as a Form of Electronic Communication in a Seco...E-Learn 2002 - Online Writing as a Form of Electronic Communication in a Seco...
E-Learn 2002 - Online Writing as a Form of Electronic Communication in a Seco...
Ā 
Social Media Report - Educational Institutions April 2016
Social Media Report - Educational Institutions April 2016Social Media Report - Educational Institutions April 2016
Social Media Report - Educational Institutions April 2016
Ā 
Marc coleman, Asia Business Week Dublin
Marc coleman, Asia Business Week DublinMarc coleman, Asia Business Week Dublin
Marc coleman, Asia Business Week Dublin
Ā 

Similar to EIC stat report 2

After the global financial crisis the future of interantional higher education
After the global financial crisis   the future of interantional higher educationAfter the global financial crisis   the future of interantional higher education
After the global financial crisis the future of interantional higher educationUniversity of Limerick
Ā 
Economic Development Master Plan Phase I
Economic Development Master Plan Phase IEconomic Development Master Plan Phase I
Economic Development Master Plan Phase ICity of College Station
Ā 
Analysis of applicantsā€™ choices
Analysis of applicantsā€™ choicesAnalysis of applicantsā€™ choices
Analysis of applicantsā€™ choicesstatisense
Ā 
ITFT - Asian Scenario
ITFT - Asian ScenarioITFT - Asian Scenario
ITFT - Asian Scenariosl22
Ā 
How korean students use IT for study
How korean students use IT for studyHow korean students use IT for study
How korean students use IT for studyUnggul Sagena
Ā 
Indian economy
Indian economyIndian economy
Indian economyansja
Ā 
Eidos ATSI Student Retention
Eidos ATSI  Student RetentionEidos ATSI  Student Retention
Eidos ATSI Student RetentionEidos Australia
Ā 
Pop Capā€™s First Year In China
Pop Capā€™s First Year In ChinaPop Capā€™s First Year In China
Pop Capā€™s First Year In ChinaJames Gwertzman
Ā 
Ipoh's PROPENOMICS: The Haven, an iconic project that is reshaping Ipoh's Pro...
Ipoh's PROPENOMICS: The Haven, an iconic project that is reshaping Ipoh's Pro...Ipoh's PROPENOMICS: The Haven, an iconic project that is reshaping Ipoh's Pro...
Ipoh's PROPENOMICS: The Haven, an iconic project that is reshaping Ipoh's Pro...Daniele Gambero
Ā 
Creating a ā€˜demand-drivenā€™ system: An analysis of the early effects of Austra...
Creating a ā€˜demand-drivenā€™ system: An analysis of the early effects of Austra...Creating a ā€˜demand-drivenā€™ system: An analysis of the early effects of Austra...
Creating a ā€˜demand-drivenā€™ system: An analysis of the early effects of Austra...EduSkills OECD
Ā 
Malta Nso Statistics 2011
Malta Nso Statistics 2011Malta Nso Statistics 2011
Malta Nso Statistics 2011Chris Nolan
Ā 
Internationalisation of higher education in new zealand what went wrong and...
Internationalisation of higher education in new zealand   what went wrong and...Internationalisation of higher education in new zealand   what went wrong and...
Internationalisation of higher education in new zealand what went wrong and...University of Limerick
Ā 
Indonesia advertising dead or alive june2013
Indonesia advertising dead or alive june2013Indonesia advertising dead or alive june2013
Indonesia advertising dead or alive june2013Aditya Eka Candra Suyono
Ā 

Similar to EIC stat report 2 (20)

After the global financial crisis the future of interantional higher education
After the global financial crisis   the future of interantional higher educationAfter the global financial crisis   the future of interantional higher education
After the global financial crisis the future of interantional higher education
Ā 
Chancellor Cheek DDDH Presentation
Chancellor Cheek DDDH PresentationChancellor Cheek DDDH Presentation
Chancellor Cheek DDDH Presentation
Ā 
Economic Development Master Plan Phase I
Economic Development Master Plan Phase IEconomic Development Master Plan Phase I
Economic Development Master Plan Phase I
Ā 
Pillar 2.pptx
Pillar 2.pptxPillar 2.pptx
Pillar 2.pptx
Ā 
Analysis of applicantsā€™ choices
Analysis of applicantsā€™ choicesAnalysis of applicantsā€™ choices
Analysis of applicantsā€™ choices
Ā 
ITFT - Asian Scenario
ITFT - Asian ScenarioITFT - Asian Scenario
ITFT - Asian Scenario
Ā 
How korean students use IT for study
How korean students use IT for studyHow korean students use IT for study
How korean students use IT for study
Ā 
Indian economy
Indian economyIndian economy
Indian economy
Ā 
309 - Admissions in HE Nigeria
309 - Admissions in HE Nigeria309 - Admissions in HE Nigeria
309 - Admissions in HE Nigeria
Ā 
Eidos ATSI Student Retention
Eidos ATSI  Student RetentionEidos ATSI  Student Retention
Eidos ATSI Student Retention
Ā 
Pop Capā€™s First Year In China
Pop Capā€™s First Year In ChinaPop Capā€™s First Year In China
Pop Capā€™s First Year In China
Ā 
Ipoh's PROPENOMICS: The Haven, an iconic project that is reshaping Ipoh's Pro...
Ipoh's PROPENOMICS: The Haven, an iconic project that is reshaping Ipoh's Pro...Ipoh's PROPENOMICS: The Haven, an iconic project that is reshaping Ipoh's Pro...
Ipoh's PROPENOMICS: The Haven, an iconic project that is reshaping Ipoh's Pro...
Ā 
H.E. Mr Gita Wirjawan's Keynote Address in the 6th Asia Think Tank Summit
H.E. Mr Gita Wirjawan's Keynote Address in the 6th Asia Think Tank SummitH.E. Mr Gita Wirjawan's Keynote Address in the 6th Asia Think Tank Summit
H.E. Mr Gita Wirjawan's Keynote Address in the 6th Asia Think Tank Summit
Ā 
Transforming india voc edu
Transforming india voc eduTransforming india voc edu
Transforming india voc edu
Ā 
Creating a ā€˜demand-drivenā€™ system: An analysis of the early effects of Austra...
Creating a ā€˜demand-drivenā€™ system: An analysis of the early effects of Austra...Creating a ā€˜demand-drivenā€™ system: An analysis of the early effects of Austra...
Creating a ā€˜demand-drivenā€™ system: An analysis of the early effects of Austra...
Ā 
Track K Dean
Track K DeanTrack K Dean
Track K Dean
Ā 
Malta Nso Statistics 2011
Malta Nso Statistics 2011Malta Nso Statistics 2011
Malta Nso Statistics 2011
Ā 
Utrecht sb- rajika bhandari
Utrecht  sb- rajika bhandariUtrecht  sb- rajika bhandari
Utrecht sb- rajika bhandari
Ā 
Internationalisation of higher education in new zealand what went wrong and...
Internationalisation of higher education in new zealand   what went wrong and...Internationalisation of higher education in new zealand   what went wrong and...
Internationalisation of higher education in new zealand what went wrong and...
Ā 
Indonesia advertising dead or alive june2013
Indonesia advertising dead or alive june2013Indonesia advertising dead or alive june2013
Indonesia advertising dead or alive june2013
Ā 

Recently uploaded

Introduction to AI in Higher Education_draft.pptx
Introduction to AI in Higher Education_draft.pptxIntroduction to AI in Higher Education_draft.pptx
Introduction to AI in Higher Education_draft.pptxpboyjonauth
Ā 
AmericanHighSchoolsprezentacijaoskolama.
AmericanHighSchoolsprezentacijaoskolama.AmericanHighSchoolsprezentacijaoskolama.
AmericanHighSchoolsprezentacijaoskolama.arsicmarija21
Ā 
Solving Puzzles Benefits Everyone (English).pptx
Solving Puzzles Benefits Everyone (English).pptxSolving Puzzles Benefits Everyone (English).pptx
Solving Puzzles Benefits Everyone (English).pptxOH TEIK BIN
Ā 
EPANDING THE CONTENT OF AN OUTLINE using notes.pptx
EPANDING THE CONTENT OF AN OUTLINE using notes.pptxEPANDING THE CONTENT OF AN OUTLINE using notes.pptx
EPANDING THE CONTENT OF AN OUTLINE using notes.pptxRaymartEstabillo3
Ā 
call girls in Kamla Market (DELHI) šŸ” >ą¼’9953330565šŸ” genuine Escort Service šŸ”āœ”ļøāœ”ļø
call girls in Kamla Market (DELHI) šŸ” >ą¼’9953330565šŸ” genuine Escort Service šŸ”āœ”ļøāœ”ļøcall girls in Kamla Market (DELHI) šŸ” >ą¼’9953330565šŸ” genuine Escort Service šŸ”āœ”ļøāœ”ļø
call girls in Kamla Market (DELHI) šŸ” >ą¼’9953330565šŸ” genuine Escort Service šŸ”āœ”ļøāœ”ļø9953056974 Low Rate Call Girls In Saket, Delhi NCR
Ā 
Full Stack Web Development Course for Beginners
Full Stack Web Development Course  for BeginnersFull Stack Web Development Course  for Beginners
Full Stack Web Development Course for BeginnersSabitha Banu
Ā 
Keynote by Prof. Wurzer at Nordex about IP-design
Keynote by Prof. Wurzer at Nordex about IP-designKeynote by Prof. Wurzer at Nordex about IP-design
Keynote by Prof. Wurzer at Nordex about IP-designMIPLM
Ā 
MULTIDISCIPLINRY NATURE OF THE ENVIRONMENTAL STUDIES.pptx
MULTIDISCIPLINRY NATURE OF THE ENVIRONMENTAL STUDIES.pptxMULTIDISCIPLINRY NATURE OF THE ENVIRONMENTAL STUDIES.pptx
MULTIDISCIPLINRY NATURE OF THE ENVIRONMENTAL STUDIES.pptxAnupkumar Sharma
Ā 
Difference Between Search & Browse Methods in Odoo 17
Difference Between Search & Browse Methods in Odoo 17Difference Between Search & Browse Methods in Odoo 17
Difference Between Search & Browse Methods in Odoo 17Celine George
Ā 
Grade 9 Q4-MELC1-Active and Passive Voice.pptx
Grade 9 Q4-MELC1-Active and Passive Voice.pptxGrade 9 Q4-MELC1-Active and Passive Voice.pptx
Grade 9 Q4-MELC1-Active and Passive Voice.pptxChelloAnnAsuncion2
Ā 
Types of Journalistic Writing Grade 8.pptx
Types of Journalistic Writing Grade 8.pptxTypes of Journalistic Writing Grade 8.pptx
Types of Journalistic Writing Grade 8.pptxEyham Joco
Ā 
Framing an Appropriate Research Question 6b9b26d93da94caf993c038d9efcdedb.pdf
Framing an Appropriate Research Question 6b9b26d93da94caf993c038d9efcdedb.pdfFraming an Appropriate Research Question 6b9b26d93da94caf993c038d9efcdedb.pdf
Framing an Appropriate Research Question 6b9b26d93da94caf993c038d9efcdedb.pdfUjwalaBharambe
Ā 
AMERICAN LANGUAGE HUB_Level2_Student'sBook_Answerkey.pdf
AMERICAN LANGUAGE HUB_Level2_Student'sBook_Answerkey.pdfAMERICAN LANGUAGE HUB_Level2_Student'sBook_Answerkey.pdf
AMERICAN LANGUAGE HUB_Level2_Student'sBook_Answerkey.pdfphamnguyenenglishnb
Ā 
Influencing policy (training slides from Fast Track Impact)
Influencing policy (training slides from Fast Track Impact)Influencing policy (training slides from Fast Track Impact)
Influencing policy (training slides from Fast Track Impact)Mark Reed
Ā 
Quarter 4 Peace-education.pptx Catch Up Friday
Quarter 4 Peace-education.pptx Catch Up FridayQuarter 4 Peace-education.pptx Catch Up Friday
Quarter 4 Peace-education.pptx Catch Up FridayMakMakNepo
Ā 
DATA STRUCTURE AND ALGORITHM for beginners
DATA STRUCTURE AND ALGORITHM for beginnersDATA STRUCTURE AND ALGORITHM for beginners
DATA STRUCTURE AND ALGORITHM for beginnersSabitha Banu
Ā 
Hierarchy of management that covers different levels of management
Hierarchy of management that covers different levels of managementHierarchy of management that covers different levels of management
Hierarchy of management that covers different levels of managementmkooblal
Ā 

Recently uploaded (20)

Introduction to AI in Higher Education_draft.pptx
Introduction to AI in Higher Education_draft.pptxIntroduction to AI in Higher Education_draft.pptx
Introduction to AI in Higher Education_draft.pptx
Ā 
AmericanHighSchoolsprezentacijaoskolama.
AmericanHighSchoolsprezentacijaoskolama.AmericanHighSchoolsprezentacijaoskolama.
AmericanHighSchoolsprezentacijaoskolama.
Ā 
Solving Puzzles Benefits Everyone (English).pptx
Solving Puzzles Benefits Everyone (English).pptxSolving Puzzles Benefits Everyone (English).pptx
Solving Puzzles Benefits Everyone (English).pptx
Ā 
EPANDING THE CONTENT OF AN OUTLINE using notes.pptx
EPANDING THE CONTENT OF AN OUTLINE using notes.pptxEPANDING THE CONTENT OF AN OUTLINE using notes.pptx
EPANDING THE CONTENT OF AN OUTLINE using notes.pptx
Ā 
Model Call Girl in Tilak Nagar Delhi reach out to us at šŸ”9953056974šŸ”
Model Call Girl in Tilak Nagar Delhi reach out to us at šŸ”9953056974šŸ”Model Call Girl in Tilak Nagar Delhi reach out to us at šŸ”9953056974šŸ”
Model Call Girl in Tilak Nagar Delhi reach out to us at šŸ”9953056974šŸ”
Ā 
call girls in Kamla Market (DELHI) šŸ” >ą¼’9953330565šŸ” genuine Escort Service šŸ”āœ”ļøāœ”ļø
call girls in Kamla Market (DELHI) šŸ” >ą¼’9953330565šŸ” genuine Escort Service šŸ”āœ”ļøāœ”ļøcall girls in Kamla Market (DELHI) šŸ” >ą¼’9953330565šŸ” genuine Escort Service šŸ”āœ”ļøāœ”ļø
call girls in Kamla Market (DELHI) šŸ” >ą¼’9953330565šŸ” genuine Escort Service šŸ”āœ”ļøāœ”ļø
Ā 
Model Call Girl in Bikash Puri Delhi reach out to us at šŸ”9953056974šŸ”
Model Call Girl in Bikash Puri  Delhi reach out to us at šŸ”9953056974šŸ”Model Call Girl in Bikash Puri  Delhi reach out to us at šŸ”9953056974šŸ”
Model Call Girl in Bikash Puri Delhi reach out to us at šŸ”9953056974šŸ”
Ā 
Full Stack Web Development Course for Beginners
Full Stack Web Development Course  for BeginnersFull Stack Web Development Course  for Beginners
Full Stack Web Development Course for Beginners
Ā 
Keynote by Prof. Wurzer at Nordex about IP-design
Keynote by Prof. Wurzer at Nordex about IP-designKeynote by Prof. Wurzer at Nordex about IP-design
Keynote by Prof. Wurzer at Nordex about IP-design
Ā 
MULTIDISCIPLINRY NATURE OF THE ENVIRONMENTAL STUDIES.pptx
MULTIDISCIPLINRY NATURE OF THE ENVIRONMENTAL STUDIES.pptxMULTIDISCIPLINRY NATURE OF THE ENVIRONMENTAL STUDIES.pptx
MULTIDISCIPLINRY NATURE OF THE ENVIRONMENTAL STUDIES.pptx
Ā 
Difference Between Search & Browse Methods in Odoo 17
Difference Between Search & Browse Methods in Odoo 17Difference Between Search & Browse Methods in Odoo 17
Difference Between Search & Browse Methods in Odoo 17
Ā 
Grade 9 Q4-MELC1-Active and Passive Voice.pptx
Grade 9 Q4-MELC1-Active and Passive Voice.pptxGrade 9 Q4-MELC1-Active and Passive Voice.pptx
Grade 9 Q4-MELC1-Active and Passive Voice.pptx
Ā 
Types of Journalistic Writing Grade 8.pptx
Types of Journalistic Writing Grade 8.pptxTypes of Journalistic Writing Grade 8.pptx
Types of Journalistic Writing Grade 8.pptx
Ā 
Framing an Appropriate Research Question 6b9b26d93da94caf993c038d9efcdedb.pdf
Framing an Appropriate Research Question 6b9b26d93da94caf993c038d9efcdedb.pdfFraming an Appropriate Research Question 6b9b26d93da94caf993c038d9efcdedb.pdf
Framing an Appropriate Research Question 6b9b26d93da94caf993c038d9efcdedb.pdf
Ā 
AMERICAN LANGUAGE HUB_Level2_Student'sBook_Answerkey.pdf
AMERICAN LANGUAGE HUB_Level2_Student'sBook_Answerkey.pdfAMERICAN LANGUAGE HUB_Level2_Student'sBook_Answerkey.pdf
AMERICAN LANGUAGE HUB_Level2_Student'sBook_Answerkey.pdf
Ā 
Influencing policy (training slides from Fast Track Impact)
Influencing policy (training slides from Fast Track Impact)Influencing policy (training slides from Fast Track Impact)
Influencing policy (training slides from Fast Track Impact)
Ā 
Quarter 4 Peace-education.pptx Catch Up Friday
Quarter 4 Peace-education.pptx Catch Up FridayQuarter 4 Peace-education.pptx Catch Up Friday
Quarter 4 Peace-education.pptx Catch Up Friday
Ā 
DATA STRUCTURE AND ALGORITHM for beginners
DATA STRUCTURE AND ALGORITHM for beginnersDATA STRUCTURE AND ALGORITHM for beginners
DATA STRUCTURE AND ALGORITHM for beginners
Ā 
Hierarchy of management that covers different levels of management
Hierarchy of management that covers different levels of managementHierarchy of management that covers different levels of management
Hierarchy of management that covers different levels of management
Ā 
TataKelola dan KamSiber Kecerdasan Buatan v022.pdf
TataKelola dan KamSiber Kecerdasan Buatan v022.pdfTataKelola dan KamSiber Kecerdasan Buatan v022.pdf
TataKelola dan KamSiber Kecerdasan Buatan v022.pdf
Ā 

EIC stat report 2

  • 1. + Key China Education Statistics for international educators A report for EIC Group China partners November 2011 partners.eic.org.cn
  • 2. Key China Statistics for international educators This report was prepared for international university, college and school partners of EIC Group China. The report covers major education participation rates and domestic capacity statistics and trends in China. Partners will find many of the statistics useful for understanding the education market in China, and for planning their current and future marketing strategies. China is a complex and dynamic education market. The growth in participation rates among school and higher education age cohorts, in the years from 2000-2010, have been extraordinary. Domestic capacity has also grown rapidly to accommodate demand for senior secondary and higher education. Over this period, Chinaā€™s higher education system grew from 9.3 million students to over 33 million students. Changing demographics is changing market dynamics. With rapidly shrinking school age cohorts, growth in higher education participation for the 18-22 year old cohort from 24.2% to 40% in + 2020, will only require a further 17% increase in higher education capacity for school leavers. This is remarkably small compared to the over 300% growth of the previous 10 years. The days of significant ā€œunmet demandā€ are over, with students better able to choose and access domestic diploma and undergraduate programs. Nonetheless, the number of students going abroad to study has been steadily increasing. We continue to see strong demand at all levels for international education for most destination countries. Overview is that those Partners that position themselves well to meet the needs of students, who have increasing choice at home and abroad, will continue to succeed in student recruitment in China. The focus of this Paper is to provide key statistics covering student participation rates, domestic demand and capacity. We will continue to publish further papers on some of the strategies and opportunities for Partners positioning themselves for the challenges ahead. Chris Francis, Strategic Development Director EIC Group
  • 3. + ļ® Chinese students going abroad for the first time. Year Number of % Students Growth 1995 23,486 NA 2000 38,989 66% 2001 83,973 115.4% 2002 125,179 49% 2003 117,307 (6.3%) 2004 114,663 (2.7%) 2005 118,500 3.3% 2006 134,000 12.9% 2007 144,000 7.9% 2008 179,800 24.9% 2009 229,000 27.4% 2010 284,700 24.3% 2011 339,700 19.3%
  • 4. + ļ® Chinese public scholarships and self funded students. Year Number China Self Publicly of funded funded funded Students Scholarships % 1995 23,486 10,886 12,600 46.4% 2000 38,989 6,696 32,293 17.2% 2001 83,973 7,921 76,052 9.4% 2002 125,179 8,180 117,000 6.5% 2003 117,307 8,200 109,100 7% 2004 114,663 10,360 104,300 9% 2005 118,500 12,000 106,500 10% 2006 134,000 13,122 121,880 10% 2007 144,000 15,810 129,000 11% 2008 179,800 18,200 161,600 10.1% 2009 229,300 19,200 210,100 8.4% 2010 284,700 18,300 266,400 6.9% 2011 339,700 24,900 314,800 7.3% Opportunities for recruiting students on Chinese publicly funded scholarships are limited. Scholarships are granted through the Chinese Ministry of Education and a wide range of public authorities primarily for research degrees. Self funded students (or those receiving merit scholarships directly from institutions abroad) continue to dominate the study abroad market.
  • 5. + ļ® Domestic ā€˜Gaokaoā€™ university entrance exam participation. Year Number of Admitted % Examinees 1977 5,700,000 270,000 4.8% 1980 3,330,000 280,000 8% 1985 1,760,000 620,000 35% 1990 2,830,000 610,000 22% 1995 2,530,000 930,000 37% 2000 3,750,000 2,210,000 59% 2001 4,540,000 2,680,000 59% 2002 5,100,000 3,200,000 63% 2003 6,130,000 3,820,000 62% 2004 7,290,000 4,470,000 61% 2005 8,770,000 5,040,000 57% 2006 9,500,000 5,460,000 57% 2007 10,100,000 5,660,000 56% 2008 10,500,000 5,990,000 57% 2009 10,200,000 6,290,000 62% 2010 9,57,000 6,650,000 69.5% 2011 9,330,000 6,750,000 72.3% Admissions rates for students taking the national university entrance exams has continued to rise. In metropolitan centres such as Beijing and Shanghai, admission rates for candidates is over 85% in 2011, leaving a very small pool of students unable to gain higher education places.
  • 6. + ļ® Notes on Gaokao statistics ļ® 1977-1980 high examinee numbers driven by resumption of exams after Cultural Revolution. ļ® Participation rates in senior high school increasing rapidly during this period. ļ® Not all high school graduates take exam. Statistics indicative of demand for domestic undergraduate places. ļ® Peak year in 2008 for absolute numbers of examinees. ļ® High school participation rate continues to grow though school age cohorts in significant decline. ļ® Chinese Ministry of Education objective to grow senior high school participation rate of the 15-17 age cohort from 82.5% in 2010 to 90% by 2020. ļ® Increase in demand driven primarily by increase in participation in age cohort. ļ® Age cohort declining reflected in reduction in examinees after 2008, despite higher participation rate.
  • 7. + Applications for graduate programs via the national graduate entrance examinations. Year Number of Growth Enrolled % Candidates Enrolled 2012 1,656,000 6.9% TBA TBA 2011 1,511,000 7.9% 495,000 32.8% 2010 1,406,000 12.8% 472,000 33.6% 2009 1,246,000 3.8% 415,000 33.3% 2008 1,200,000 (0.6%) 364,000 30.3% 2007 1,282,000 0.8% 390,000 30.4% 2006 1,271,200 8.4% 402,800 31.7% 2005 1,172,000 24% 324,940 27.7% 2004 945,000 18.5% 330,000 34.9% 2003 797,000 27.7% 270,000 33.9% 2002 624,000 35.7% 195,000 31.25% 2001 460,000 17.3% 110,500 24% 2000 392,000 22.9% 85,000 21.7% Graduate places remains highly competitive. While there has been significant growth in places and capacity, domestic provision has scaled up far more slowly than for undergraduate places. Significant unmet demand remains in the system with large number of high calibre candidates unable to obtain a graduate place. International providers continue to be well positioned to grow Chinese graduate student recruitment.
  • 8. + ļ® Higher Education Students in China. Year Undergraduate / Masters Ph.D. Total Junior College Diploma 2000 9,097,300 301,200 9,398,500 2001 11,750,500 329,256 12,079,756 2002 13,751,150 500,980 14,252,130 2003 16,732,942 651,260 17,384,202 2004 19,898,833 654,286 165,610 20,718,729 2005 22,631,151 787,293 191,317 23,609,761 2006 25,380,151 896,615 208,038 26,484,804 2007 27,195,304 972,539 222,508 28,390,351 2008 29,252,148 1,046,429 236,617 30,535,194 2009 31,251,500 1,158,600 246,300 32,656,400 2010 32,209,760 1,279,466 258,950 33,748,176 2000-2010 was a period of extraordinary growth for the Chinese higher education system. Public and private capacity rapidly expanded, with extraordinary investment in facilities and infrastructure.
  • 9. + ļ® Participation rates in secondary and higher education in China. Year Junior Senior Higher secondary secondary education (12-14 years) (15-17 years) (18-22 years) 1990 66.7% 21.9% 3.4% 1995 78.4% 33.6% 7.2% 2000 88.6% 42.8% 12.5% 2001 88.7% 42.8% 13.3% 2002 90.0% 42.8% 15.0% 2003 92.7% 43.8% 17.0% 2004 94.1% 48.1% 19.0% 2005 95.0% 52.7% 21.0% 2006 97% 59.8% 22.0% 2007 98% 66% 23.0% 2008 98.5% 74% 23.3% 2009 99% 79.2% 24.2% 2010 100% 82.5% 26.5% 2020 100% 90% 40% Target Growth in secondary and higher education has been driven by rapidly increasing participation rates, more than by age cohort growth. Ahead, with declining demographics, participation rates will climb to 40% by 2020 with only incremental growth in higher education places.
  • 10. +International students coming to Chinaā€¦. China becomes a major destination countryā€¦. Year Number of % Growth Students 2000 52,150 NA 2001 61,869 18.6% 2002 85,829 38.7% 2003 77,715 (9.45%) 2004 110,844 42.6% 2005 141,087 27.3% 2006 162,695 15.3% 2007 195,503 20.2% 2008 223,449 14.3% 2009 238,184 6.6% 2010 265,090 11.3% 2011 292,611 10.4% 2011 Summary 25,687 international students in China on Chinese government scholarships. ā€¢ Major sending countries in order: Korea (66,442), USA (23,292), Japan (17,961), Thailand (14,145), Vietnam (13,549), Russia (13,340), Indonesia (10,957), India (9,370), Kazakhstan (8,287), Pakistan (8,516), France (7,592), Mongolia (7,112) and Germany (5,451). ā€¢ 118,837 students on award (Bachelors, Masters & Doctoral programs) and 173,774 students on non-award programs. ā€¢ The Ministry of Education announced that by 2020, China intends to host 500,000 international students and become the largest destination for overseas study for students from Asia.
  • 11. + Demographic decline An example from Jiangsu Provinceā€¦ The pipeline shrinks by 29.2% to 2015 2006 2007 2008 2009 2010 Year 7 new 990,600 946,600 865,800 779,000 701,040 students 2006 2007 2008 2009 2010 Year 9 1,213,500 1,115,200 1,024,300 962,800 914,000 graduates Growth NA (12.87%) (9.88%) (1.64%) (3.3%) 2006 2007 2008 2009 2010 Year 12 449,700 522,400 499,100 513,100 486,400 Mainstream Year 12 243,200 265,700 289,400 301,200 264,600 Vocational Total 692,900 788,100 788,500 814,300 751,000 Jiangsu Province serves as a good example of the demographic decline in school age cohorts. In the 5 years from 2006-2010, the Year 7 cohort declined by 29.2%. This cohort graduates in 2015 and faces less competition than any other in history in a greatly expanded domestic university system. Age cohort participation in higher education in Jiangsu has already reached 40%.
  • 12. + Demographic decline An example from Hunan Provinceā€¦ The closing ā€œunmet demandā€ gapā€¦. Hunan Students taking University Entrance Exams 2006-2010. Candidates vs. Admissions. (1,000s) 600 500 400 300 Admitted 200 Candidates 100 0 2006 2007 2008 2009 2010 Admission rates of Hunan students into higher education 2006-2010 100.00% 80.00% 60.00% 40.00% 20.00% 0.00% 2006 2007 2008 2009 2010
  • 13. Regional reports. The statistics below outline the regional context of Chinese education. Given that many Provinces represent a far larger opportunity for international educators than the traditional metropolitan centers of Beijing, Shanghai and Guangzhou, a regional strategy is a mid-to-long term necessity. The Report does not cover how many Chinese students are recruited for overseas education from each Province or region or into which destination markets. Currently, reliable figures for this are not available, with no foreign Embassies publicly releasing student visa statistics with a breakdown by Chinese geographic region. Work with AEI, the British Council, Education USA and other industry organizations to obtain greater understanding of the regional markets you plan to enter. + The purpose of the brief regional profiles below is to offer insights into the scope of the opportunity by region, rather than a detailed strategy on how to undertake regional marketing in China. Each Partner has differing recruitment needs, resources and considerations when setting regional objectives. At EIC Group China, we strongly encourage our Partners to visit our regional offices and to join our major events held in March, June and October each year across 17 key regions of China. Beyond this, there are many solutions providers in both China and abroad that can support online marketing and branding in Chinese to create a ā€˜digital solutionā€™ to the regional issue. EICā€™s Partner Services unit also offers solutions for online branding and marketing. Many Partners have internal staff and student resources capable of supporting these efforts at low or no cost. EIC will be releasing a paper soon on how to undertake low or no cost branding efforts online in China. Chris Francis, Strategic Development Director EIC Group
  • 14. + ļ® Sources of Chinese Higher Education Students by Province 2010. Province / Undergraduate Masters Ph.D. Total Municipality / Junior College students students Higher Diploma Education students Students Beijing 747,228 30,964 14,652 792,884 Tianjin 419,398 18,341 3,423 441,162 Hebei 1,596,100 75,796 11,769 1,683,665 Shanxi 1,036,313 49,184 7,573 1,093,070 Inner 754,542 27,094 4,378 786,014 Mongolia Liaoning 1,124,484 54,482 13,153 1,192,119 Jilin 671,527 40,382 9,152 721,061 Heilongjiang 943,949 48,172 9,759 1,001,880 Shanghai 711,506 29,247 14,510 755,263 Jiangsu 2,332,012 79,167 16,069 2,427,428 Zhejiang 1,578,375 35,084 9,512 1,622,971 Anhui 1,410,782 63,953 10,270 1,485,005 Fujian 958,845 22,044 4,796 985,685 Jiangxi 986,470 40,345 5,961 1,032,776 Shandong 2,281,973 157,609 23,819 2,463,401 Henan 2,125,998 106,176 14,584 2,246,758 Hubei 1,495,347 90,927 19,444 1,605,718 Hunan 1,431,264 61,967 13,080 1,506,311 These statistics demonstrate where Chinese universities are recruiting their own students. They are particularly key for undergraduate recruitment, showing that the bulk of domestic recruitment for higher education is not in the major metropolitan centres.
  • 15. + ļ® Sources of Chinese Higher Education Students by Province 2010. Province / Undergraduate Masters Ph.D. Total Municipality / Junior College students students Higher Diploma Education students students Guangdong 2,294,357 30,932 7,344 2,332,633 Guangxi 865,168 15,264 2,648 883,080 Hainan 193,754 3,539 553 197,846 Chongqing 635,036 21,612 4,010 660,658 Sichuan 1,547,166 50,986 11,398 1,609,550 Guizhou 599,984 11,292 1,827 613,103 Yunnan 752,373 13,823 3,161 769,357 Tibet 52,923 973 130 52,026 Shaā€™anxi 1,142,056 58,362 11,046 1,211,464 Gansu 652,273 19,279 4,011 675,563 Qinghai 134,004 2,667 608 137,279 Ningxia 189,083 4,262 899 194,244 Xinjiang 525,613 11,647 2,586 539,846 Total 32,209,760 1,279,466 258,950 33,748,176 Again, these statistics reflect the origin of students, not where they undertake higher education, which is covered in the regional reports below. Thinking like a Chinese higher education institution would require identifying opportunities, partnerships and channels to market into the major provinces covered in the report. For undergraduate recruitment, targeting students ā€˜at homeā€™ is key to successful recruitment.
  • 16. Regional reportsā€¦ Beijing. Population:19.612 million (12.567 million holding residence permits) (2010) GDP: RMB1377.79 billion (2010) Students: 2.687 million (2010) Comprising: Kindergarten: 277,000 Primary: 686,000 Junior Middle School: 328,500 Secondary Specialist / Vocational: 219,000 Senior Middle School: 216,500 Junior College Diploma and Undergraduate: 735,000 Postgraduate: 225,000 University Entrance Exam articulation rates: 2000:75% 2006:72.88% 2010: 89.7% Year 7 students: 2001:166,174 2006: 90,722 2009: 105,930 Year 9 students: 2001: 149,442 2006: 124,250 2009: 101,811 Year 12 graduates (mainstream high school): 2001: 51,263 2006:78,037 + 2009:70,132 Undergraduates 2001: 340,284 2006: 554,702 2009: 577,154 Graduating higher education students (undergraduate/junior college diploma cohort) 2001: 55,831 2006: 132,488 2009: 152,336
  • 17. Regional reportsā€¦ Shanghai Population: 23.019 million (14.042 million holding residence permits) (2010) GDP: RMB 1687.242 billion (2010) Students: 2.8182 million (2010) Comprising: Kindergarten: 400,300 Primary: 865,800 Junior Middle School: 464,850 Secondary Specialist / Vocational: 157,600 Senior Middle School: 208,250 Junior College Diploma and Undergraduate: 609,700 Postgraduate: 111,700 University Entrance Exam articulation rates: 2000:70% 2006:80.4% 2010:85% Year 7 students: 2003:127,500 2006: 108,793 2009: 109,300 Year 9 students: 2003: 180,400 2006: 112,607 2009: 100,000 Year 12 graduates (mainstream high school): 2003:77,600 + 2006:121,900 2009:87,600 Undergraduates 2003: 378,500 2006: 466,300 2009: 512,800 Graduating higher education students (undergraduate/junior college diploma cohort) 2003: 71,200 2006: 110,500 2009: 126,900
  • 18. Regional reportsā€¦ Guangdong Population: 104.3 million (million holding residence permits) (2010) GDP: RMB4547.283 billion (2010) Students: 21.3953 million (2010) Comprising: Kindergarten: 2,772,300 Primary: 8,485,500 Junior Middle School: 5,001,000 Secondary Specialist / Vocational: 1,547,800 Senior Middle School: 2,089,500 Junior College Diploma/Undergraduate: 1,426,700 Postgraduate: 72,500 University Entrance Exam articulation rates: 2000: 65% 2006: 69.58% 2010: 78% Year 7 students: 2001: 1,426,843 2006: 1,706,870 2010: 1,663,700 Year 9 students: 2004: 1,314,000 2006: 1,425,900 2010: 1,534,700 Year 12 graduates (mainstream high school): 2004: 318,000 + 2006: 429,900 2010: 567,600 Undergraduates 2001: 381,926 2006: 1,008,577 2010: 1,426,624 Graduating higher education students (undergraduate/junior college diploma cohort) 2001: 62,000 2006: 196,000 2010: 334,200
  • 19. Regional reportsā€¦ Tianjin Population: 12.28 million (9.8 million holding residence permits). GDP: RMB750 billion (2009) Students: 1.79 million (2010) Comprising: Kindergarten: 217, 886 Primary:505,895 Junior Middle School: 273,408 Secondary Specialist / Vocational: 105,694 Senior Middle School: 185,153 Junior College Diploma: 155,608 Undergraduate: 273, 616 Postgraduate: 41,022 University Entrance Exam articulation rates: 2001:71.78% 2006:70.83% 2010:79% Year 7 students: 2006: 104,243 2008: 84,245 2010: 83,891 Year 9 students: 2006: 124,325 2008: 98,490 2010: 93,464 Year 12 graduates (mainstream high school): 2006: 69,891 2008: 75,230 + 2010: 65,951 Undergraduates 2006: 212,526 2008: 240,510 2010: 273,616 Graduating higher education students (undergraduate/junior college diploma cohort) 2006: 81,983 2008: 101,728 2010: 105,354
  • 20. Regional reportsā€¦ Jiangsu Population: 76.54 million (2010) GDP: RMB4.09 trillion (2010) Students: 11.3 million (2010) Comprising: Kindergarten: 833,100 Primary: 3,987,000 (participation rate 100%) Junior Middle School: 2,329,500 (participation rate 98.7%) Secondary Specialist / Vocational: 1,020,400 Senior Middle School: 1,356,600 Junior College Diploma / Undergraduate: 1,649,400 Postgraduate: 125,500 University Entrance Exam articulation rates: 2001:61.2% 2006:70.71% 2010: 77.9% Year 7 students: 2006: 990,600 2008: 865,800 2010: 701,040 Year 9 students: 2006: 1,213,500 2008: 1,024,300 2010: 914,000 Year 12 graduates (mainstream high school): 2006: 449,700 + 486,400 2008: 499,100 2010: Undergraduates/Junior College: 2006: 1,306,200 2008: 1,572,600 2010: 1,649,400 Graduating higher education students (undergraduate/junior college diploma cohort) 2006: 257,300 2008: 380,900 2010: 478,900
  • 21. Regional reportsā€¦ Hubei Population: 59.9 million (2005) GDP: RMB1.58 trillion (2010) Students: 11,340,000 (2009) Comprising: Kindergarten: 831,400 Primary: 3,592,600 Junior Middle School: 2,263,400 Secondary Specialist / Vocational: Senior Middle School: 1,286,800 Junior College Diploma / Undergraduate: 1,400,000 Postgraduate: 90,700 University Entrance Exam articulation rates: 2001:56.8% 2006:52.9% 2010: 69% Year 7 students: 2006: NA 2008: 775,700 2010: NA Year 9 students: 2006: NA 2008: 961,000 2010: NA Year 12 graduates (mainstream high school): 2006: 410,700 + 435,500 2008: 449,700 2010: Undergraduates/Junior College: 2006: 1,092,300 2008: 1,185,100 2010: 1,296,900 Graduating higher education students (undergraduate/junior college diploma cohort) 2001: 65,859 2006: 300,000 2010: 356,000
  • 22. Regional reportsā€¦ Fujian Population: 36.3 million (2009) GDP: RMB1.43 trillion (2010) Students: 8,366,167 (2009) Comprising: Kindergarten: 1,077,218 Primary: 2,397,594 Junior Middle School: 1,415,209 Secondary Specialist / Vocational: 540,020 Senior Middle School: 719,067 Junior College Diploma: 269,471 Undergraduate: 336,813 Postgraduate: 29,012 University Entrance Exam articulation rates: 2000:50% 2006:58% 2010: 80% Year 7 students: 2006: 523,700 2008: 495,894 2010: 383,200 Year 9 students: 2006: 602,300 2008: 495,367 2010: 478,500 Year 12 graduates (mainstream high school): 2006: 201,800 + 242,178 2008: 2010: 240,300 Undergraduates/Junior College: 2006: 461,341 2008: 562,595 2010: 647,800 Graduating higher education students (undergraduate/junior college diploma cohort) 2006: 94,979 2008: 130,379 2010: 142,814
  • 23. Regional reportsā€¦ Shandong Population:94 million (2009) GDP: RMB3.94 trillion (2010) Students: 8,366,167 (2009) Comprising: Kindergarten: 1,809,000 Primary:6,292,000 Junior Middle School: 3,418,000 Secondary Specialist / Vocational: 1,165,000 Senior Middle School: 1,575,000 Junior College Diploma / Undergraduate:1,631,000 Postgraduate:65,000 University Entrance Exam articulation rates: 2006: 64.4% 2008: 65% 2010: 79.72% Year 7 students: 2006: NA 2008: 1,080,000 2010: 1,113,000 Year 9 students: 2006: NA 2008: 1,080,000 2010: 1,022,000 Year 12 graduates (mainstream high school): 2006: NA 2008: NA + 547,000 2010: Undergraduates/Junior College: 2006: 1,338,000 2008: 1,534,000 2010: 1,631,000 Graduating higher education students (undergraduate/junior college diploma cohort) 2005: 180,932 2006: 221,985 2007: 309,493 2008: 375,417
  • 24. Regional reportsā€¦ Zhejiang Population: 54.4269 million (42.6029 million holding residence permits) (2010) GDP: RMB 2.7227 trillion (2010) Students: 9.29 million (2010) Comprising: Kindergarten: 1,830,500 Primary: 3,333,300 Junior Middle School: 1,671,300 Secondary Specialist / Vocational: 642,200 Senior Middle School: 880,200 Junior College Diploma and Undergraduate: 884,900 Postgraduate: 47,991 University Entrance Exam articulation rates: 2001: 68.3% 2006: 71% 2010: 83.8% Year 7 students: 2006: 625,800 2008: 622,100 2010: 532,000 Year 9 students: 2006: 594,000 2008: 538,100 2010: 586,000 Year 12 graduates (mainstream high school): 2006:292,000 2008:295,900 +2010:273,700 Undergraduates and junior college diploma 2006: 720,000 2008: 832,200 2010: 884,900 Graduating higher education students (undergraduate/junior college diploma cohort) 2006: 163,000 2008: 203,200 2010: 233,700
  • 25. Regional reportsā€¦ Liaoning Population: 43.746 million (2010) GDP: RMB 1.82783 trillion (2010) Students: 4.8212 million (2010) Comprising: Kindergarten: 834,000 Primary: 2,183,000 Junior Middle School:1,272,000 Secondary Specialist / Vocational: NA Senior Middle School:715,000 Junior College Diploma and Undergraduate: 880,000 Postgraduate: 82,000 University Entrance Exam articulation rates: 2000: 75% 2006: 74.28% 2010: 87% Year 7 students: 2006: 504,800 2008: 459,000 2010: 397,000 Year 9 students: 2006: 541,900 2008: 464,000 2010: 455,000 Year 12 graduates (mainstream high school): 2006: 224,500 2008: 257,000 + 226,000 2010: Undergraduates 2006: 720,500 2008: 820,000 2010: 880,000 Graduating higher education students (undergraduate/junior college diploma cohort) 2006: 155,000 2008: 202,000 2010: 220,000
  • 26. Regional reportsā€¦ Heilongjiang Population: 38.312 million (2010) GDP: RMB 1.0235 trillion (2010) Students: 5.413 million (2010) Comprising: Kindergarten: 492,000 Primary: 1,880,000 Junior Middle School: 1,291,000 Secondary Specialist / Vocational: 360,000 Senior Middle School: 617,000 Junior College Diploma and Undergraduate: 719,000 Postgraduate: 54,467 University Entrance Exam articulation rates: 2000:30% 2006: 74.89% 2010: 90.77% * First Province to ever exceed 90% gaokao articulation. Year 7 students: 2006: 422,000 2008: 390,000 2010: 363,000 Year 9 students: 2006: 537,000 2008: 447,000 2010: 405,000 Year 12 graduates (mainstream high school): 2006: 182,000 2008: 204,000 + 196,000 2010: Undergraduates 2006: 584,000 2008: 678,000 2010: 719,000 Graduating higher education students (undergraduate/junior college diploma cohort) 2006: 129,000 2008: 170,000 2010: 181,000
  • 27. Regional reportsā€¦ Sichuan Population: 80.418 million (2010) GDP: RMB 1.6898.6 trillion (2010) Students: 17.923million (2010) Comprising: Kindergarten: NA Primary: 5,921,000 Junior Middle School: 4,901,000 Secondary Specialist / Vocational: 1,400,000 Senior Middle School: 1,462,000 Junior College Diploma and Undergraduate: 1,086,000 Postgraduate: 78,000 University Entrance Exam articulation rates: 2006: 60% 2007: 53.53% 2010: 70% Year 7 students: 2006: 1,262,356 2008: 1,251,700 2010: 1,116,200 Year 9 students: 2006: NA 2008: NA 2010: NA Year 12 graduates (mainstream high school): 2006: Not available 2008: NA + NA 2010: Undergraduates 2006: 861,000 2008: 991,000 2010: 1,086,000 Graduating higher education students (undergraduate/junior college diploma cohort) 2006: 173,000 2008: 248,000 2010: 279,000
  • 28. Regional reportsā€¦ Chongqing Population: 28.8462 million (million holding residence permits) (2010) GDP: RMB 0.78942 trillion (2010) Students: 4.9999 million (2010) Comprising: Kindergarten: NA Primary: 1,999,400 Junior Middle School: 1,281,700 Secondary Specialist / Vocational: 526,600 Senior Middle School: 626,400 Junior College Diploma and Undergraduate: 522,700 Postgraduate: 43,100 University Entrance Exam articulation rates: 2006: 60% 2007: 58% 2010: 78.55% Year 7 students: 2006: 643,900 2008: 688,800 2010: 408,500 Year 9 students: 2006: 529,400 2008: 545,900 2010: 416,600 Year 12 graduates (mainstream high school): 2006: 190,000 + 189,000 2008: 2010: 169,500 Undergraduates 2006: 376,100 2008: 450,000 2010: 522,700 Graduating higher education students (undergraduate/junior college diploma cohort) 2006: 76,500 2008: 99,700 2010: 122,800
  • 29. Regional reportsā€¦ Shaā€™anxi Population: 37.327378 million (million holding residence permits) (2010) GDP: RMB 1.002153 trillion (2010) Students: 7.5553 million (2010) Comprising: Kindergarten: 704,800 Primary: 2,610,400 Junior Middle School: 1,643,200 Secondary Specialist / Vocational: 628,200 Senior Middle School: 955,900 Junior College Diploma and Undergraduate: 927,800 Postgraduate: 85,000 University Entrance Exam articulation rates: 2006:59.5% 2008:59.34% 2010:60.2% Year 7 students: 2006: 696,400 2008: 615,300 2010: 493,400 Year 9 students: 2006: 700,900 2008: NA 2010: NA Year 12 graduates (mainstream high school): 2006: 277,400 + NA 2008: 2010: NA Undergraduates 2006: 726,200 2008: 839,700 2010: 927,800 Graduating higher education students (undergraduate/junior college diploma cohort) 2006: 157,800 2008: 250,000 2010: 265,000
  • 30. Regional reportsā€¦ Hunan Population: 65.683722 million (million holding residence permits) (2010) GDP: RMB 1.590212 trillion (2010) Students: 11.2471 million (2010) Comprising: Kindergarten: 1,419,100 Primary: 4,791,600 Junior Middle School: 2,149,200 Secondary Specialist / Vocational: 764,800 Senior Middle School: 1,019,000 Junior College Diploma and Undergraduate: 1,047,200 Postgraduate: 56,200 University Entrance Exam articulation rates: 2000:50% 2006:48.9% 2008:51% 2010:81% Year 7 students: 2006: NA 2008: 719,100 2010: 734,400 Year 9 students: 2006: NA 2008: 774,200 2010: 697,500 Year 12 graduates (mainstream high school): + NA 2006: 2008: 430,000 2010: 361,800 Undergraduates 2006: 831,000 2008: 952,300 2010: 1,047,200 Graduating higher education students (undergraduate/junior college diploma cohort) 2006: 208,369 2008: 244,700 2010: 276,100
  • 31. Regional reportsā€¦ Henan Population: 94.023567 million (million holding residence permits) (2010) GDP: RMB 2.294268 trillion (2010) Students: 20.699721 million (2010) Comprising: Kindergarten: NA Primary: 10,705,300 Junior Middle School: 4,694,000 Secondary Specialist / Vocational: 1,893,100 Senior Middle School: 1,921,600 Junior College Diploma and Undergraduate: 1,456,700 Postgraduate: 29,021 University Entrance Exam articulation rates: 2006: 58.97% 2008: 42% 2010: 64.6% Year 7 students: 2006: 1,661,900 2008: 1,651,300 2010: 1,588,100 Year 9 students: 2006: 1,880,600 2008: 1,830,700 2010: 1,549,200 Year 12 graduates (mainstream high school): 2006: 573,600 2008: 749,800 + 704,300 2010: Undergraduates 2006: 974,100 2008: 1,250,200 2010: 1,456,700 Graduating higher education students (undergraduate/junior college diploma cohort) 2006: 202,100 2008: 302,500 2010: 382,500
  • 32. + EIC Group China Chinaā€™s leading international education services provider. http://partners.eic.org.cn