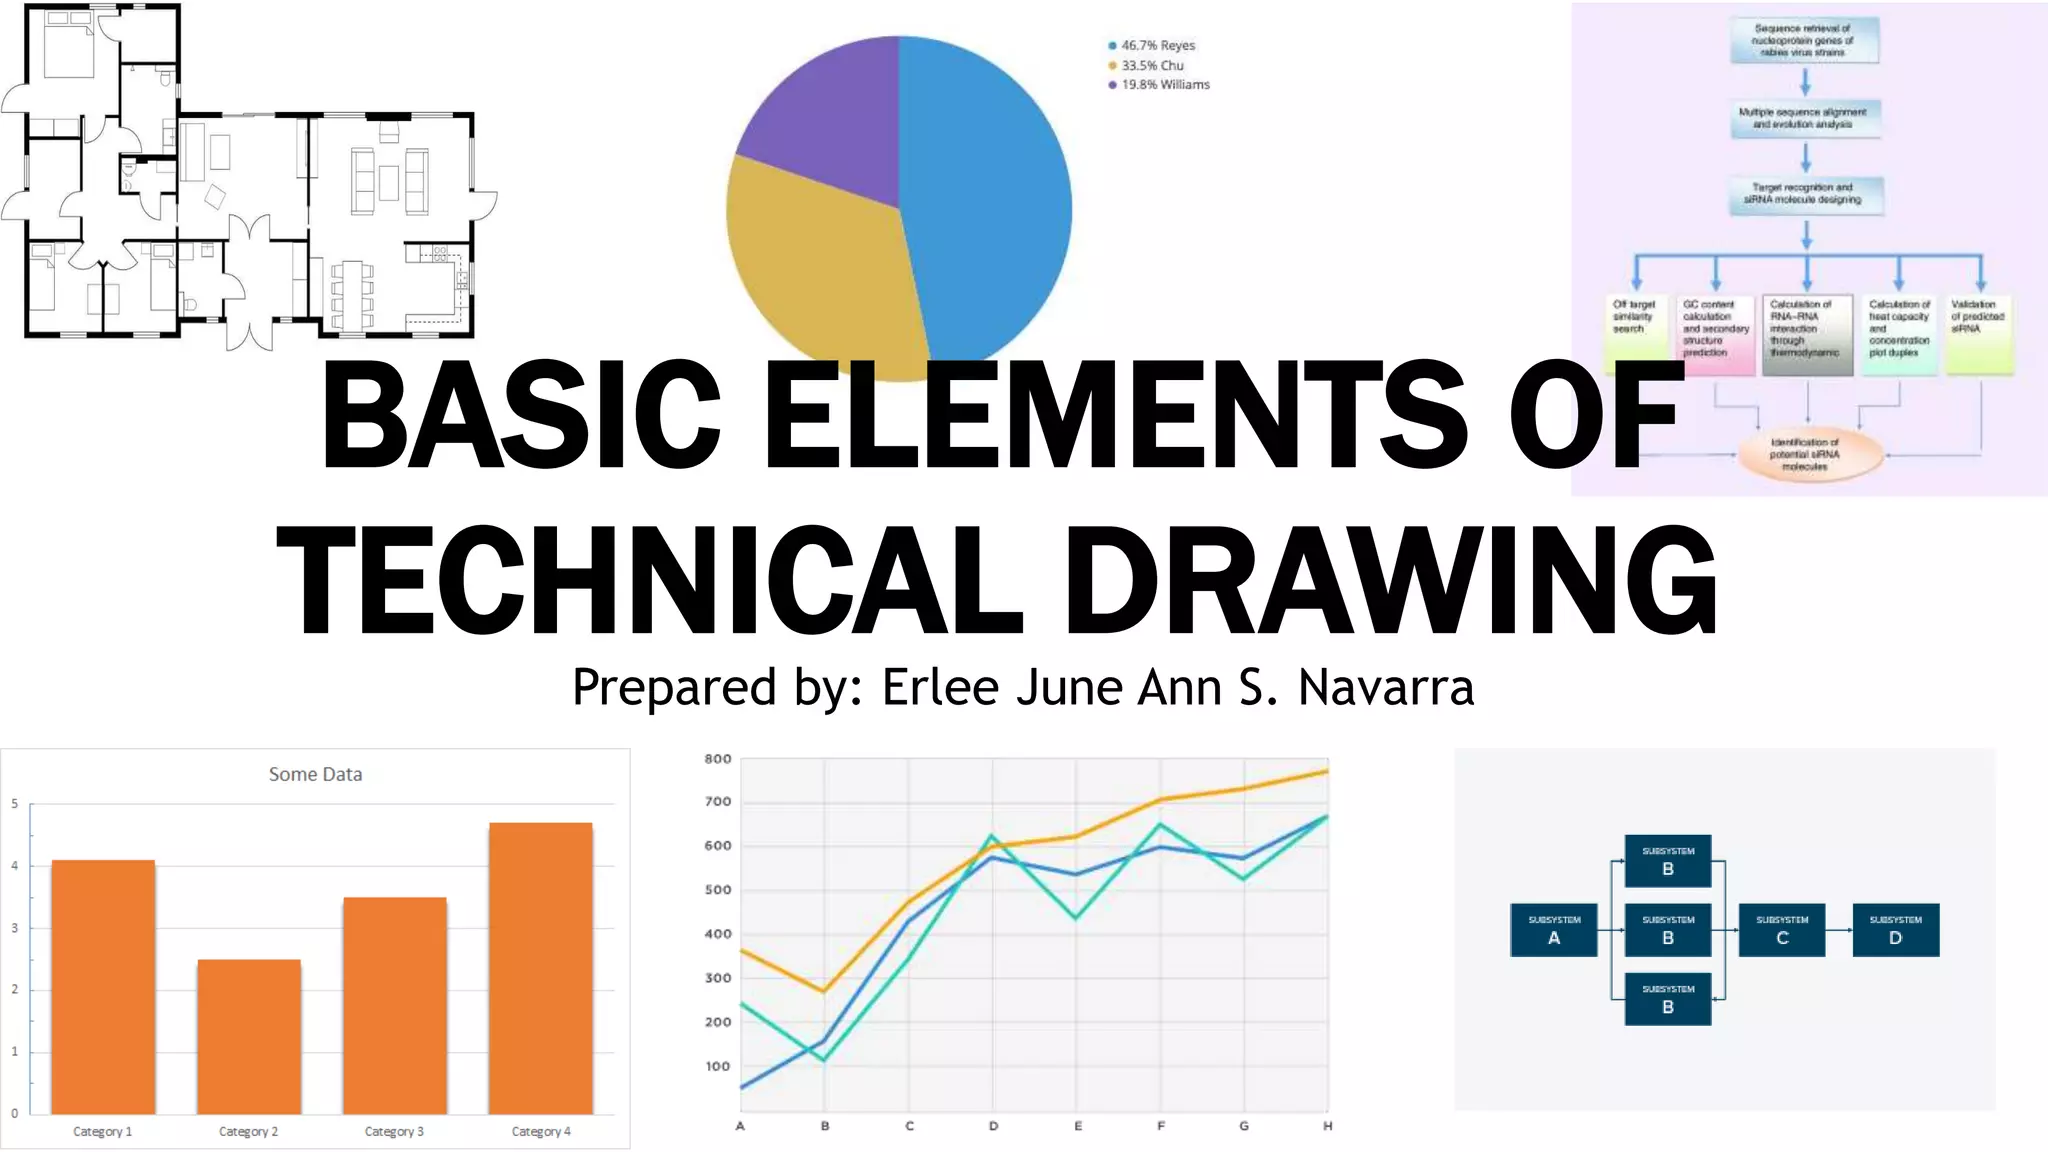
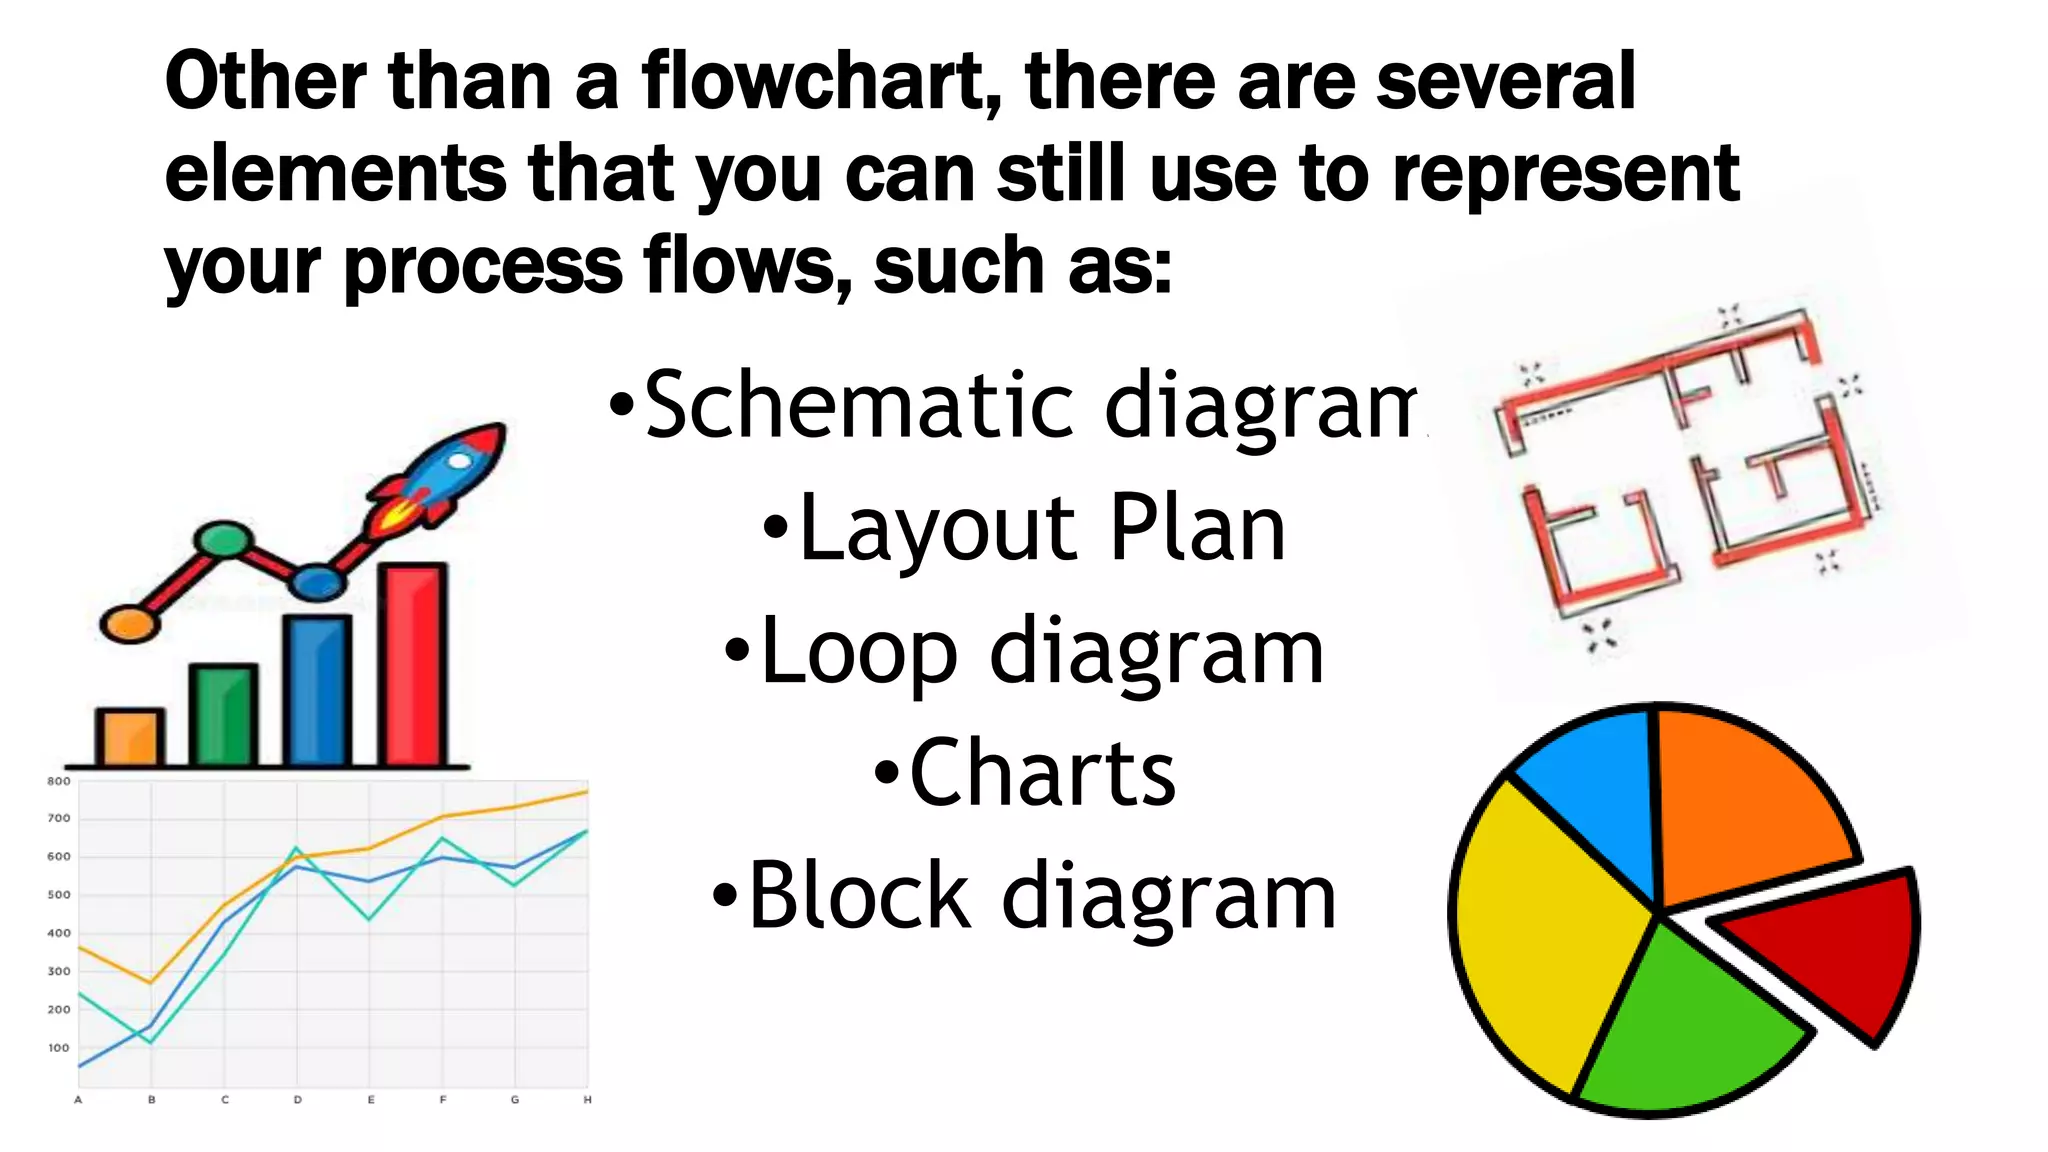
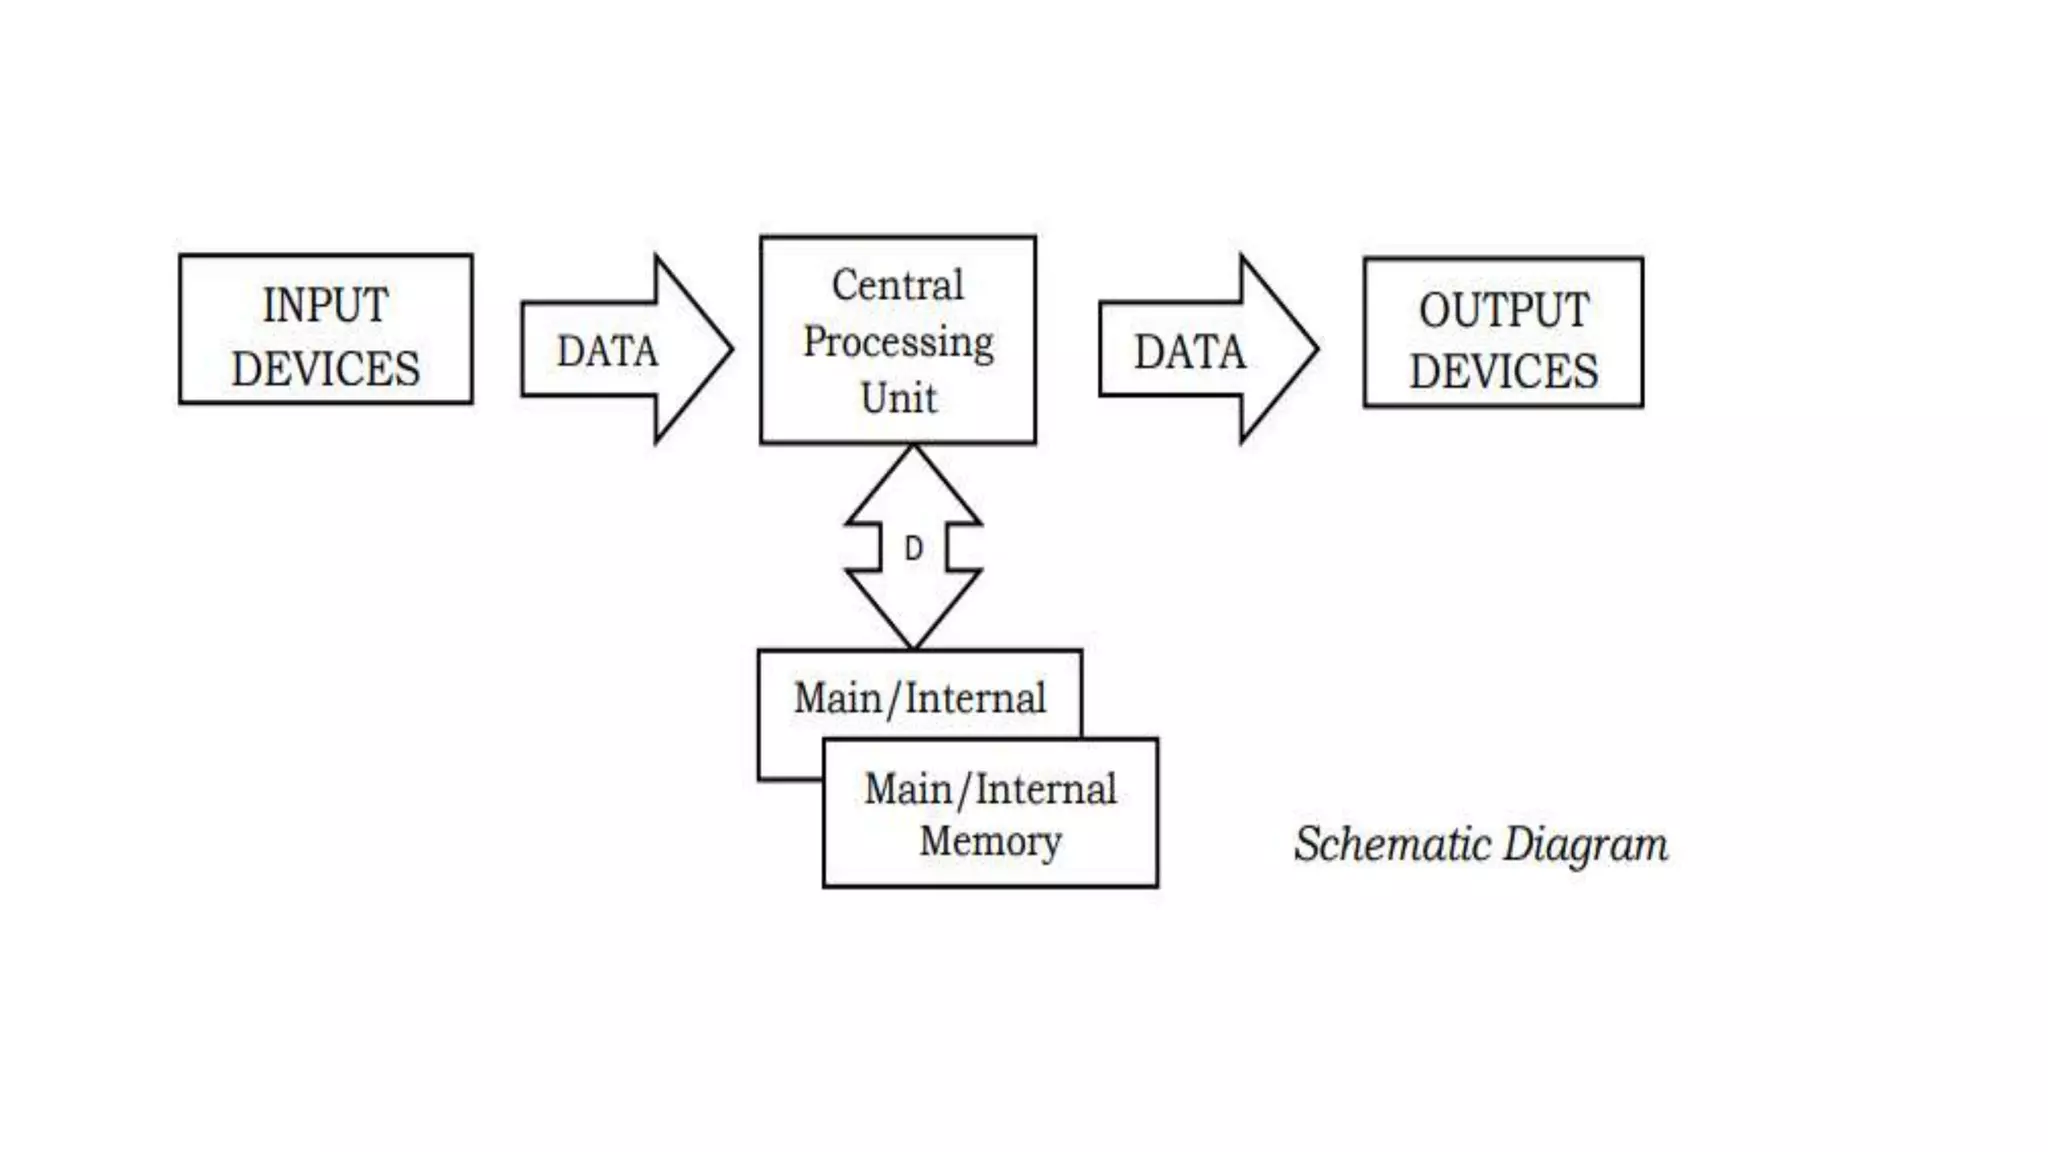
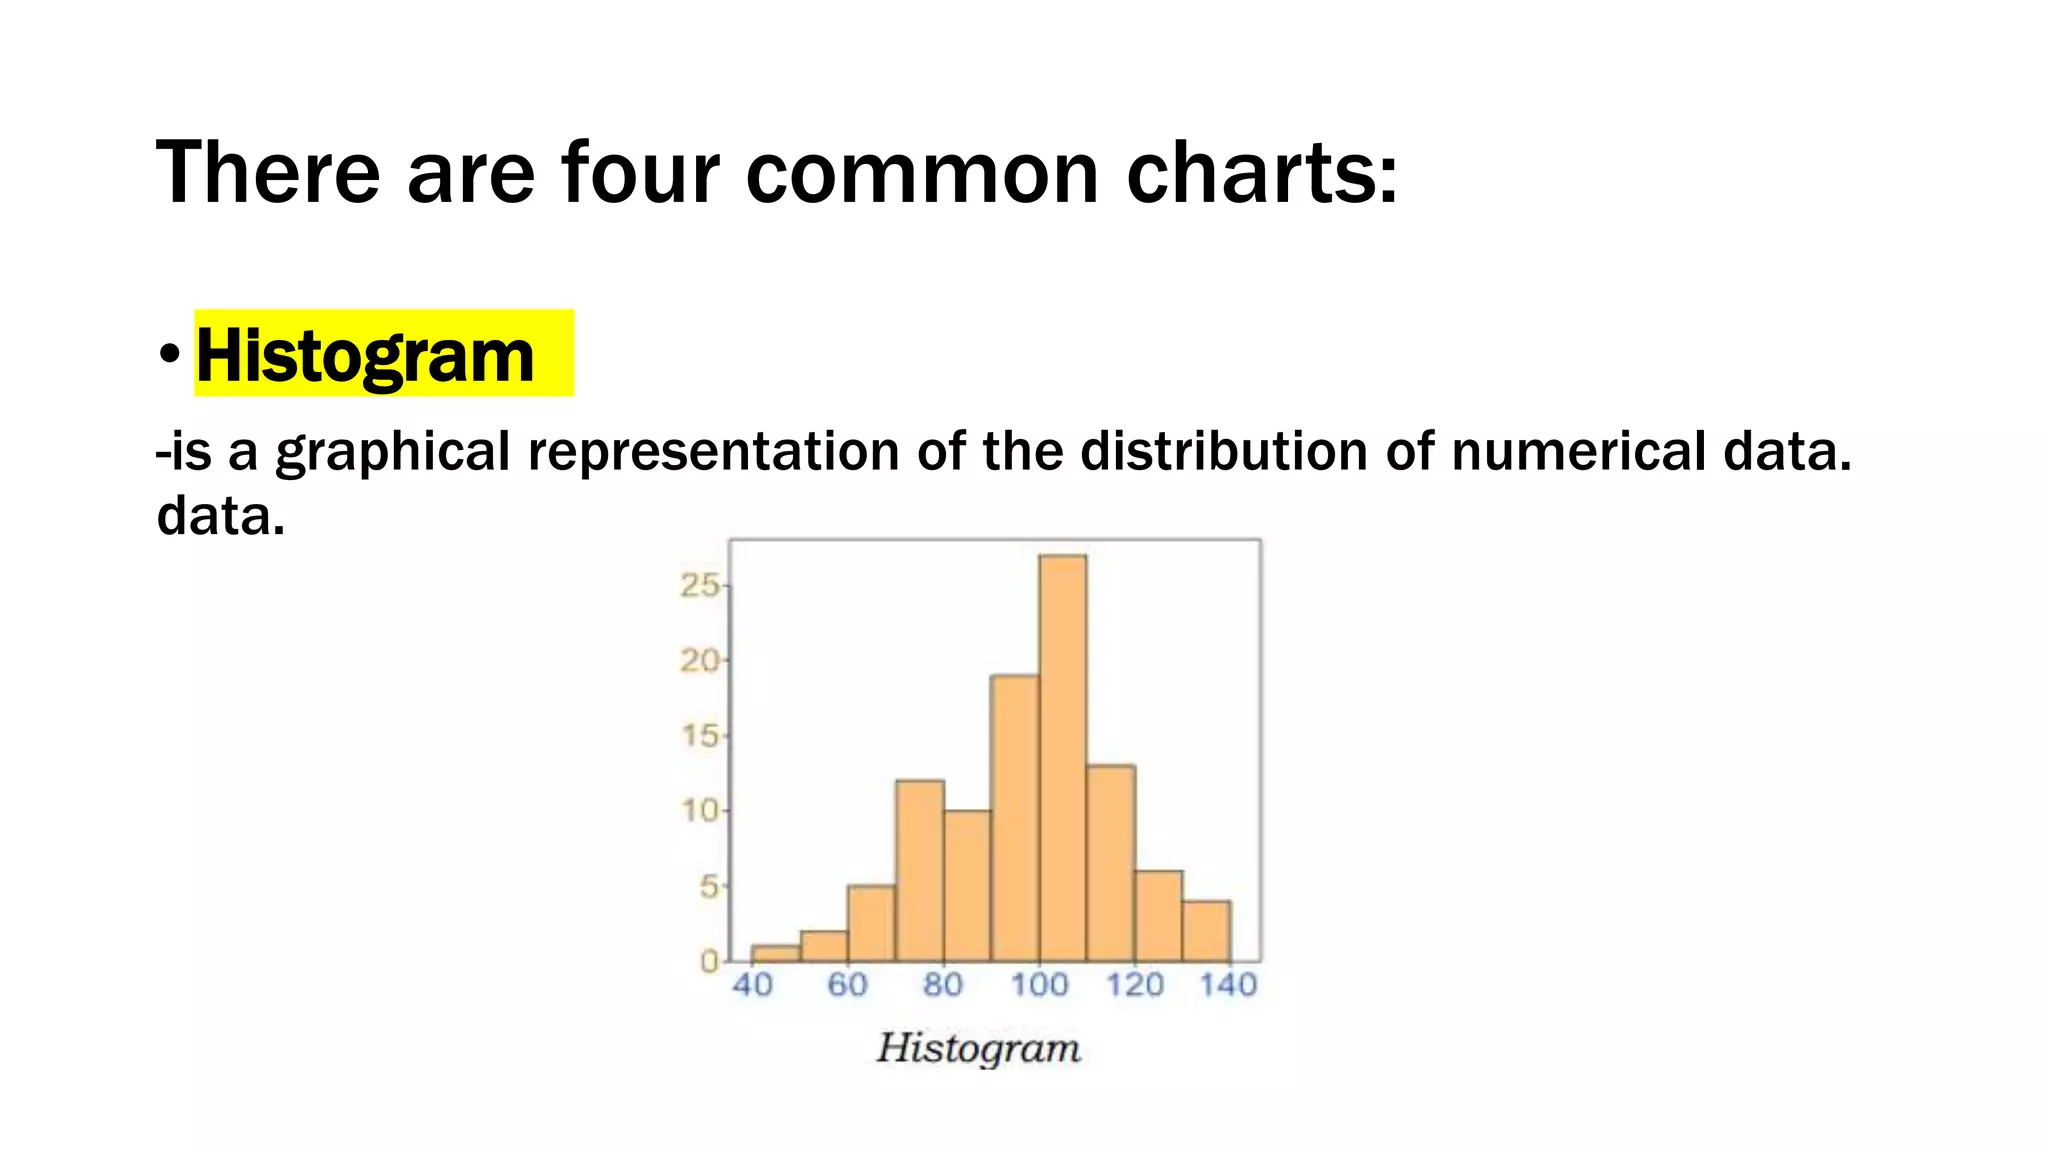
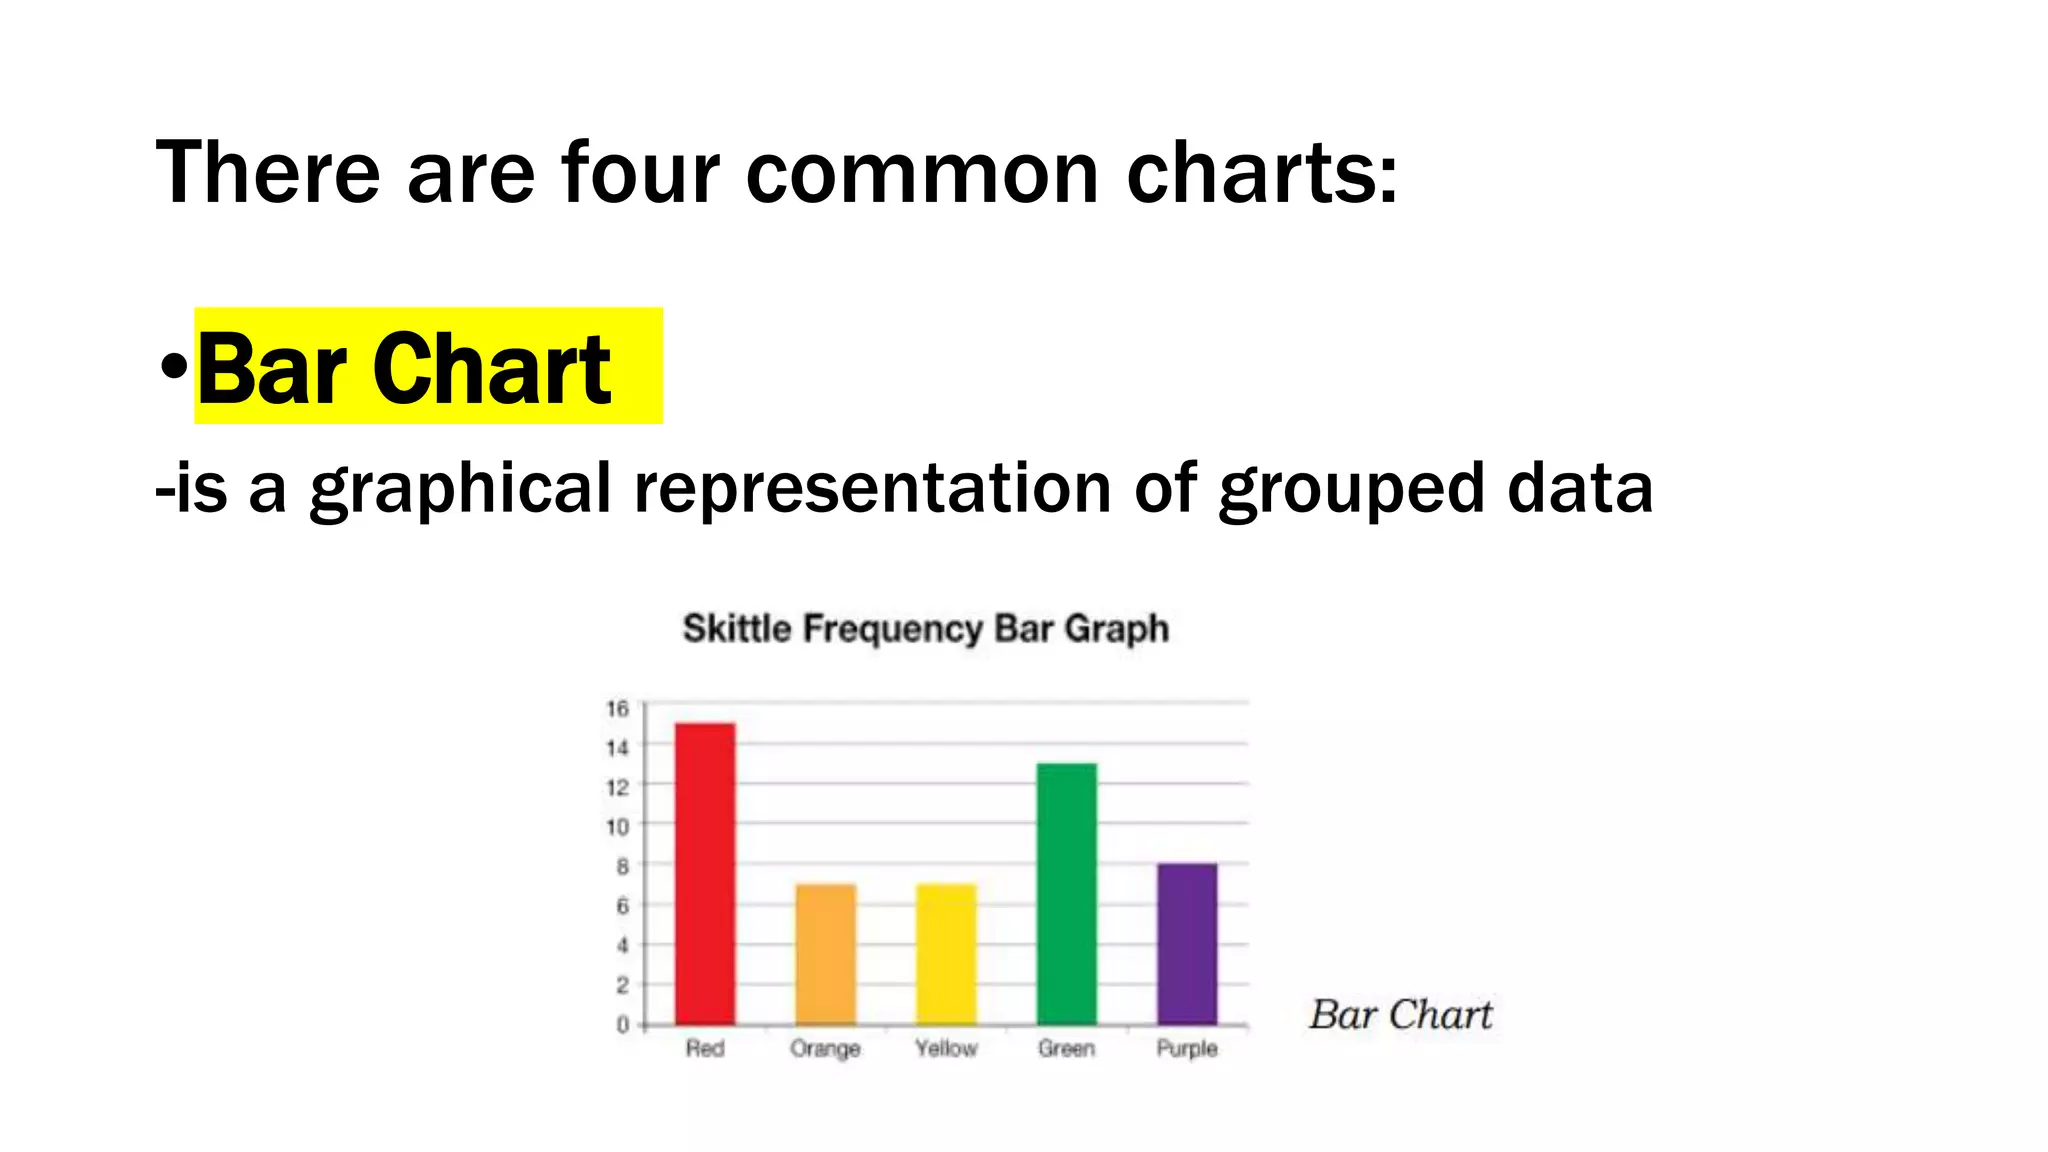
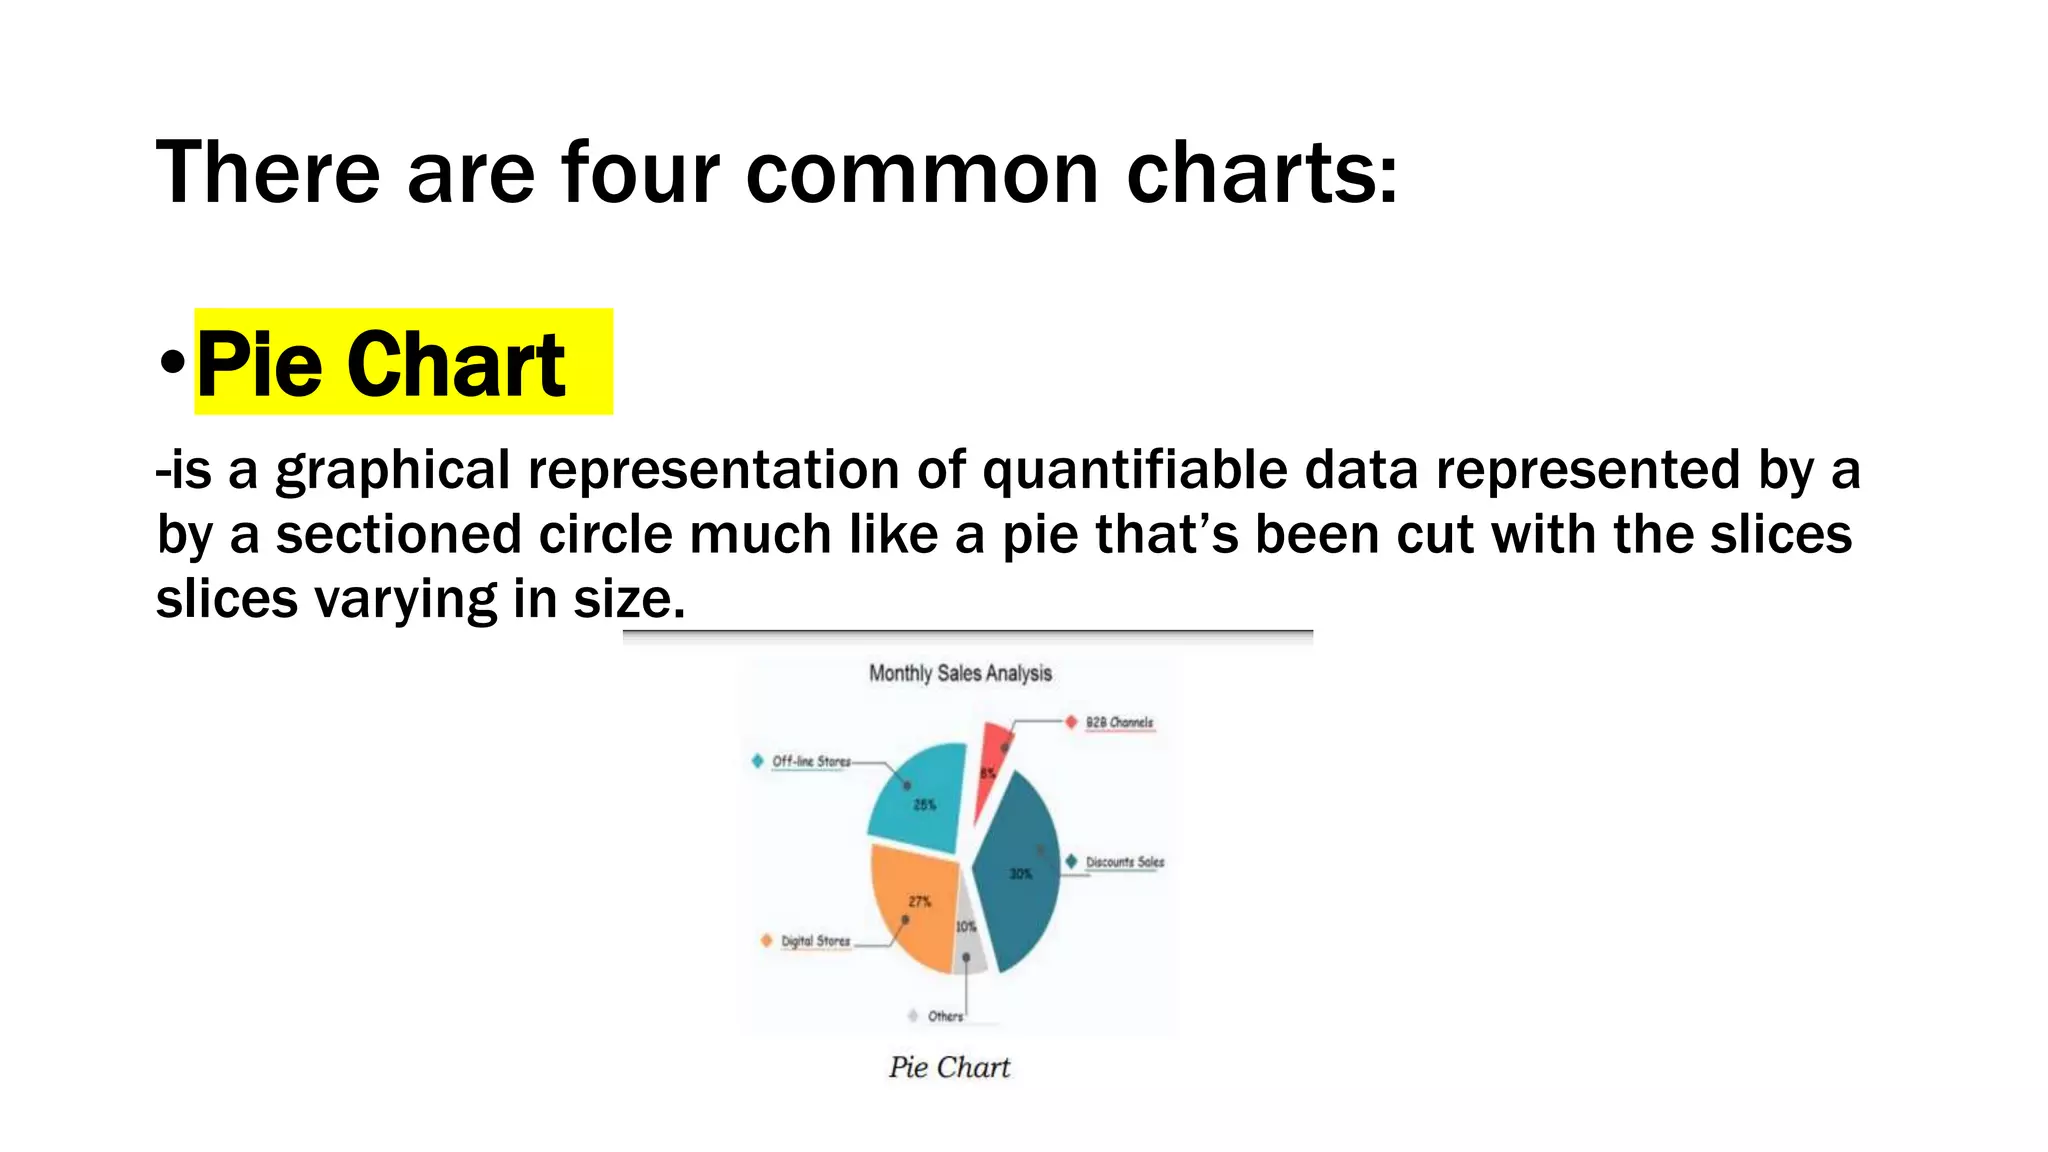
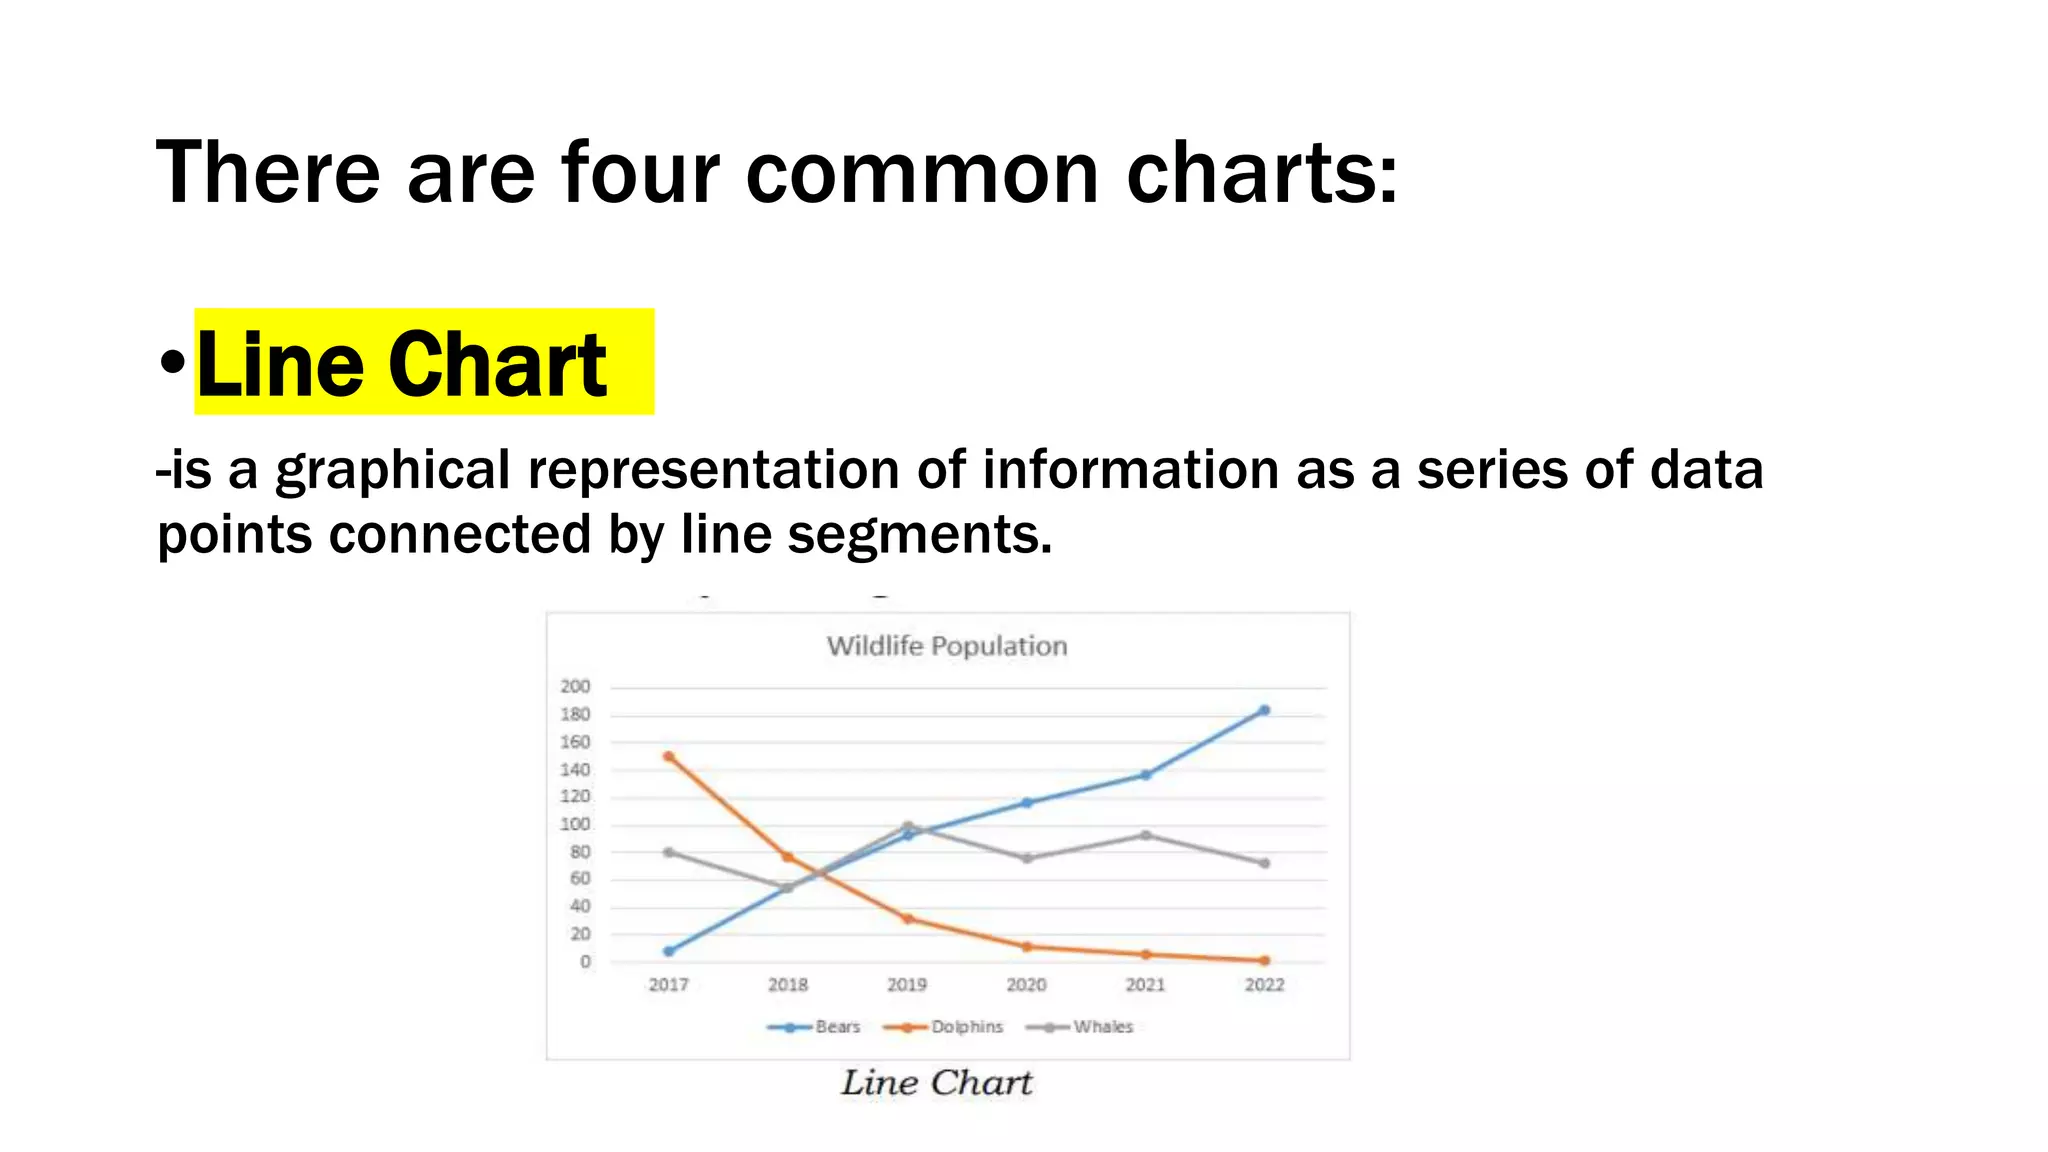
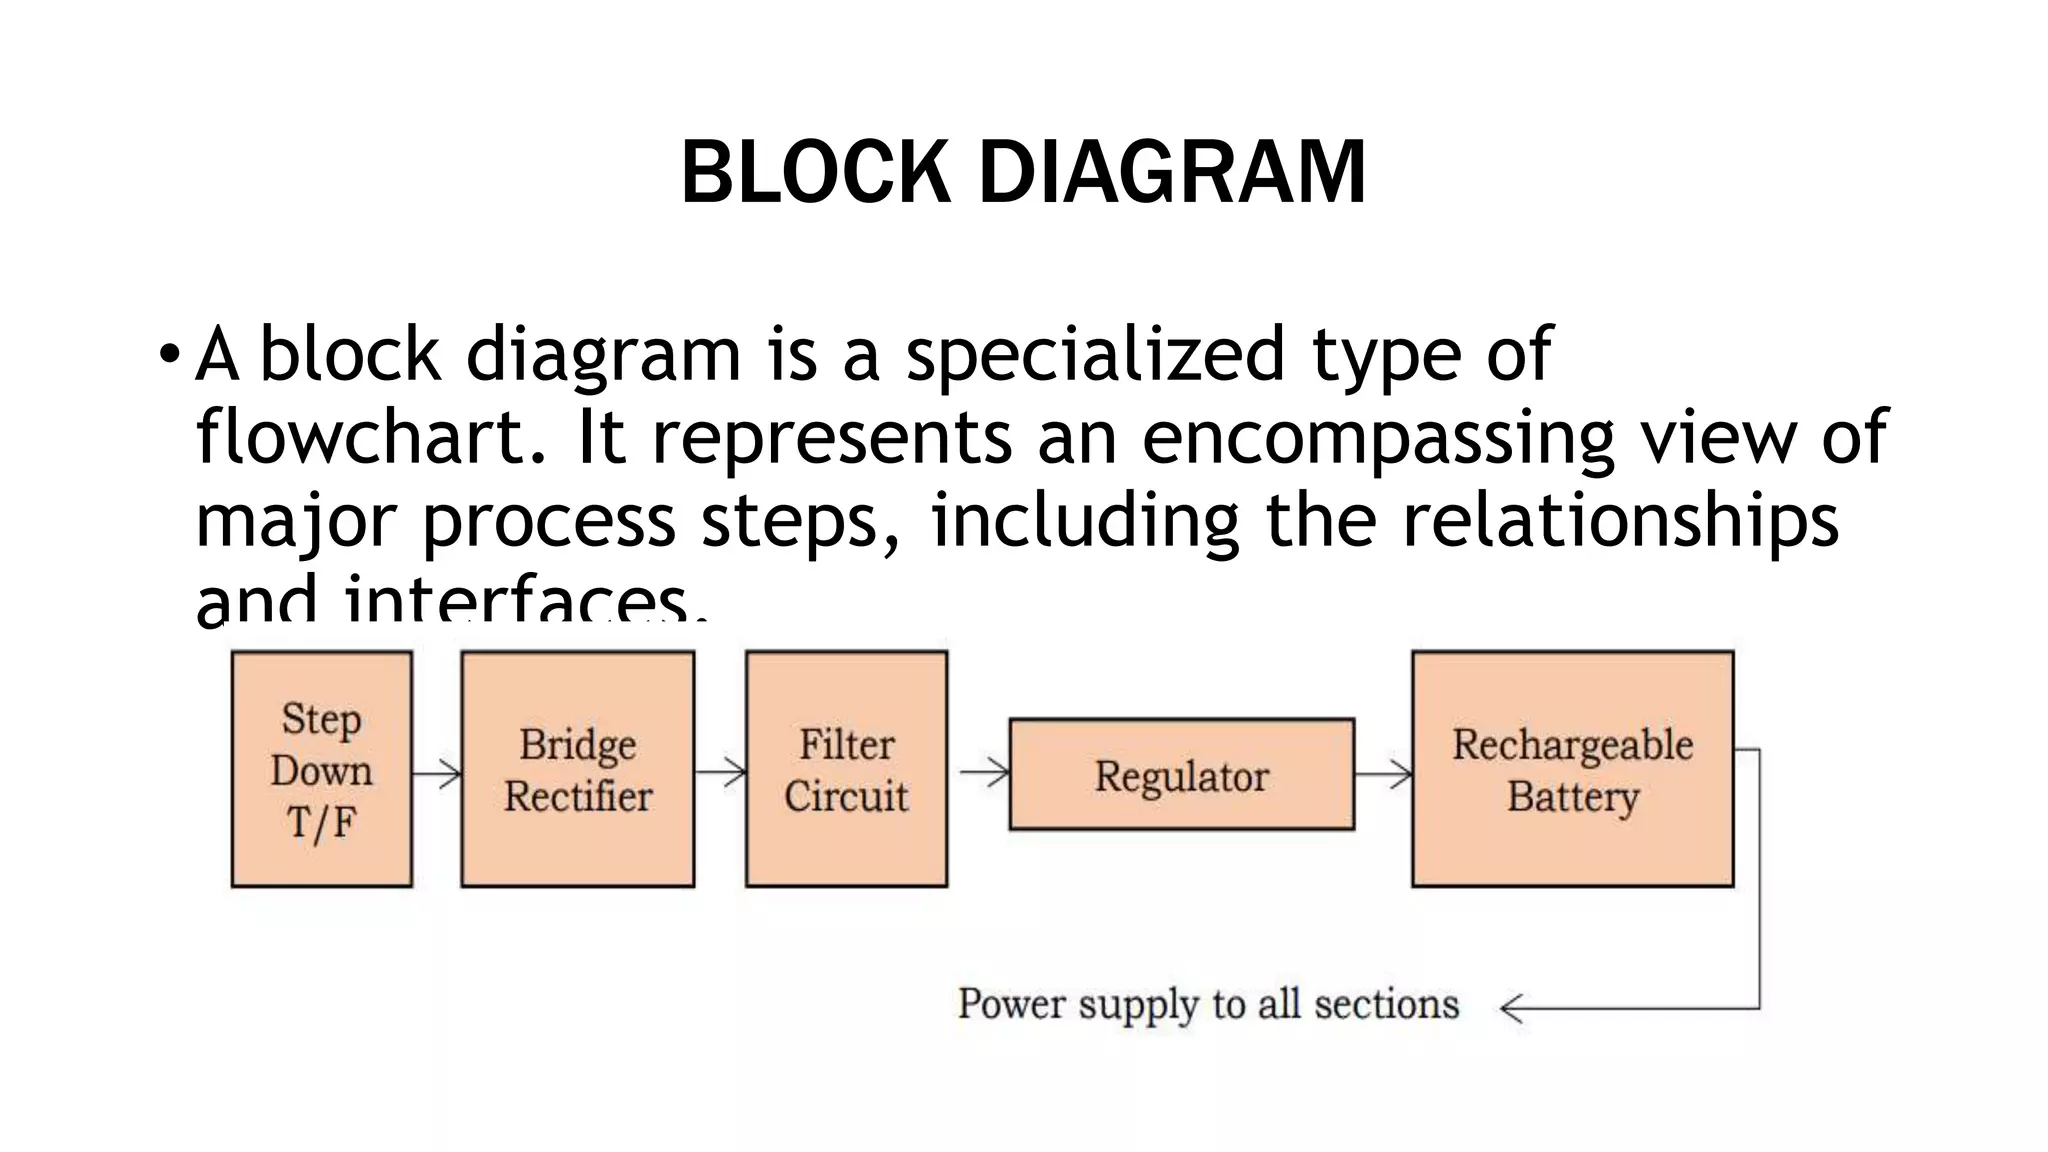
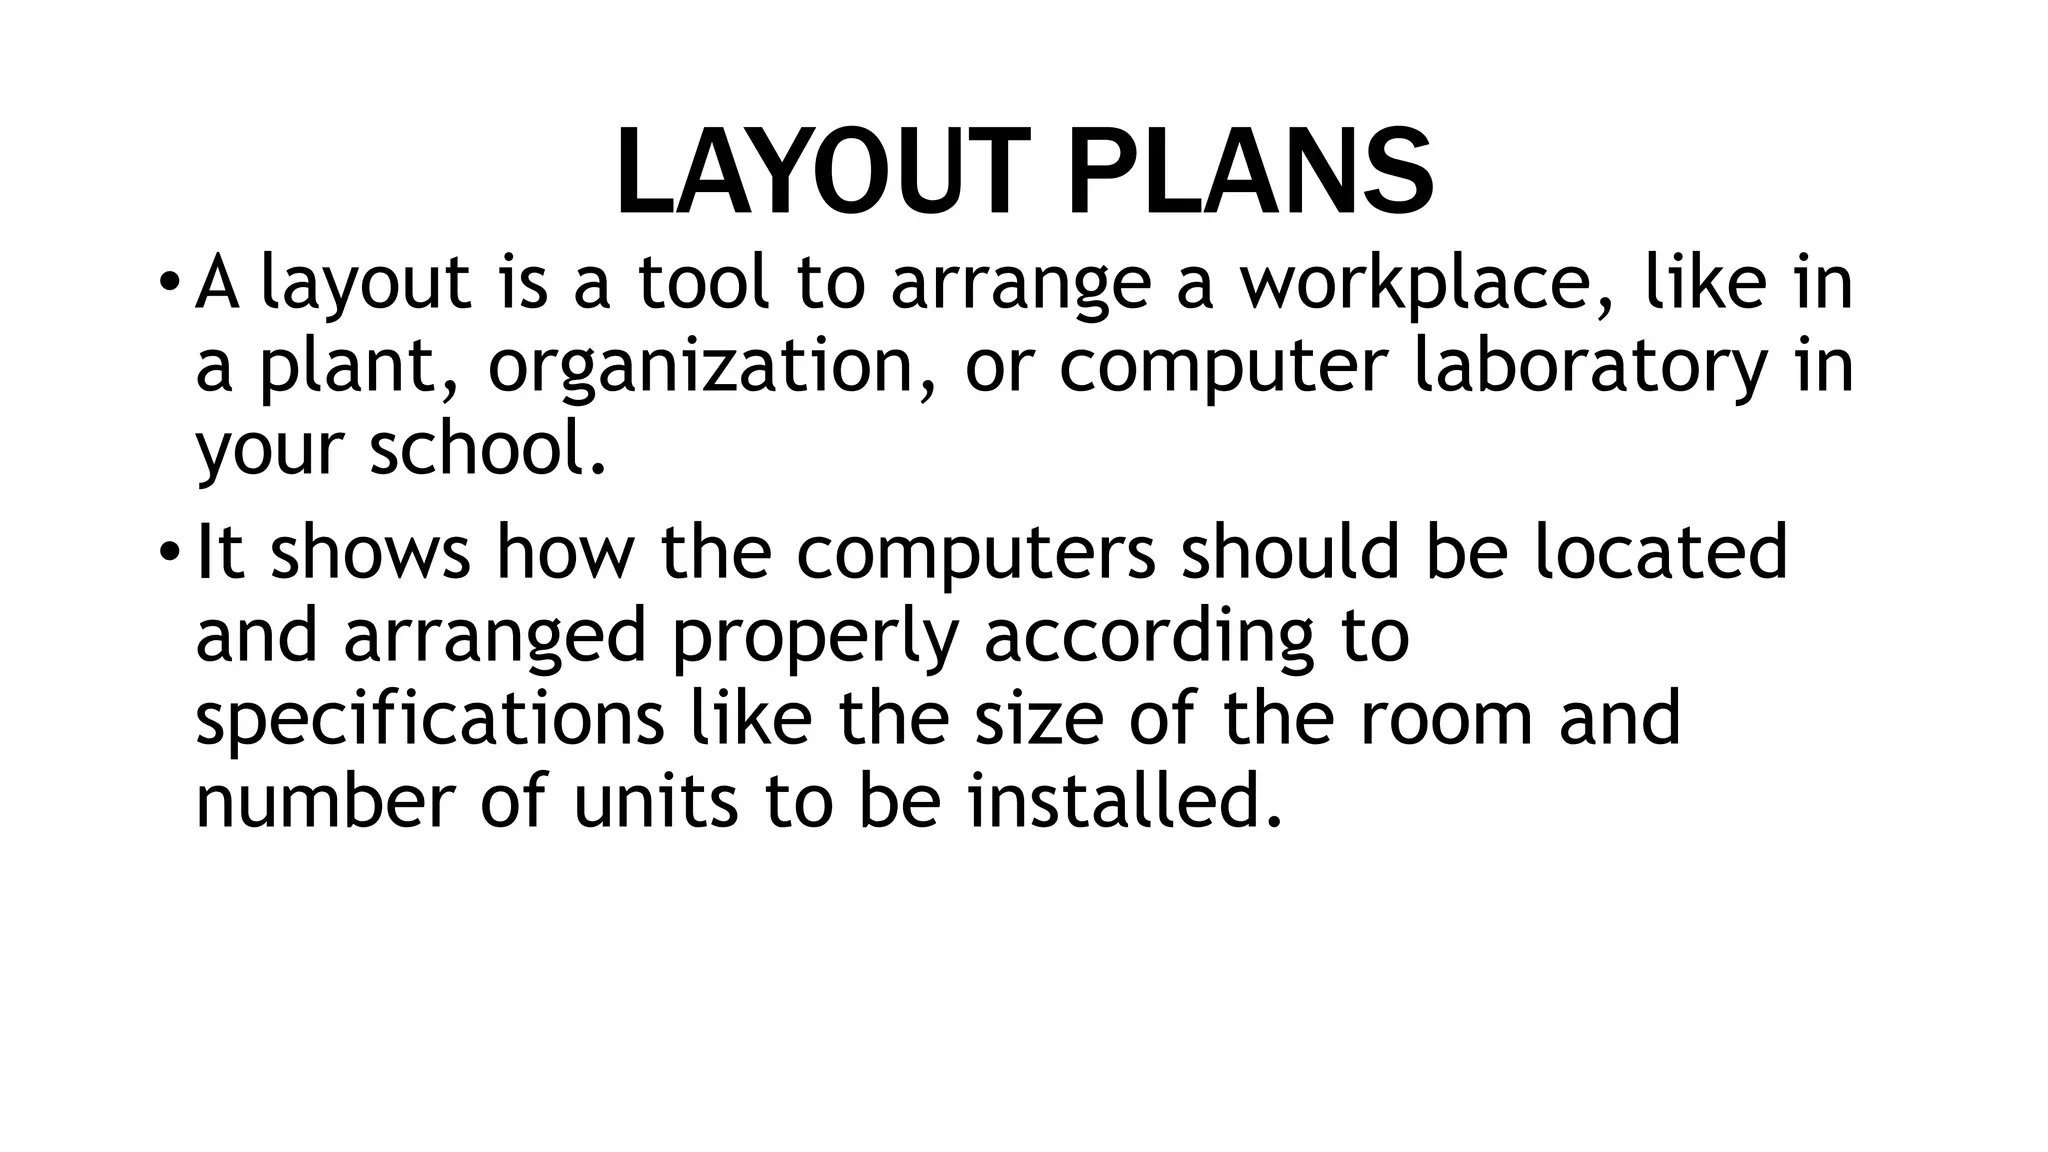
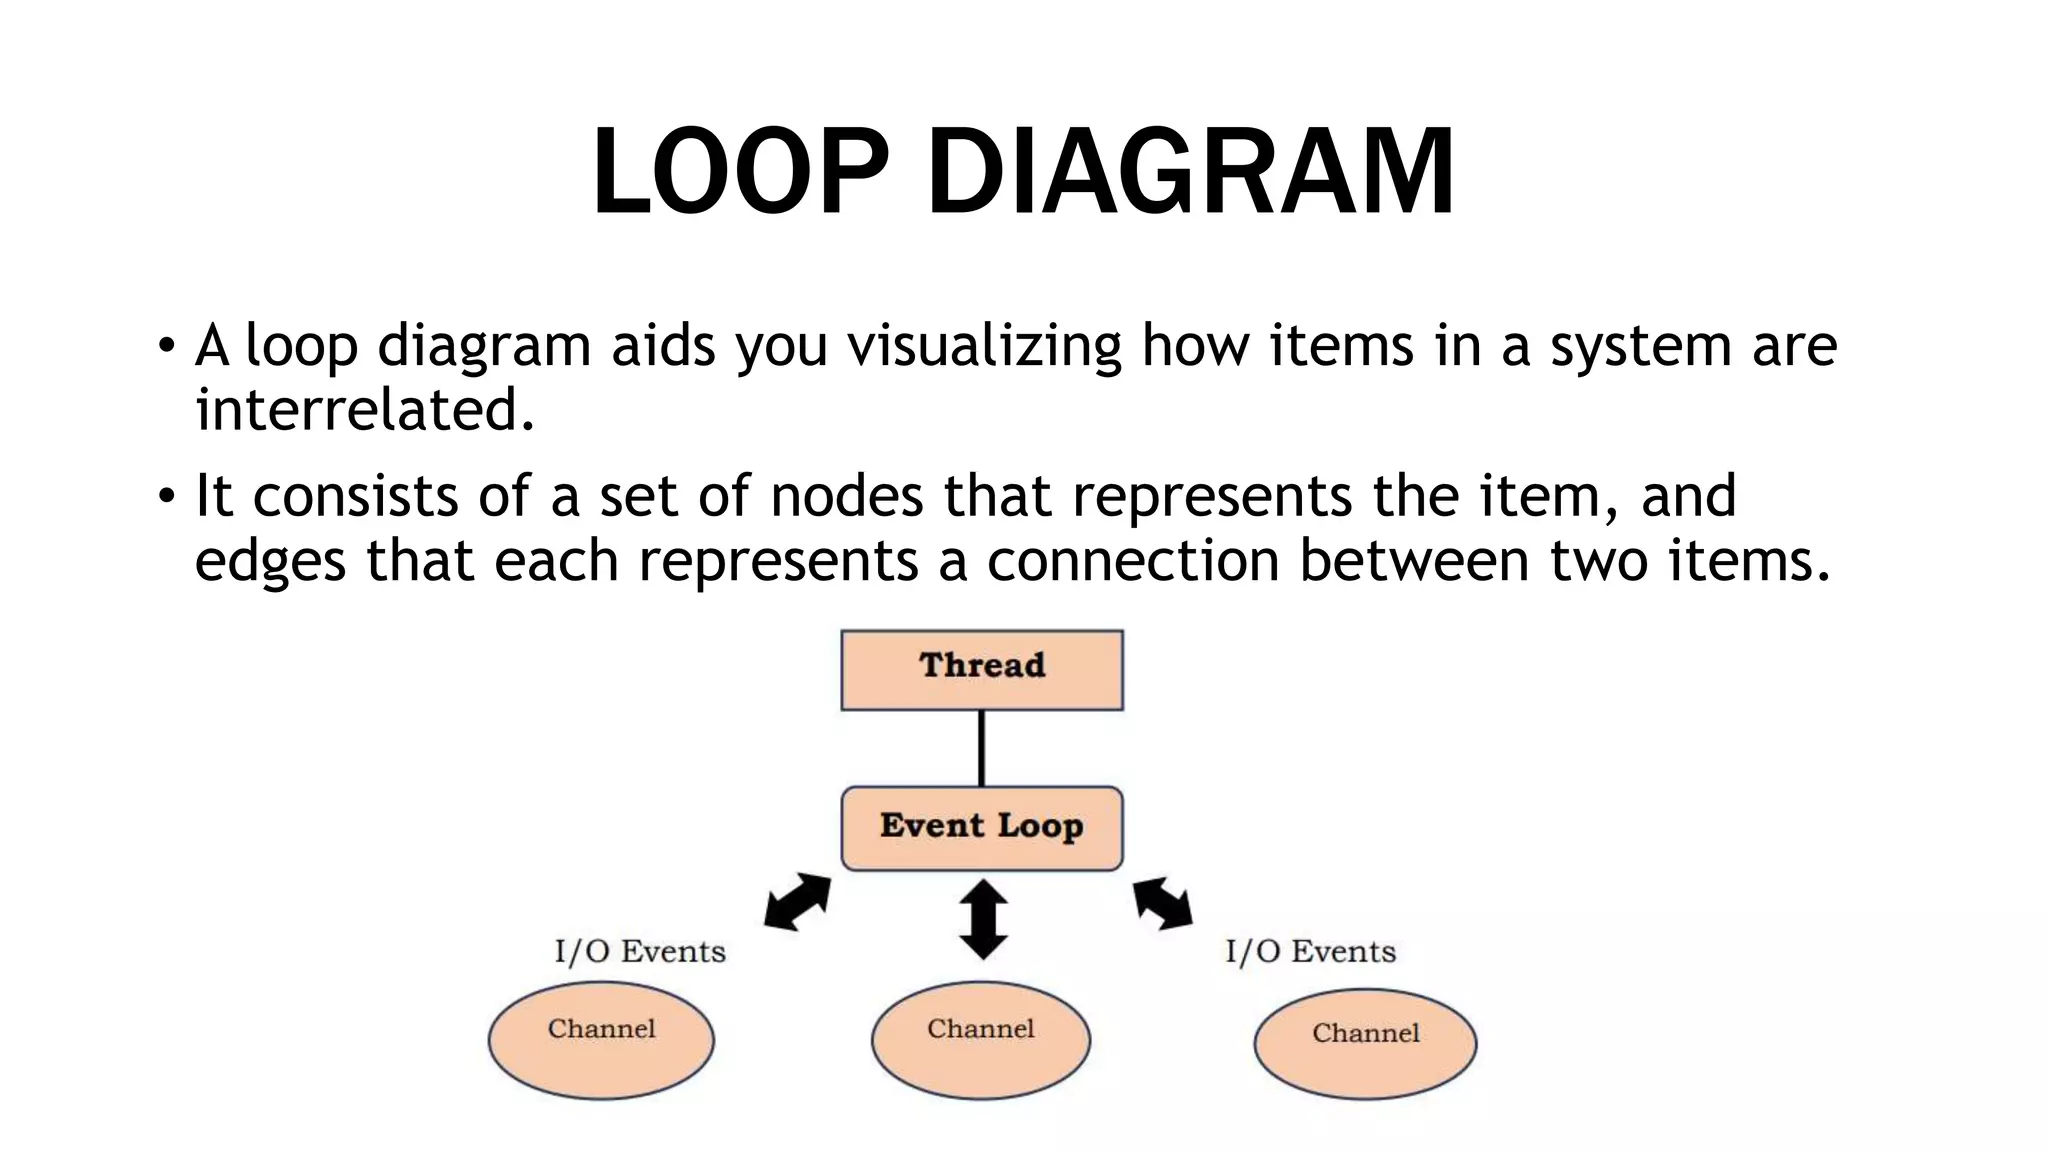
This document defines and provides examples of different types of diagrams and charts used in technical drawing to represent processes and relationships. It discusses flowcharts, schematic diagrams, charts including histograms, bar charts, pie charts and line charts, block diagrams, layout plans, and loop diagrams. Flowcharts provide a breakdown of steps to solve a problem while schematic diagrams and charts can represent processes, data, and relationships between variables in an abstract graphical form removing unnecessary details.