Downloaded 110 times


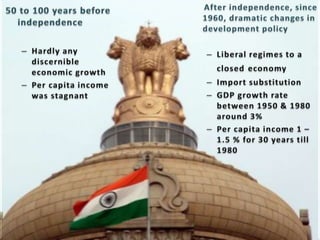


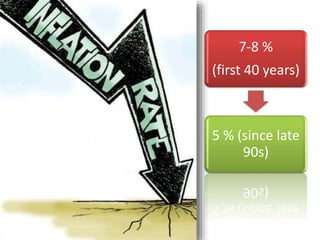


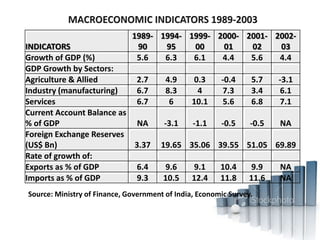
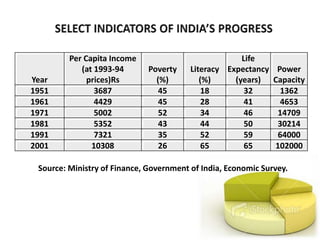
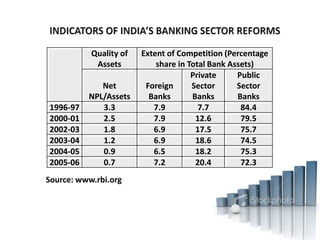

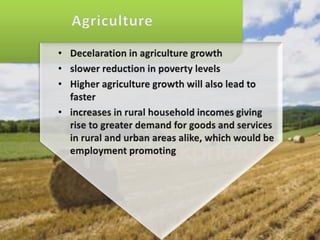
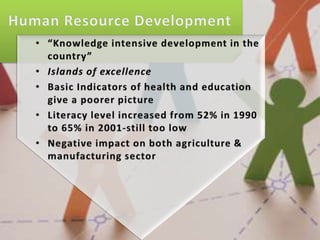
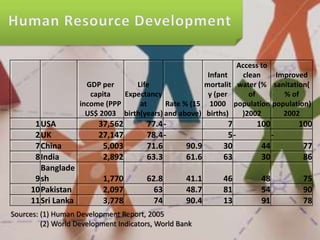


This document contains economic indicators for India from 1989-2003 and socioeconomic indicators for India and other countries from 1951-2005. It shows that India's GDP growth was between 5-8% for the first 40 years and has been around 5% since the late 1990s. Key sectors like agriculture, industry and services have all grown but agriculture growth has slowed in recent years. Poverty and literacy rates improved over time but India still lags countries like China, Bangladesh and Pakistan on socioeconomic measures like life expectancy, infant mortality, access to clean water and sanitation.


![[Feb 2020] - India @ 2030 - Mohandas Pai](https://cdn.slidesharecdn.com/ss_thumbnails/3one4capitalindia2030-mohandaspaifeb2020-200722145520-thumbnail.jpg?width=640&height=640&fit=bounds)


